The distance travelled by a body in different time intervals is tabulated as follows . Draw the distance time graphs.

1 yotta metre =1022 metre =1019 km
Topper's Solved these Questions
- BOOK - PEARSON IIT JEE FOUNDATIONCHAPTER - MEASUREMENTSEXERCISE - Level 38videos
MEASUREMENTS
- BOOK - PEARSON IIT JEE FOUNDATIONCHAPTER - MEASUREMENTSEXERCISE - Level 144videos
MEASUREMENTS
- BOOK - PEARSON IIT JEE FOUNDATIONCHAPTER - MAGNETISMEXERCISE - Level-310videos
MAGNETISM
- BOOK - PEARSON IIT JEE FOUNDATIONCHAPTER - MODERN PHYSICSEXERCISE - Level 35videos
MODERN PHYSICS
Similar Questions
The distances travelled by a car at various time intervals are as follows :
Draw a distance-time graph for the car.
 View Solution
The distances travelled by a car at various time intervals are as follows :
What conclusion do you get from this graph about the nature of motion of the car ?
 View Solution
Knowledge Check
- Question 1 - Select One
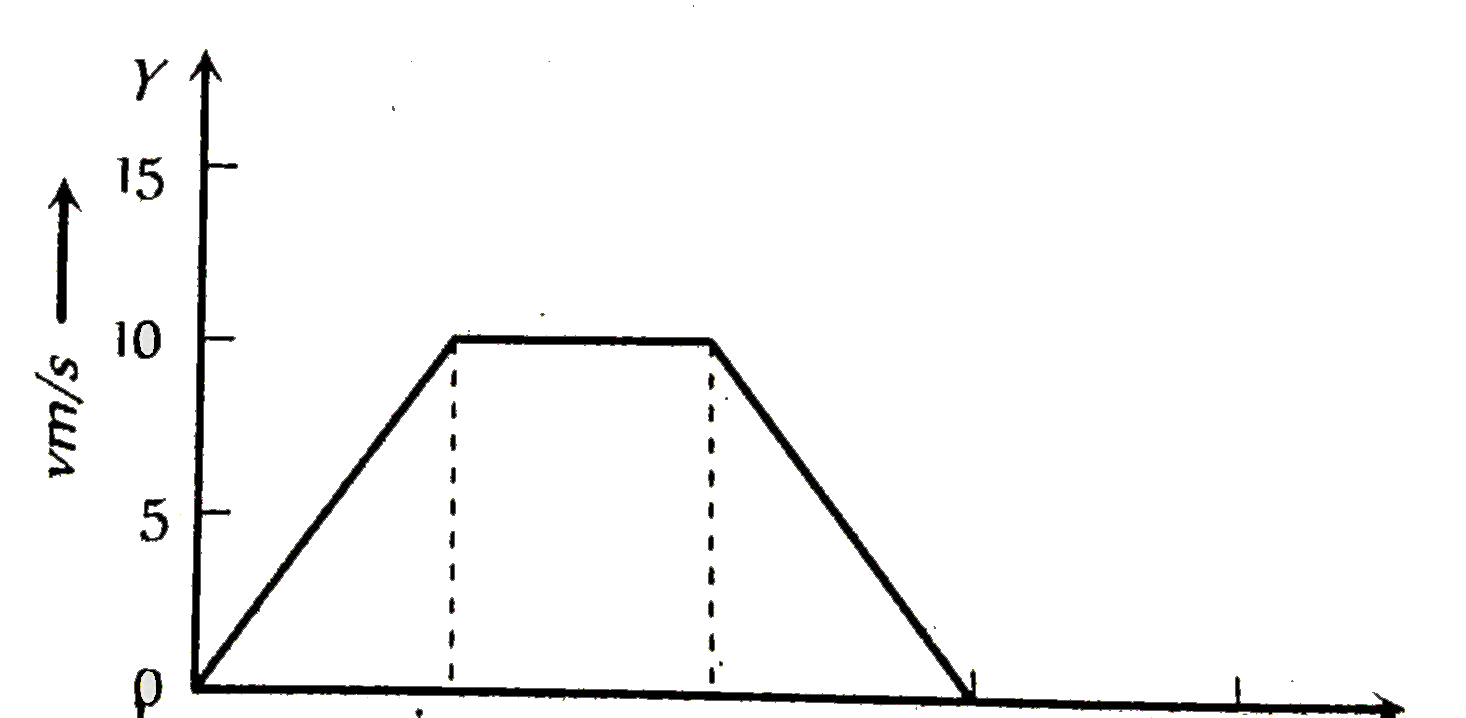
In the following graph, distance travelled by the body in metres is
 A200B250C300D400
The distance traveled by a body is directly proportional to time Is any external force acting on it ?
View SolutionThe following table gives the distances travelled by a car at various time- intervals . Study the table and draw a linear graph for the same.

From your graph, answer the questions given below:
(i) How much distance did the car cover during the period from 7.30 a.m. to 8 a.m.
(ii) What was the time when the car had covered a distance of 100km, since its start ?
(iii) How much distance had the car covered by 8.30 a.m. ?View Solution(a) The distance time graph of a body is parallel to the time axis. What does it indicate ?
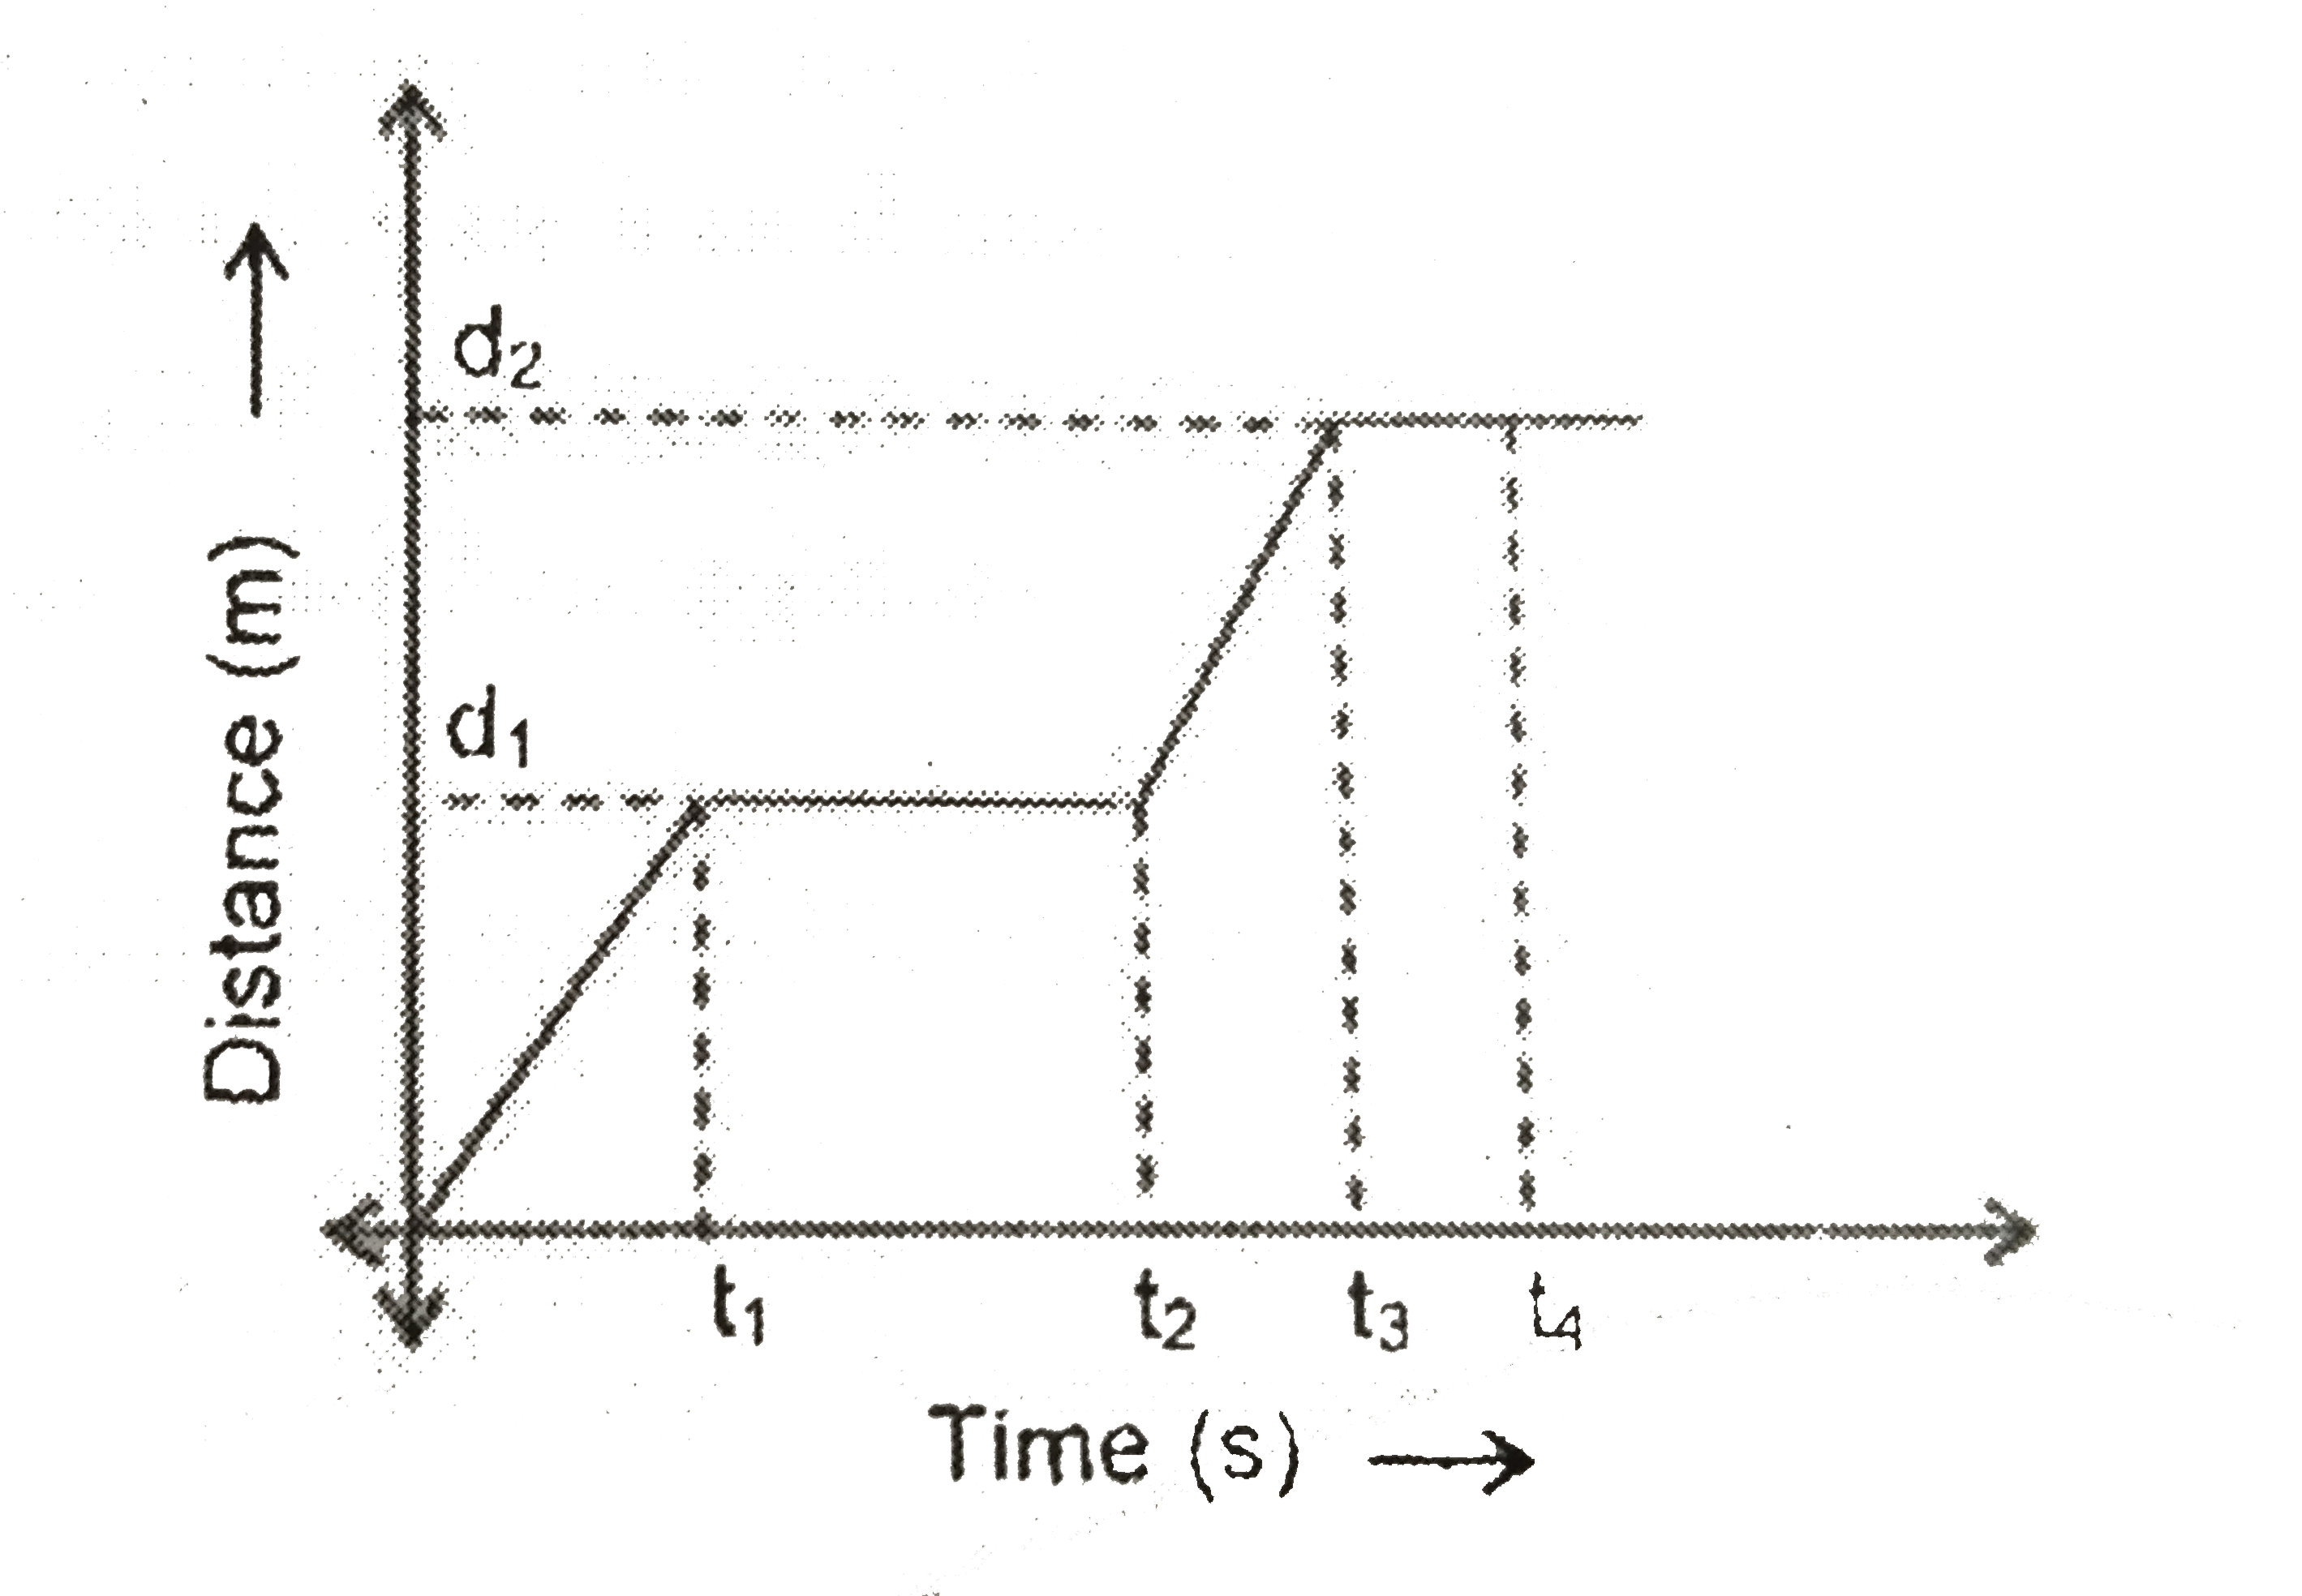
(b) The distance time graph of a body coincide with time axis. What does it indicate ?View SolutionThe distance -time graph of a body moving in a straight line is shown below. Draw the speed time graph of the motion of the body.
 View Solution
A car parked on road draw the shape of distance-time graph for it.
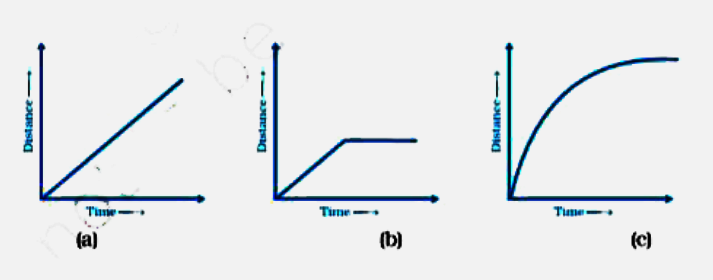
View SolutionExplain the situations represented by the following distance-time graphs.
 View Solution
The distance -time graph of a body moving in a straight line is shown below. Draw the speed time graph of the motion of the body.
 View Solution

