A car parked on road draw the shape of distance-time graph for it.
To draw the distance-time graph for a car that is parked on the road, follow these steps:
1. Understand the Scenario: The car is parked, which means it is not moving. Therefore, its distance from a reference point does not change over time.
2. Define the Axes:
- The horizontal axis (x-axis) will represent time (in seconds).
- The vertical axis (y-axis) will represent distance (in meters).
3. Identify the Characteristics of the Graph:
- Since the car is stationary, the distance remains constant over time. This means that for any point in time, the distance value will be the same.
4. Draw the Graph:
- Start by plotting a point on the distance axis at the distance where the car is parked (let's say 10 meters).
- From this point, draw a horizontal line parallel to the time axis (x-axis). This line indicates that no matter how much time passes, the distance remains at 10 meters.
5. Label the Graph:
- Label the horizontal axis as "Time (seconds)" and the vertical axis as "Distance (meters)".
- You can also label the line with a note that says "Car Parked".
Final Graph:
The resulting graph will be a horizontal line at the distance value where the car is parked, indicating that the distance does not change over time.
---
- The horizontal axis (x-axis) will represent time (in seconds).
- The vertical axis (y-axis) will represent distance (in meters).
- Since the car is stationary, the distance remains constant over time. This means that for any point in time, the distance value will be the same.
- Start by plotting a point on the distance axis at the distance where the car is parked (let's say 10 meters).
- From this point, draw a horizontal line parallel to the time axis (x-axis). This line indicates that no matter how much time passes, the distance remains at 10 meters.
- Label the horizontal axis as "Time (seconds)" and the vertical axis as "Distance (meters)".
- You can also label the line with a note that says "Car Parked".
The resulting graph will be a horizontal line at the distance value where the car is parked, indicating that the distance does not change over time.
Topper's Solved these Questions
- MOTION AND TIMEBOOK - LAKHMIR SINGH & MANJIT KAURCHAPTER - MOTION AND TIMEEXERCISE - EXERCISE
108 Videos
- LIGHTBOOK - LAKHMIR SINGH & MANJIT KAURCHAPTER - LIGHTEXERCISE - EXERCISEE
130 Videos
- WINDS, STORMS AND CYCLONESBOOK - LAKHMIR SINGH & MANJIT KAURCHAPTER - WINDS, STORMS AND CYCLONESEXERCISE - EXERCISE
92 Videos
Similar Questions
Knowledge Check
A car parked on a road side from sometime, starts moving with a constant speed. Which of the following distance-time graph shows the motion of that car ?
A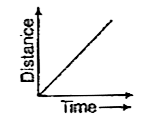 B
B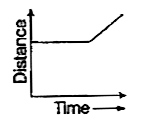 C
C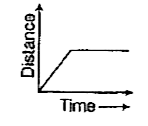 D
D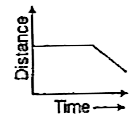
A car parked on a road side from sometimes , starts moving with a constant speed . Which of the following distance- time graph shows the motion of that car ?
A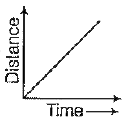 B
B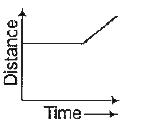 C
C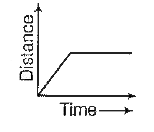 D
D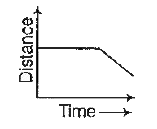
The angle of depression of a car parked on the road from the top of the 150 m high tower is 30∘.Find the distance of the car from the tower
View SolutionFigure shows the distance-time graph for the motion of two vehicles A and B. Which one of them is moving faster?
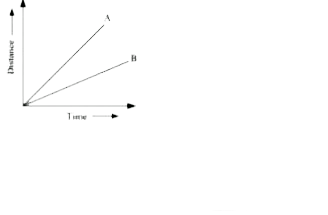
Distance-time graph for the motion of two cars
View SolutionState any two advantages of drawing distance-time graphs for moving objects.
View SolutionWhat conclusion can you draw about the speed of a body from the following distance-time graph ?
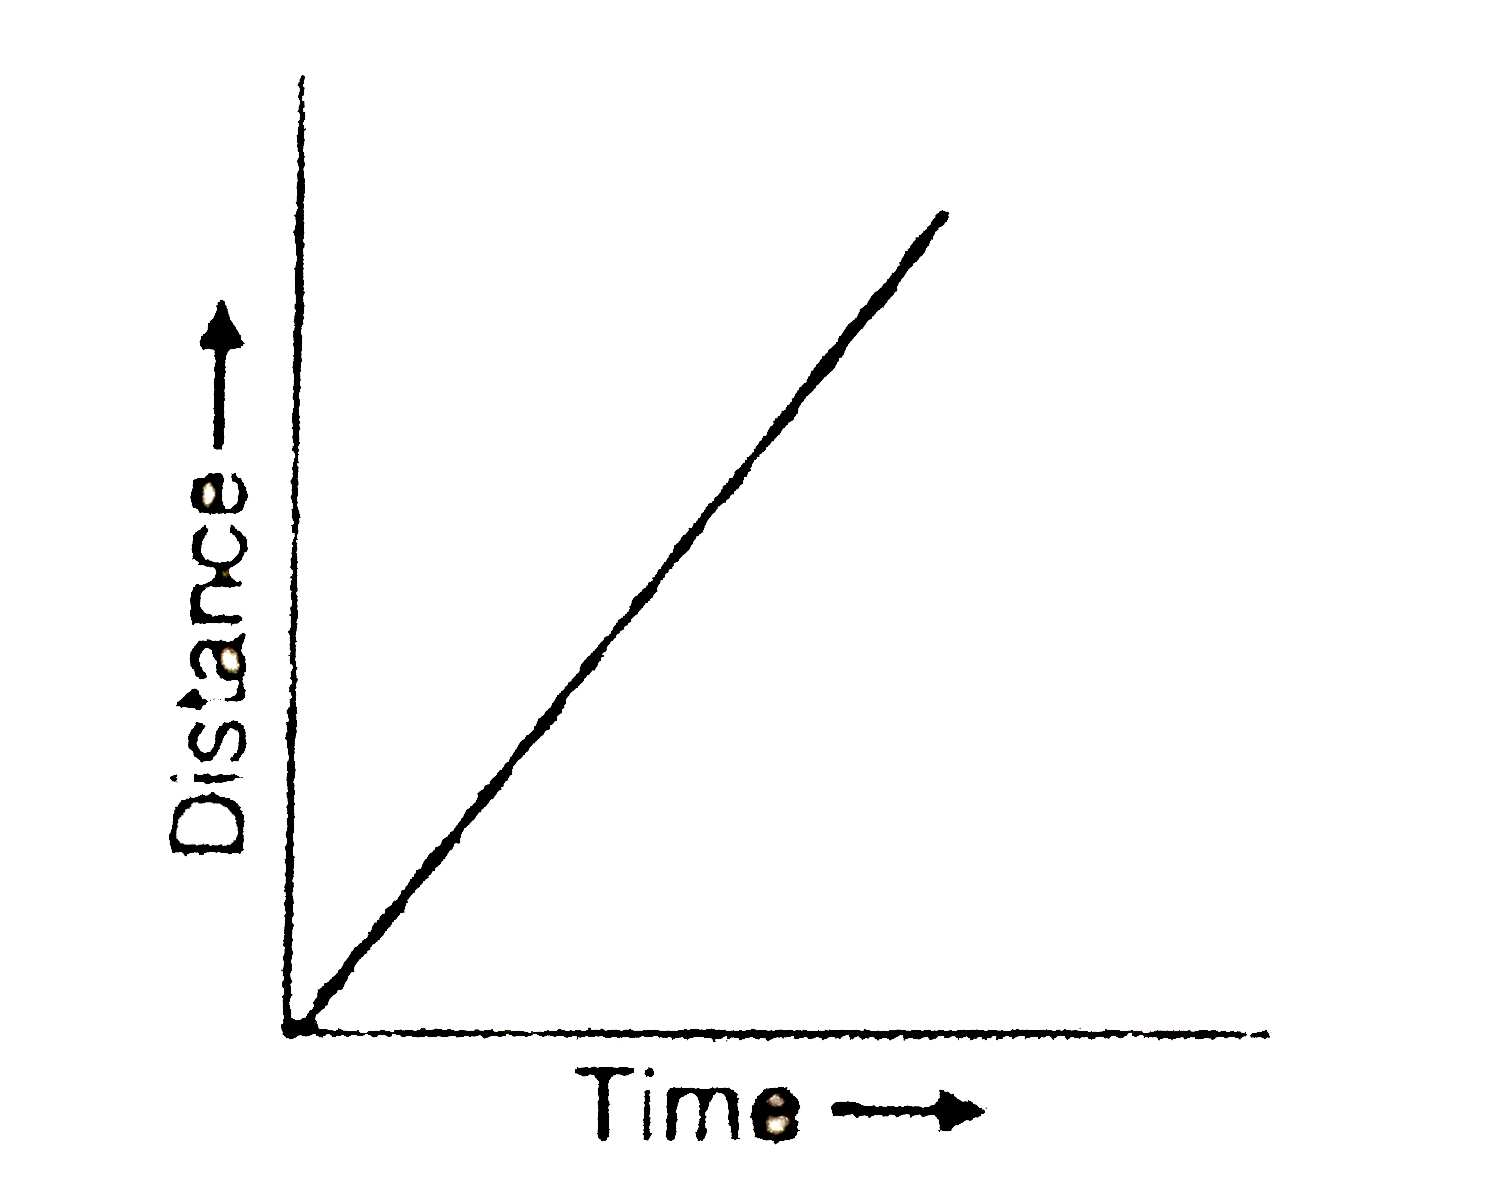
View SolutionShow the shape of the distance-time graph for the motion in the following cases:
A car moving with a constant speed.
View SolutionThe distance travelled by a body in different time intervals is tabulated as follows . Draw the distance time graphs.

View Solution

