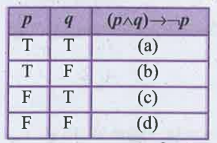
 (p∧q)→¬p -ன் மெய்மை அட்டவணைக்கு பின்வருபவைகளில் எது சரி?
T T T T
F T T T
F F T T
T T T F
Step by step video & image solution for (pwedgeq)rarrnotp -ன் மெய்மை அட்டவணைக்கு பின்வருபவைகளில் எது சரி? by Maths experts to help you in doubts & scoring excellent marks in Class 12 exams.
Updated on:21/07/2023Topper's Solved these Questions
Similar Questions
பின்வரும் இயற்பியல் கூற்றுகள் ஒவ்வொன்றையும், வகைக்கெழுச் சமன்பாடாக எழுதுக. (i) ரேடியம் சிதைவுறும் வீதமானது காணப்படும் அளவு Q-க்கு நேர்விகிதத்தில் இருக்கும். (ii) ஒரு நகரத்தின் மக்கள் தொகை P ஆனது, மக்கள் தொகை மற்றும் 5,00,000-க்கும் மக்கள் தொகைக்கும் உள்ள வேறுபாடு ஆகியவற்றை பெருக்கிக் கிடைக்கும் மதிப்புக்கு நேர்விகிதத்தில் அதிகரிக்கிறது. (iii) ஒரு பொருளின் வெப்பநிலை Tஐப் பொருத்து ஆவி அழுத்தம் P-ன் மாறுவீதமானது, ஆவி அழுத்தத்திற்கு நேர்விகிதத்திலும், வெப்பநிலையின் வர்க்கத்திற்கு எதிர்விகிதத்திலும் உள்ளது.(iv) ஒரு சேமிப்பு தொகைக்கு ஒரு வருடத்திற்கு 8% வட்டித் தொகையானது தொடர்ச்சியாக அசலுடன் சேர்க்கப்படுகிறது. மேலும், மற்றொரு முதலீட்டிலிருந்து ஒவ்வொரு ஆண்டும் கிடைக்கும் வரவு ₹400 இத்தொகையுடன் தொடர்ச்சியாக சேர்க்கப்படுகிறது.
View Solution{1.1, 1.2, 1.3, 1.4, 1.5} எனும் பிரிவினையுடன் இடது-முனை விதியைப் பயன்படுத்தி ∫1.51xdx-க்கு தோராய மதிப்பு காண்க.
View SolutionHow many lines of symmetry does the above figure have ?
View SolutionWhich of the following are correct chain isomers of butane ? (i)
View SolutionDetermine the point of symmetry of a regular hexagon.
View SolutionDtermine the images of the following figure about the given line :
View SolutionMatch the following Column A to Column B

View SolutionMatch the following Column A to Column B

View SolutionMatch the following Column A to Column B

View SolutionFind the area of the figure given below.

View SolutionThe area of the shaded part in the figure given below is ______.

View SolutionThe inequation represented by the graph given below is :
View SolutionThe inequation that best describes the graph given below is _________
View SolutionThe inequation that best describes the following graph is _________
View SolutionWhich inequations represent the shaded region in the given figure
View SolutionIn Fig, find the value of x.
ltimg src="https://d10lpgp6xz60nq.cloudfront.net/physics_images/PS_MATH_IX_C12_S01_032_Q01.png" width="80%"gt
View Solution
