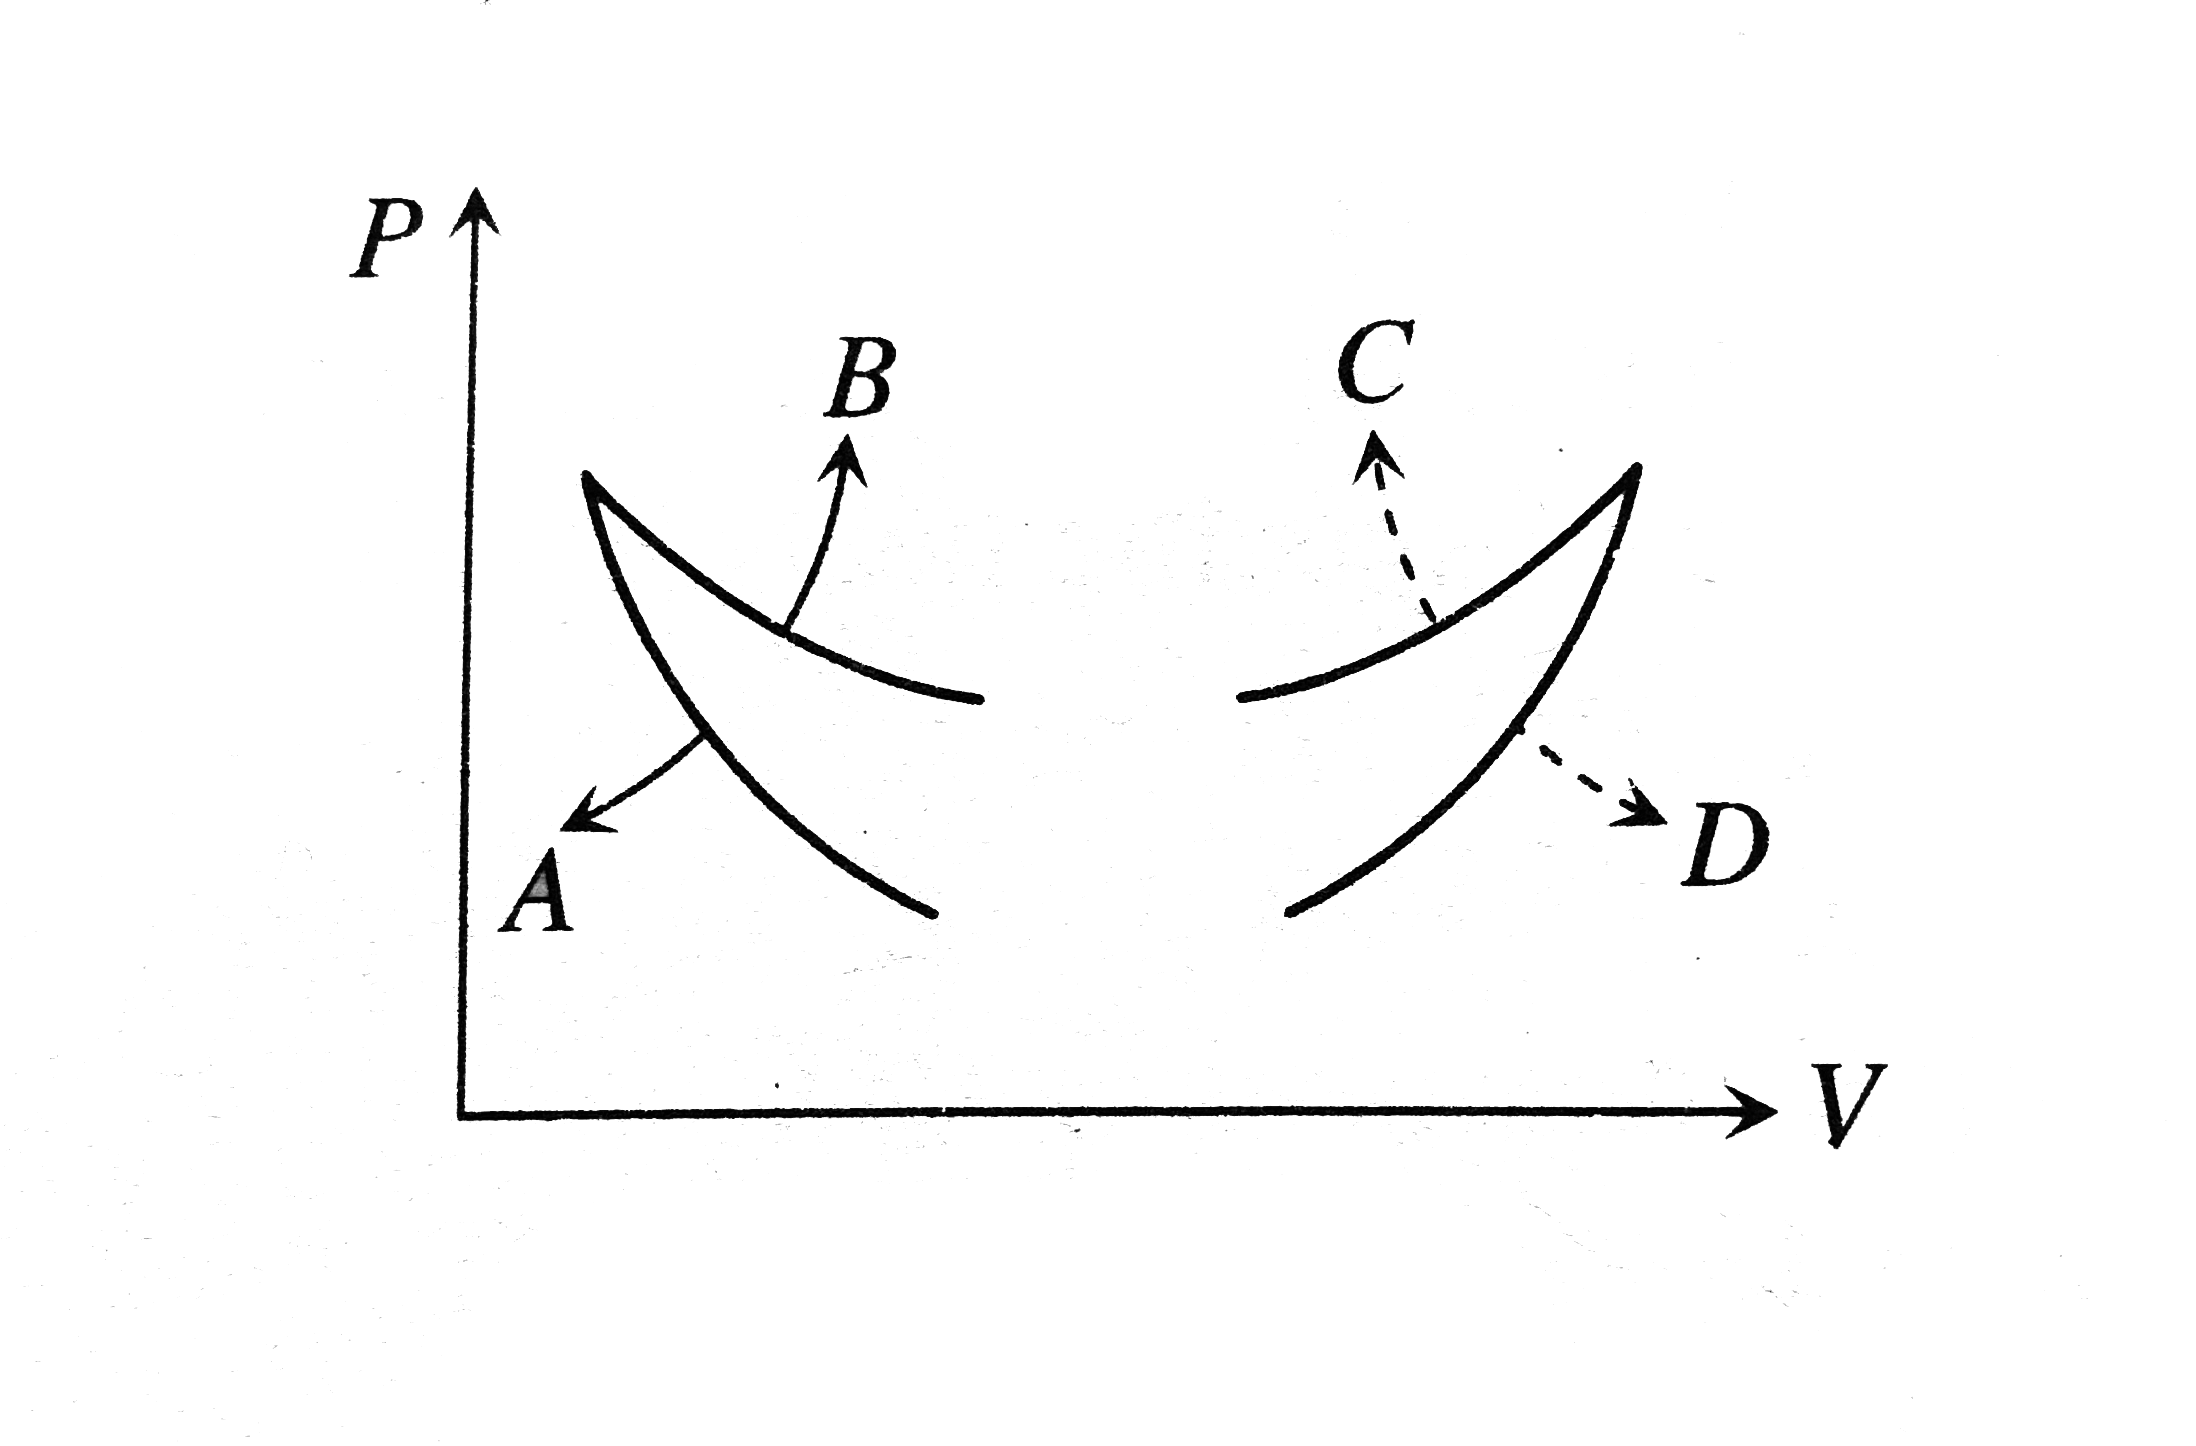
Four curves A, B, C and D are drawn in the figure for a given amount of a gas. The curves which represent adiabatic and isothermal changes are:

C and D respectively
D and C respectively
A and B respectively
B and A respectively
The correct Answer is:C
Curve A,B shows expansion. For expansion of a gas,
Wisothermal>Wadiabatic
Pisothermal>Padiabatic
Tisothermal>Tadiabatic
⇒ Slope of curve for isothermal change < slope of curve tor adiabatic change. So, curve B shows isothermal change and curve A shows adiabatic change.
Topper's Solved these Questions
- THERMODYNAMICS BOOK - DISHA PUBLICATIONCHAPTER - THERMODYNAMICS EXERCISE - EXERCISE-1 : CONCEPT BUILDER (Topic-3 CARNOT ENGINE, REFIGERATOR AND SECOND LAW OF THERMODYNAMICS)
15 Videos
- THERMODYNAMICS BOOK - DISHA PUBLICATIONCHAPTER - THERMODYNAMICS EXERCISE - EXERCISE -2 : CONCEPT APPLICATOR
29 Videos
- THERMODYNAMICS BOOK - DISHA PUBLICATIONCHAPTER - THERMODYNAMICS EXERCISE - EXERCISE-1 : CONCEPT BUILDER (Topic- ZEROTH LOW AND FIRST LAW OF THERMODYNAMICS)
11 Videos
- THERMAL PROPERTIES OF MATTER BOOK - DISHA PUBLICATIONCHAPTER - THERMAL PROPERTIES OF MATTER EXERCISE - Exercise-2 (Concept Applicator)
28 Videos
- WAVE OPTICSBOOK - DISHA PUBLICATIONCHAPTER - WAVE OPTICSEXERCISE - EXERCISE-2 : CONCEPT APPLICATOR
30 Videos
Similar Questions
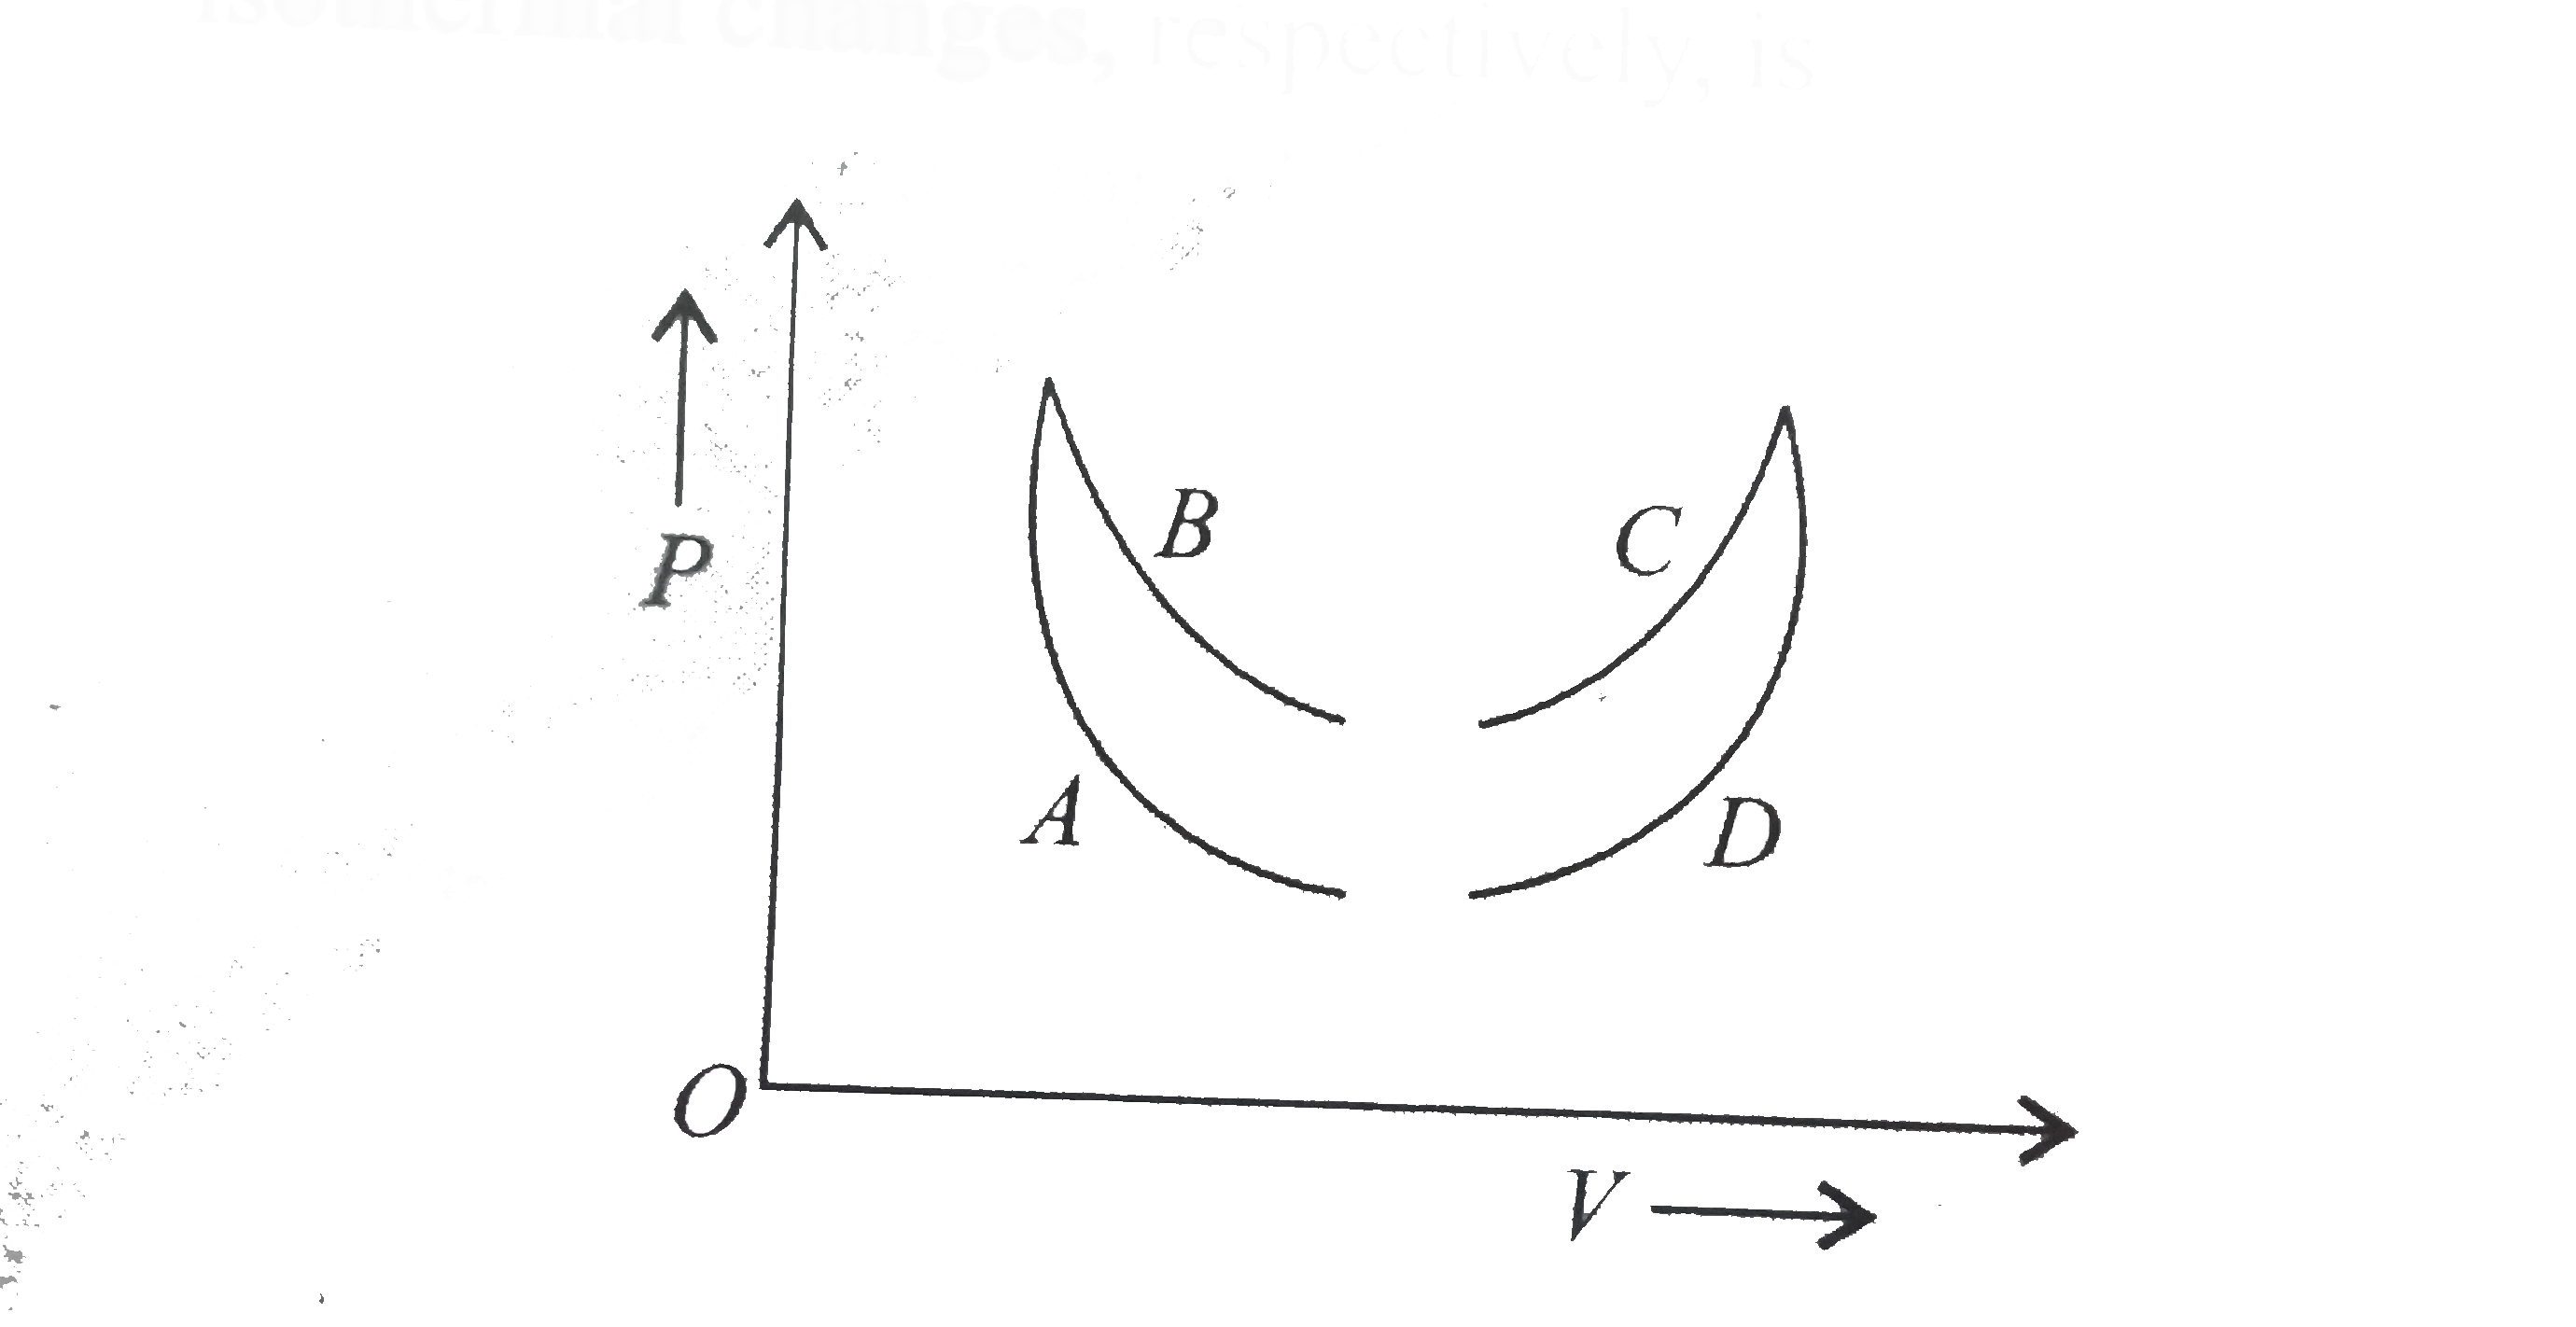
Four curves A,B,C and D are drawn in Fig. for a given amount of gas. The curves which represent adiabatic and isothermal changes
View SolutionFour curves A,B,C and D are drawn in figure for a given amount of gas. The curve which represents adiabatic and isothermal changes, respectively, is
View Solution
Knowledge Check
Four curves A,B,C and D are drawn in Fig. for a given amount of gas. The curves which represent adiabatic and isothermal changes
 AC and D respectivelyBD and C respectivelyCA and B respectivelyDB and A respectively
Four curves A,B,C and D are drawn in Fig. for a given amount of gas. The curves which represent adabatic and isothermal changes
 AC and D, respectivelyBD andC, respectivelyCA and B, respectivelyDB and A, respectively
In the given graph, adiabatic and isothermal curves are shown. Then,
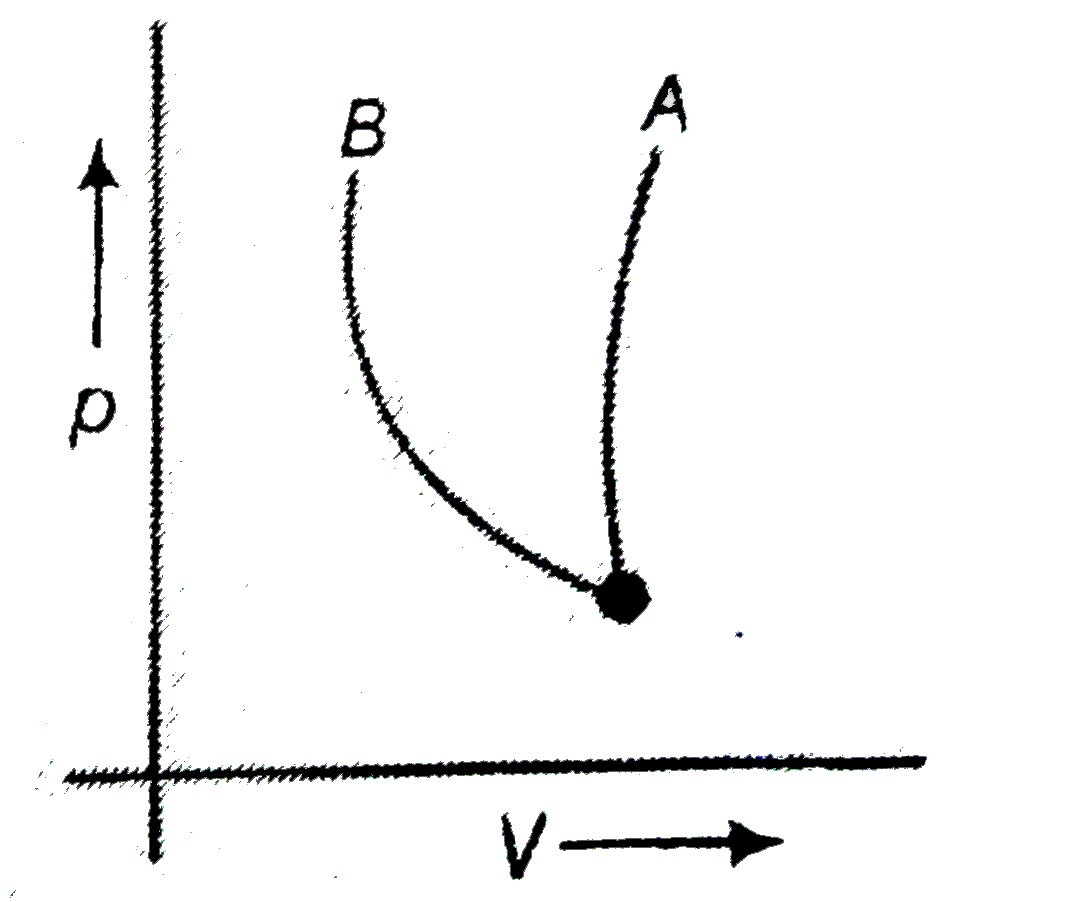 Athe curve A is isothermalBthe curve B is isothermalCthe curve A is adiabaticDthe curve B is adiabatic
Four curves A,B,C and D are drawn in Fig. for a given amount of gas. The curves which represent adabatic and isothermal changes

View SolutionFigure shows four PV diagrams. Which of these curves represent isothermal and adiabatic processes?
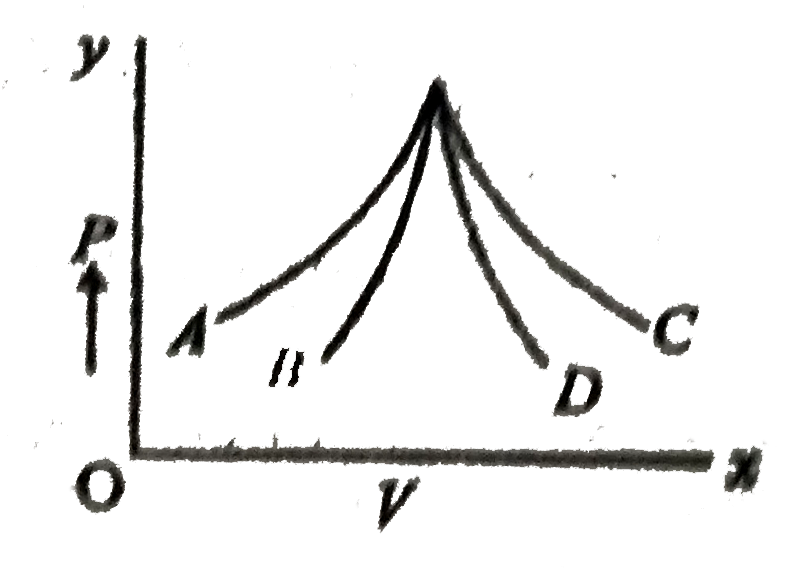
View SolutionThe ratio of slopes of adiabatic and isothermal curves is
View SolutionWhich of the following P-V curve best represents. As isothermal process?
View SolutionIn the following figure, four curves A,B, C and D are shown. The curves are
View Solution
