The graph shown in figure represents

motion of a simple pendulum starting from mean position
motion of a simple pendulum starting from extreme position
simple pendulum describing a horizontal circle
None of these
The correct Answer is:A
At disoplacement ± a, the velocity is zero. At zero displacement, velocity is maximum.
Topper's Solved these Questions
- BOOK - DISHA PUBLICATIONCHAPTER - OSCILLATIONS EXERCISE - Exercise-1 : Concept Builder (TOPIC 3: Damped & Forced Oscillations and Resonance)11videos
OSCILLATIONS
- BOOK - DISHA PUBLICATIONCHAPTER - OSCILLATIONS EXERCISE - Exercise-2 : Concept Applicator28videos
OSCILLATIONS
- BOOK - DISHA PUBLICATIONCHAPTER - OSCILLATIONS EXERCISE - Exercise-1 : Concept Builder (TOPIC 1: Displacement, Phase, Velocity, Acceleration and Energy in S.H.M.)27videos
OSCILLATIONS
- BOOK - DISHA PUBLICATIONCHAPTER - NUCLEIEXERCISE - EXERCISE - 2 (CONCEPT APPLICATOR)30videos
NUCLEI
- BOOK - DISHA PUBLICATIONCHAPTER - PHYSICAL WORLD, UNITS AND MEASUREMENTSEXERCISE - Exercise - 2 : Concept Applicator30videos
PHYSICAL WORLD, UNITS AND MEASUREMENTS
Similar Questions
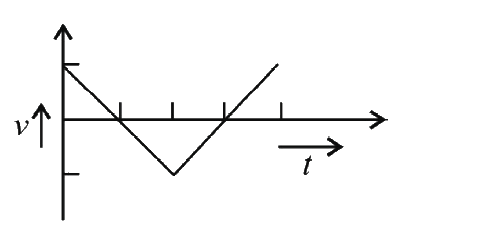
The graph in figure shows the velocity v versus time t for a body. Which of the graphs shown in figure represents the correesponding acceleration versus time graphs ?
 View Solution
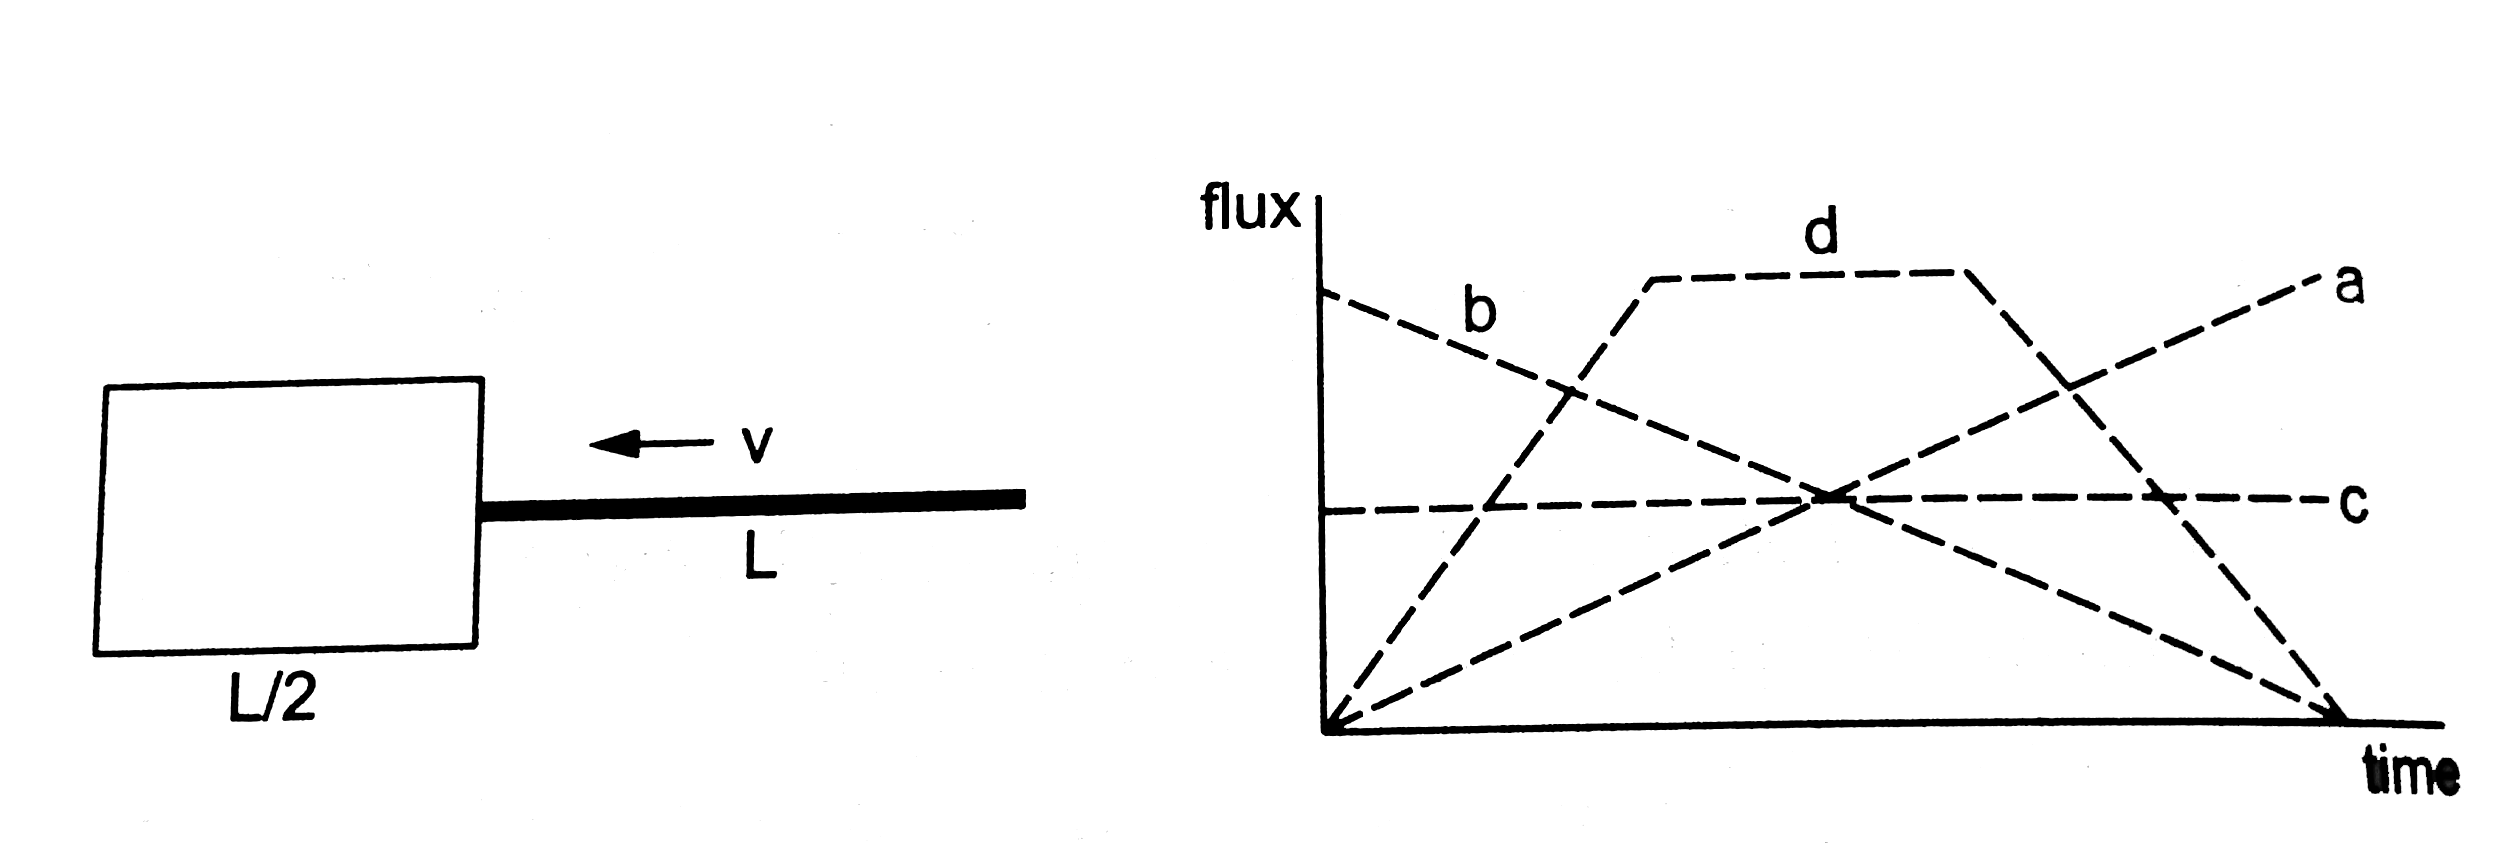
Figure shown an imaginary cube of edge L/2. A uniformly Charged rod of length L moves towards left at a small but constant speed v. At t=0, the left end just touches the centre of the cube opposite it. Which of the graphs shown in figure represents the flux of the electic field through the cube as the rod goes through it?
 View Solution
Knowledge Check
- Question 1 - Select One
The graph in figure shows the velocity v versus time t for a body. Which of the graphs shown in figure represents the corresponding acceleration versus time graphs ?
 A
A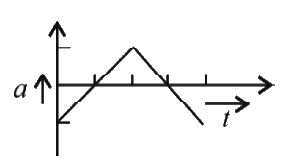 B
B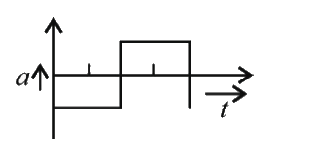 C
C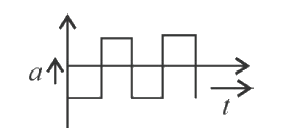 D
D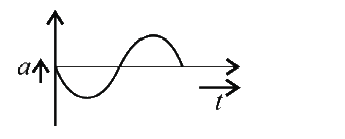
- Question 2 - Select One
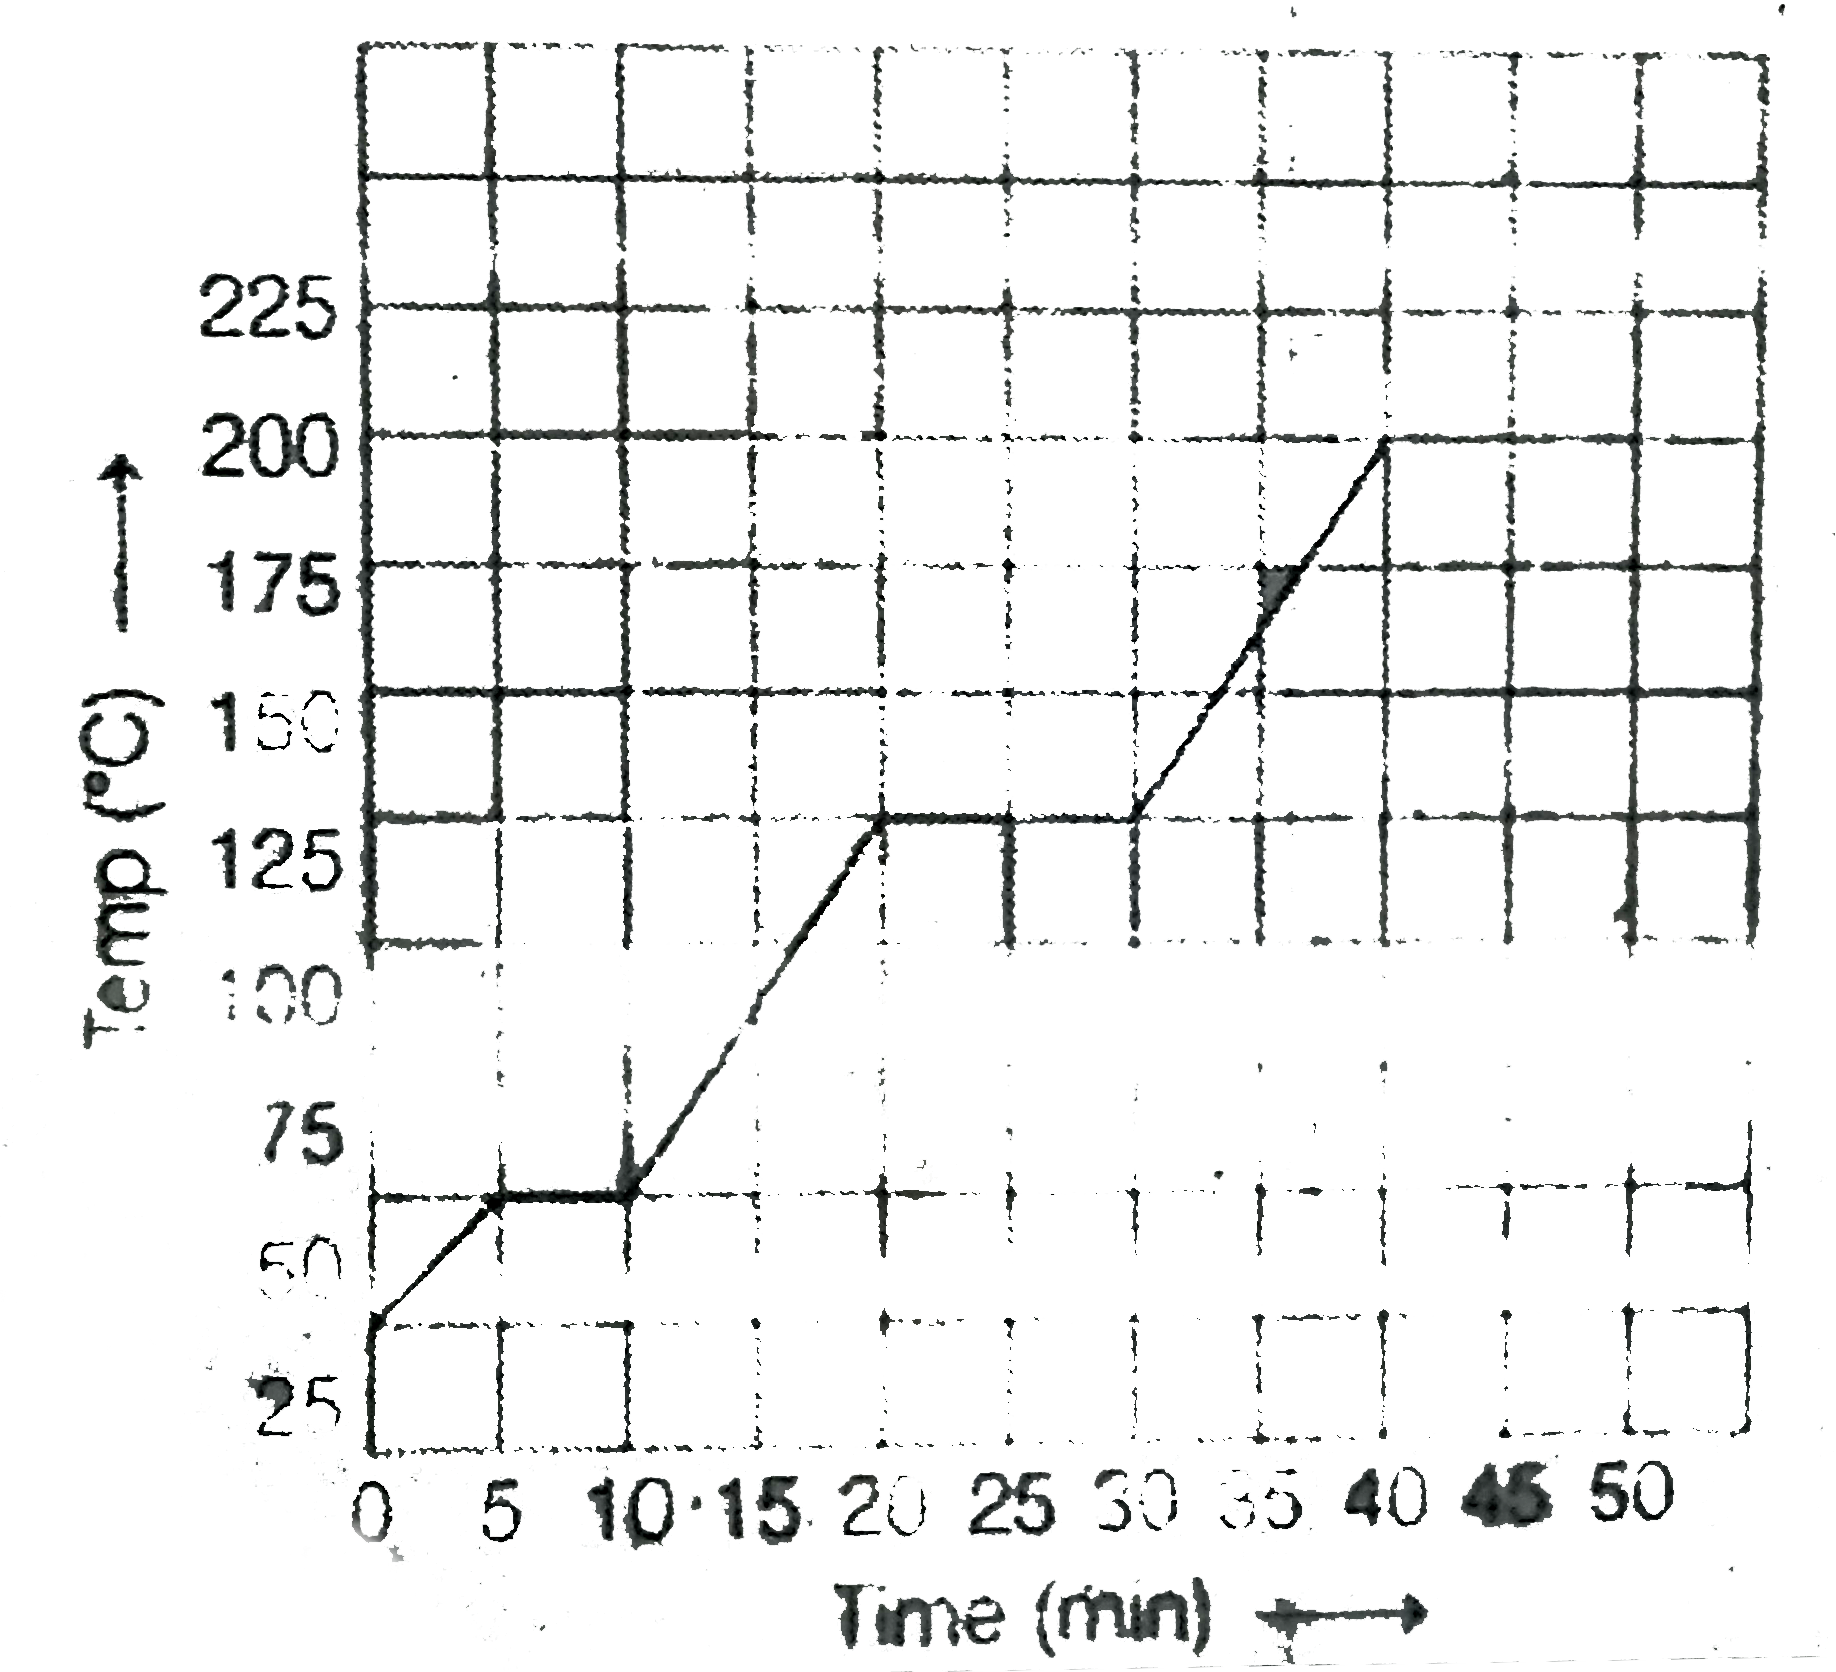
The graph shown in the figure represents change in the temperature of 5 kg of a substance as it absorbs heat at a costant rate of 42 kJ min−1. The latent heat of vaporization of the substance is :
 A96kJ kg−1B126kJ kg−1C84kJ kg−1D12.6kJkg−1
Figure shown an imaginary cube of edge L/2. A uniformly Charged rod of length L moves towards left at a small but constant speed v. At t=0, the left end just touches the centre of the cube opposite it. Which of the graphs shown in figure represents the flux of the electic field through the cube as the rod goes through it?
 View Solution
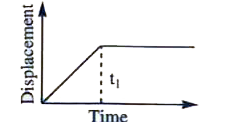
The x-t graph shown in figure represents
 View Solution
The x-t graph shown in figure represents.
 View Solution
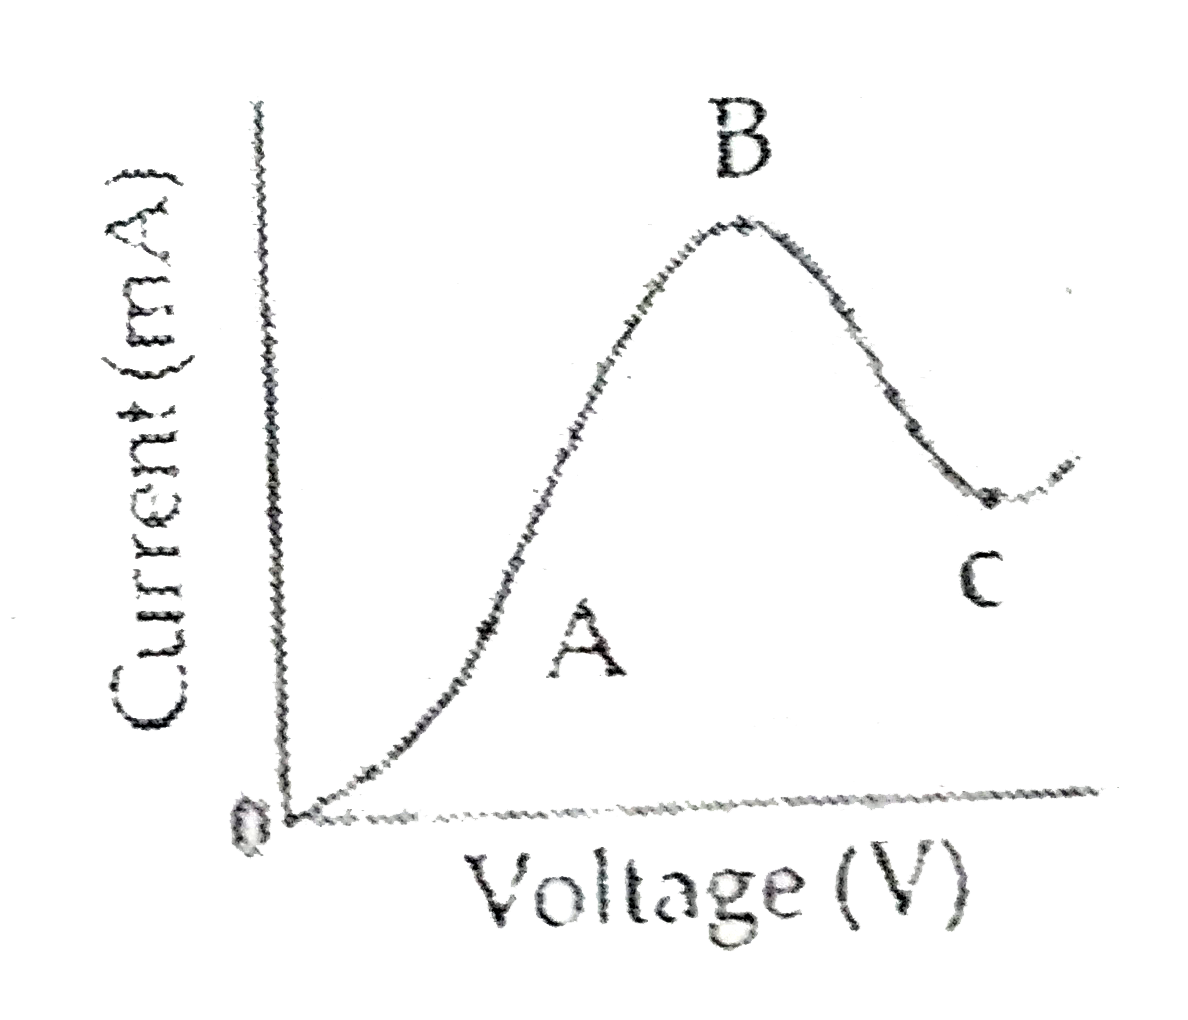
The graph shown in the figure represents a plot of current versus voltage for a given semi-conductor. Identify the region, if any, over which the semicondutor has a negative resistance.
 View Solution
The graph shown in the figure represents change in the temperature of 5 kg of a substance as it absorbs heat at a costant rate of 42 kJ min−1. The latent heat of vaporization of the substance is :
 View Solution
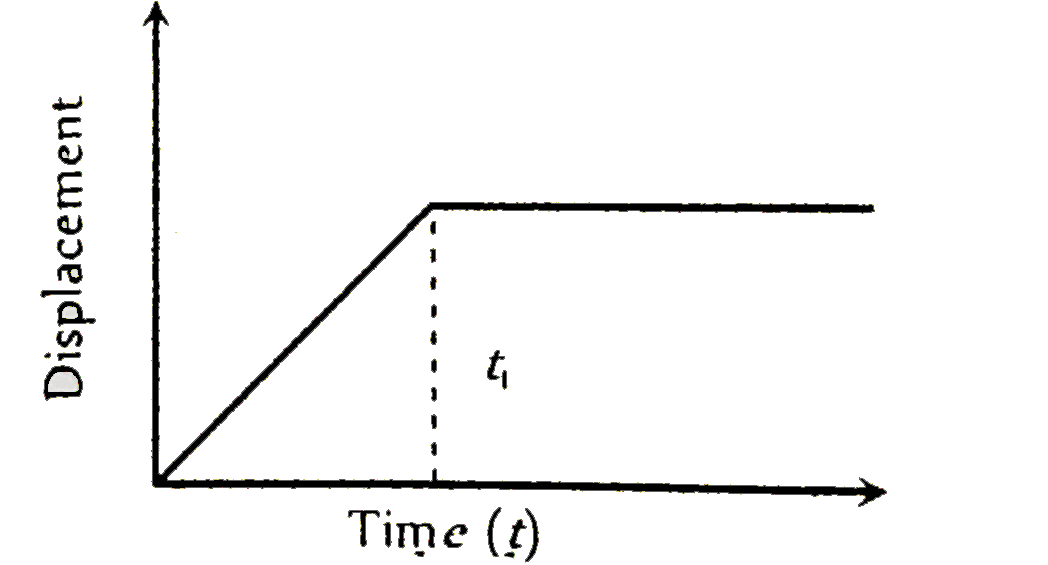
The x -t graph shown in figure represents
 View Solution
