The graph shown in the figure represents a plot of current versus voltage for a given semi-conductor. Identify the region, if any, over which the semicondutor has a negative resistance.
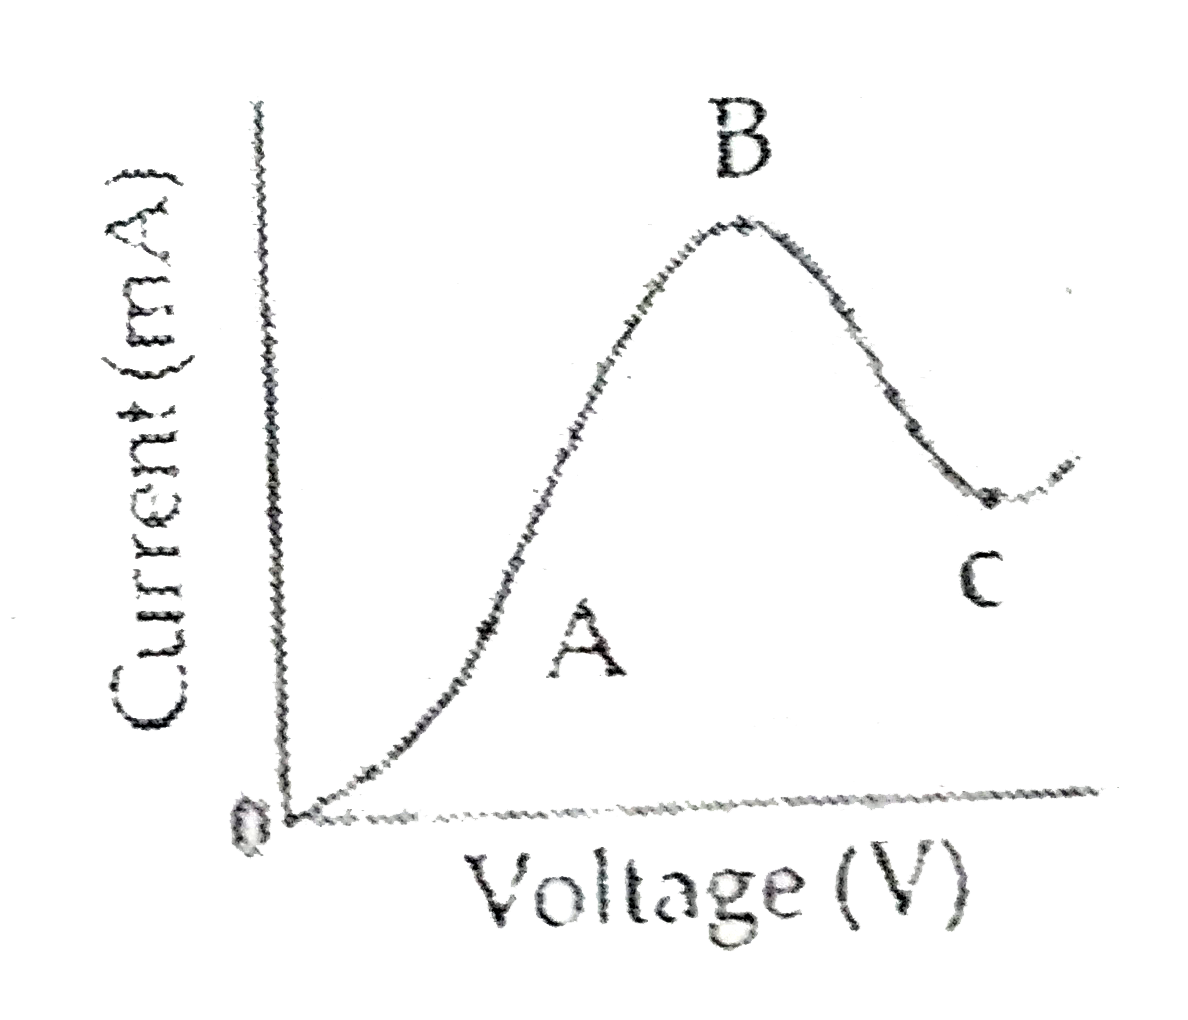
Step by step video & image solution for The graph shown in the figure represents a plot of current versus voltage for a given semi-conductor. Identify the region, if any, over which the semicondutor has a negative resistance. by Physics experts to help you in doubts & scoring excellent marks in Class 12 exams.
Updated on:21/07/2023Similar Questions
In an electric circuit shown alongside, find
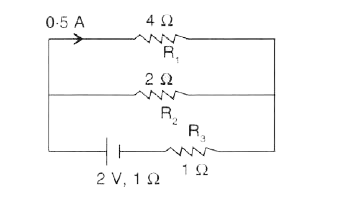
terminal voltage of the battery
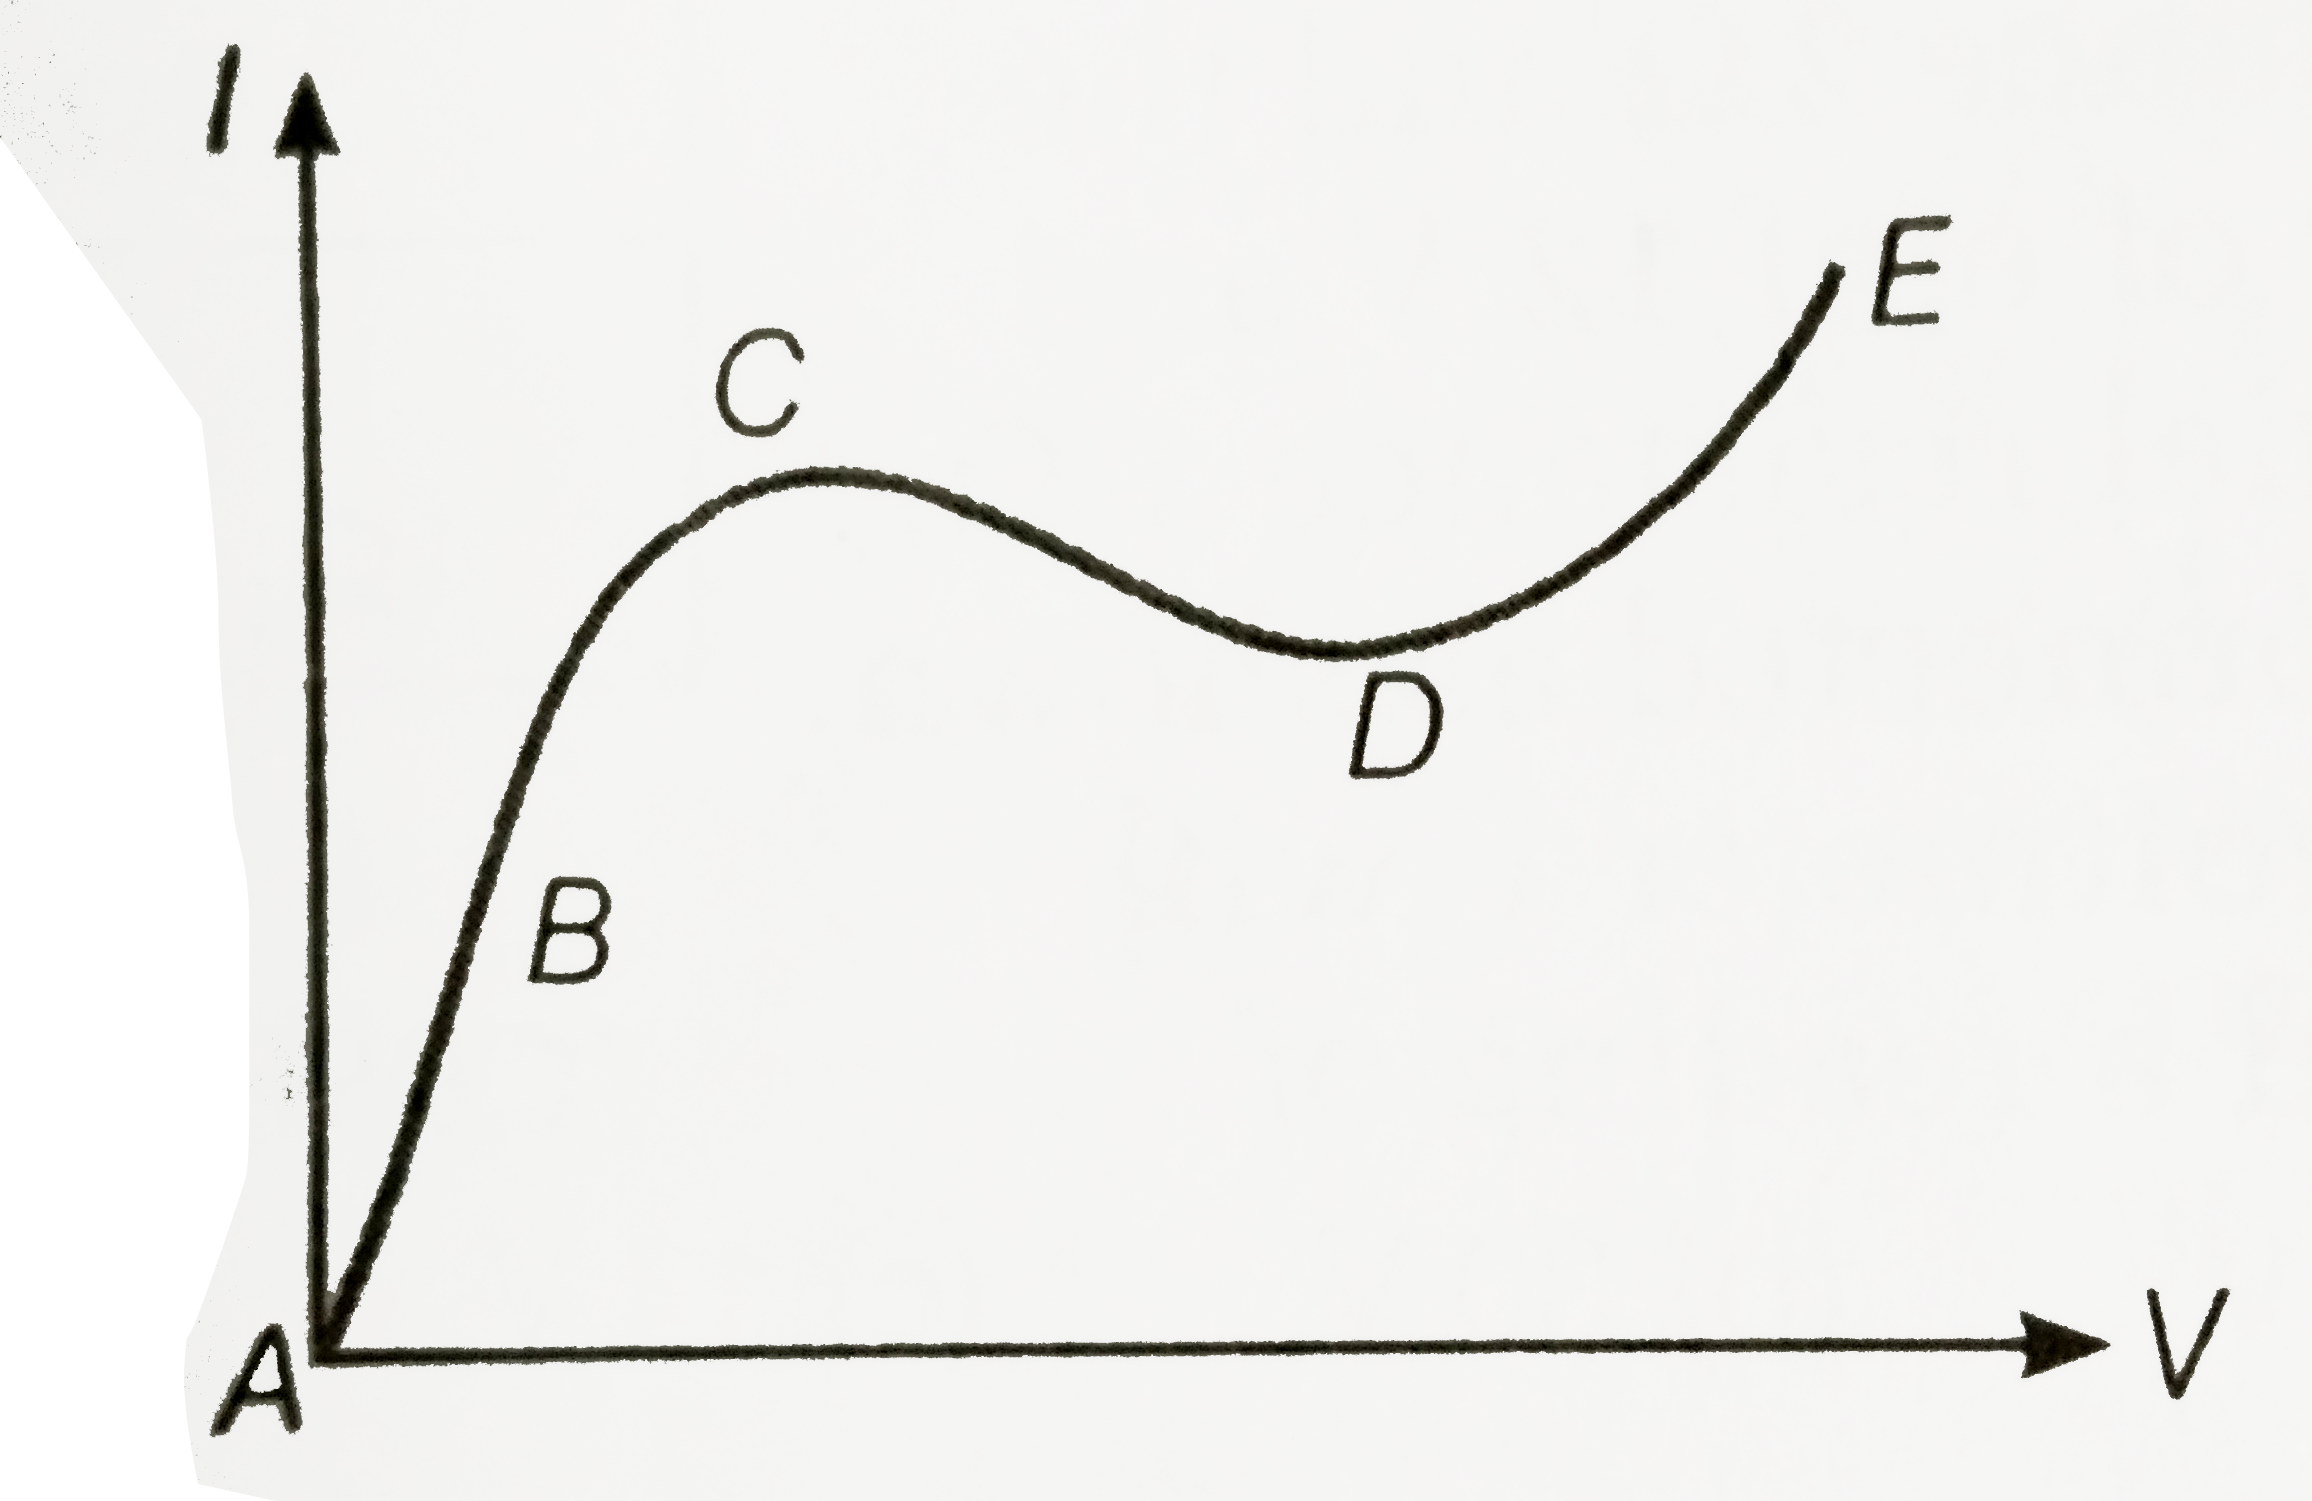
View SolutionFrom the given between current I and voltage V shown in figure , indentify the portion corresponding to negative resistance
View Solution(a) Draw graph showing the variation of current versus voltage in an electroyte when an external resistance is also connceted.
(b) (i) The graph between resistance (R ) and temperature (T) for Hg is shown in the figure (a). Explain the behaviour of Hg near 4k.
(ii) In which region of the graph shown in the figure (b) is the resistance negative and why?

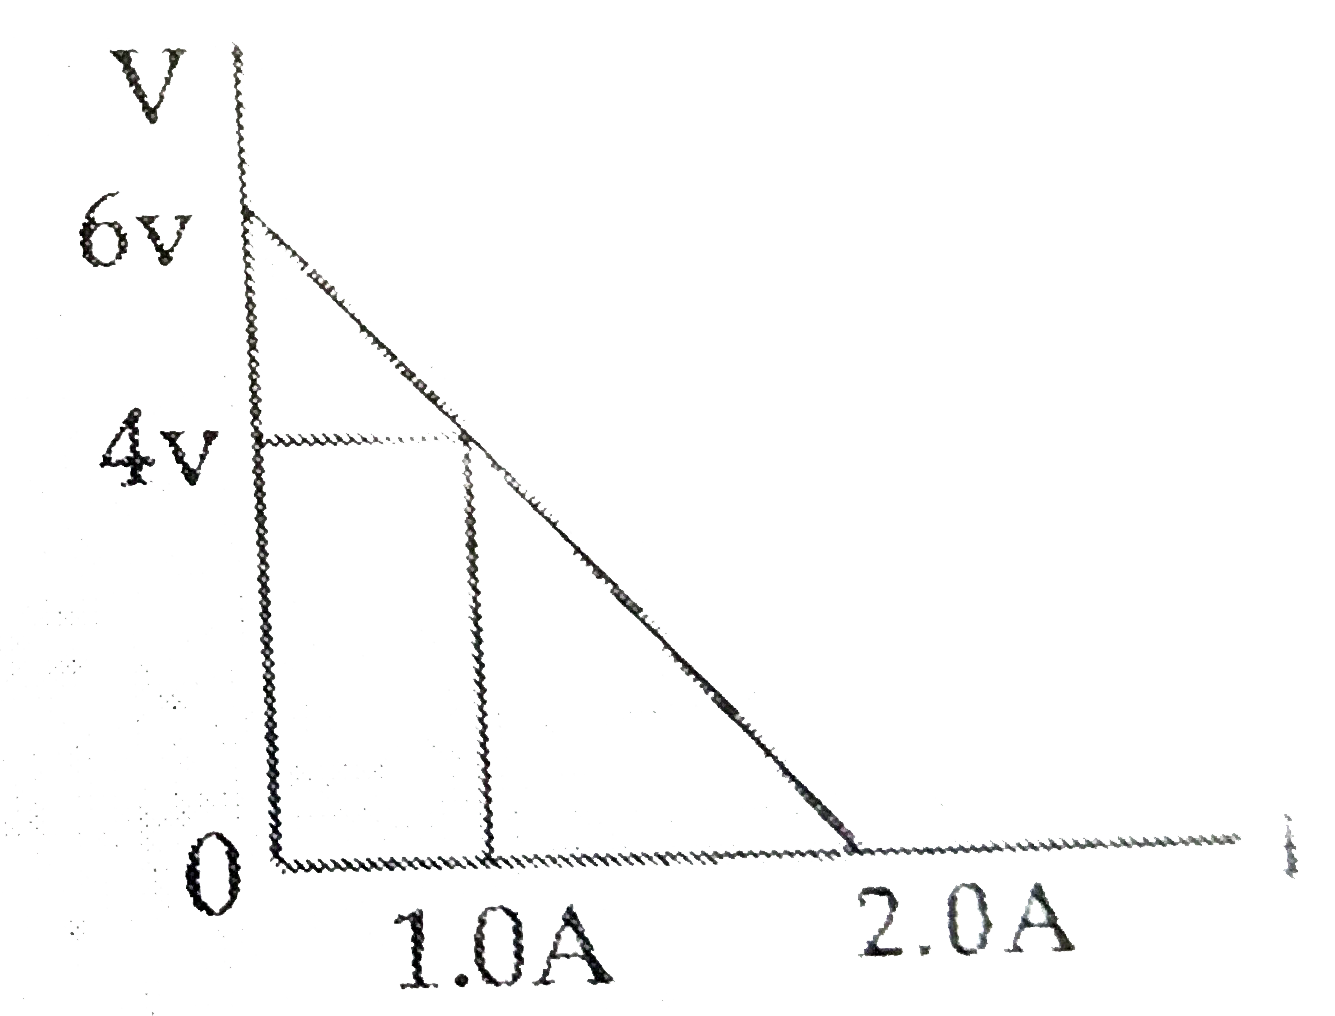
View SolutionThe figure shows a plot of terminal voltage 'V' verus the current 'I' of a given cell. Calculate from the graph (a) emf of the cell and (b) internal resistance of the cell.
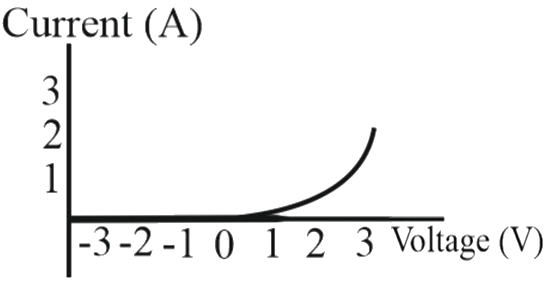
View SolutionShown below is a graph of current versus applied voltage for a diode . Approximately , what is the resistance of the diode for an applied voltage of – 1 V ?
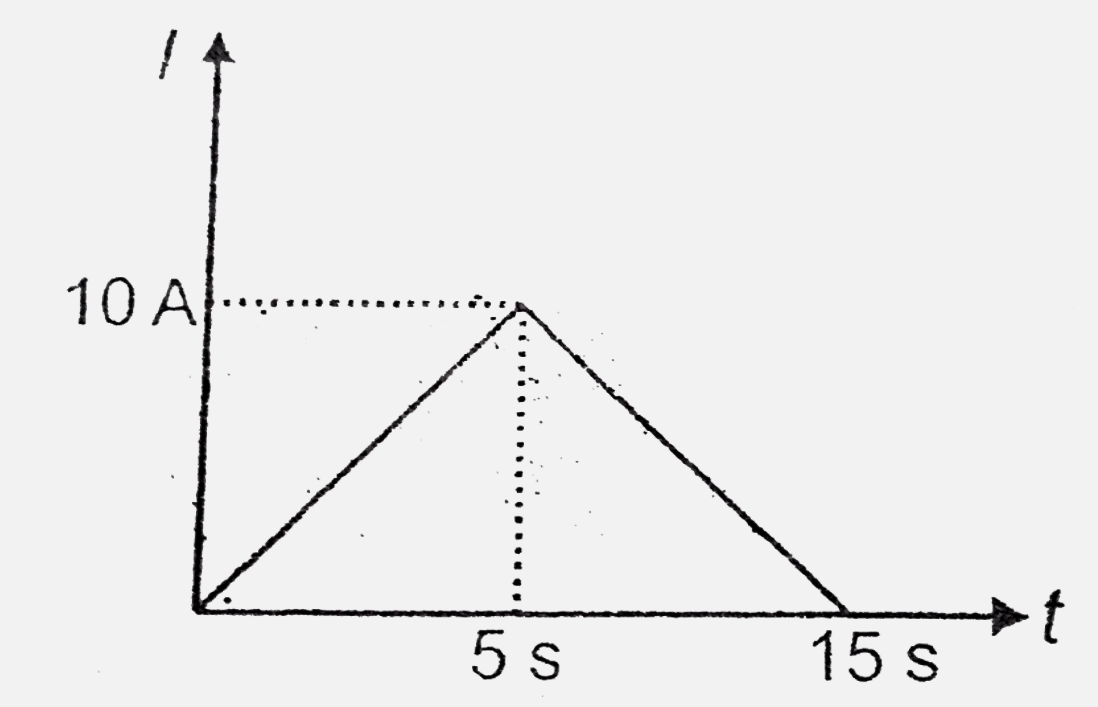
View SolutionCurrent l versus time t graph through a conductor is shown in the figure. Average current through the conductor in the interval 0 to 15 s is
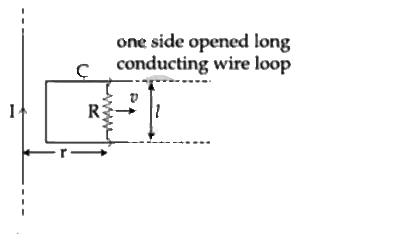
View SolutionAn infinitely long straight wire carrying current I , one side opened rectangular loop and a conductor C with a sliding connector are located in the same plane , as shown in the figure. The connector has length l and resistance R . It slides of the right with a velocity v. The resistance of the conductor and the self inductance of the loop are negligible . The induced current in the loop , as function of separation r between the conductor and the straight wire is :
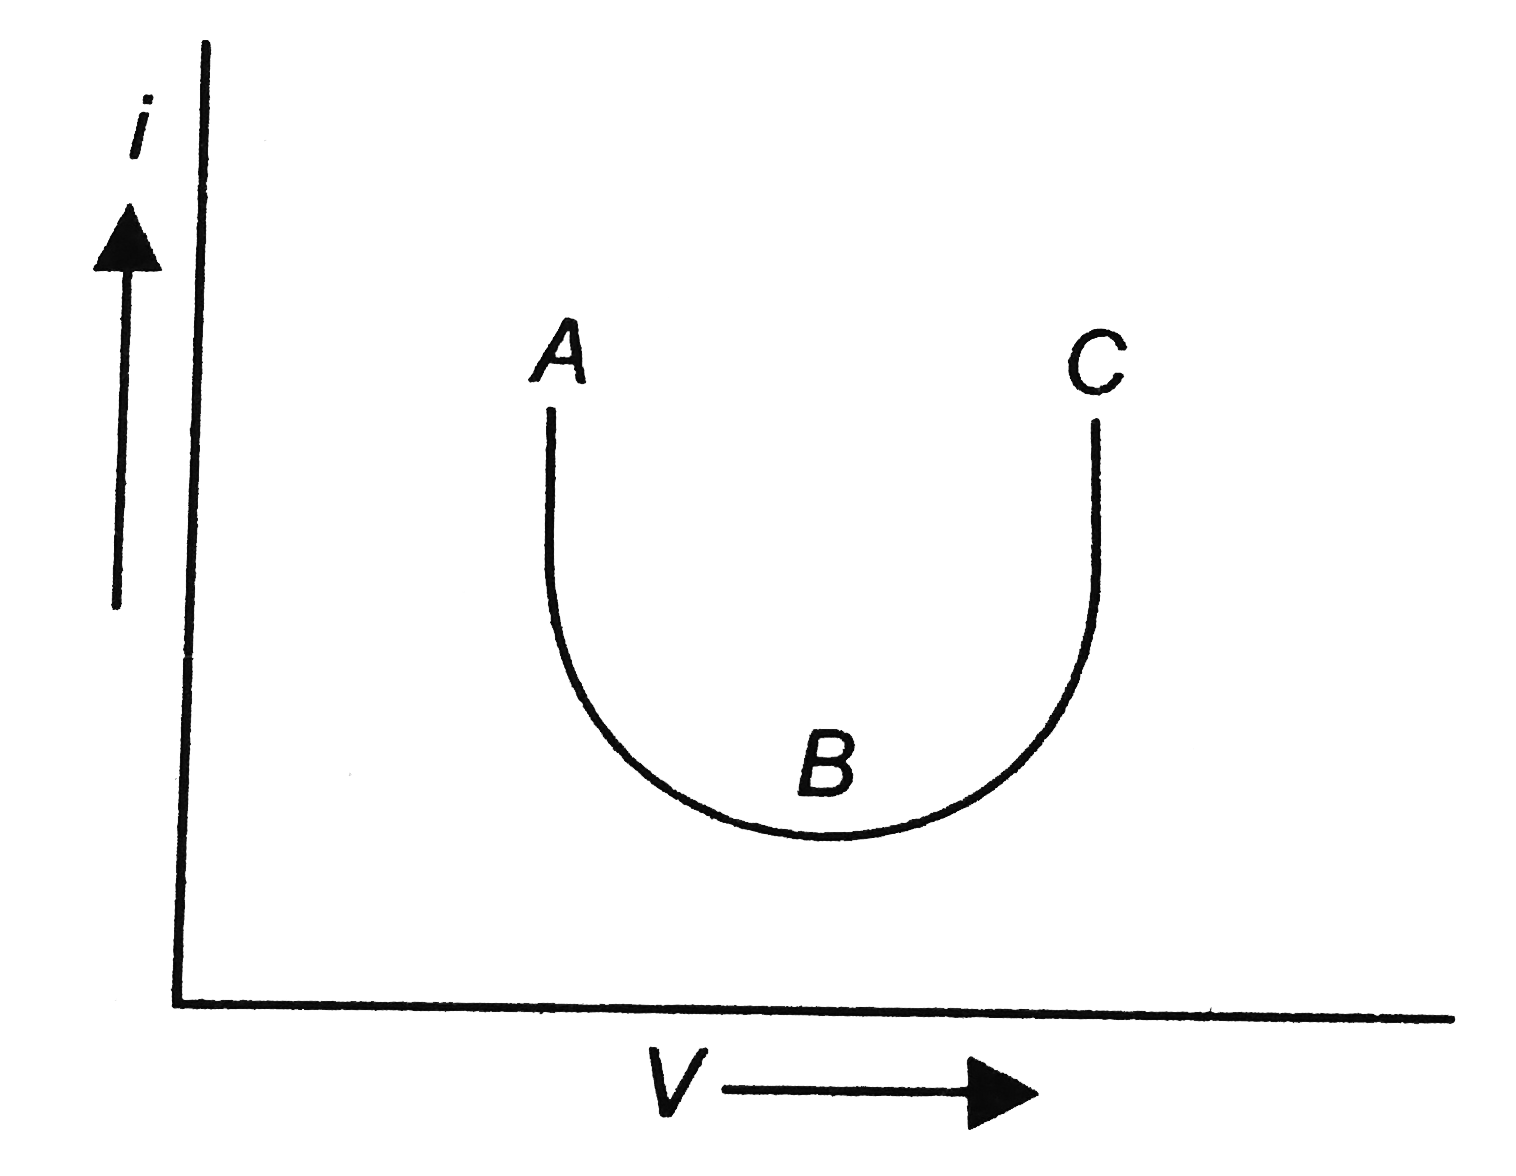
View SolutionThe current-voltage graph of a device is shown in figure. The resistance is negative in region.
View SolutionConsider a box with three terminals on top of it as shown in figure.
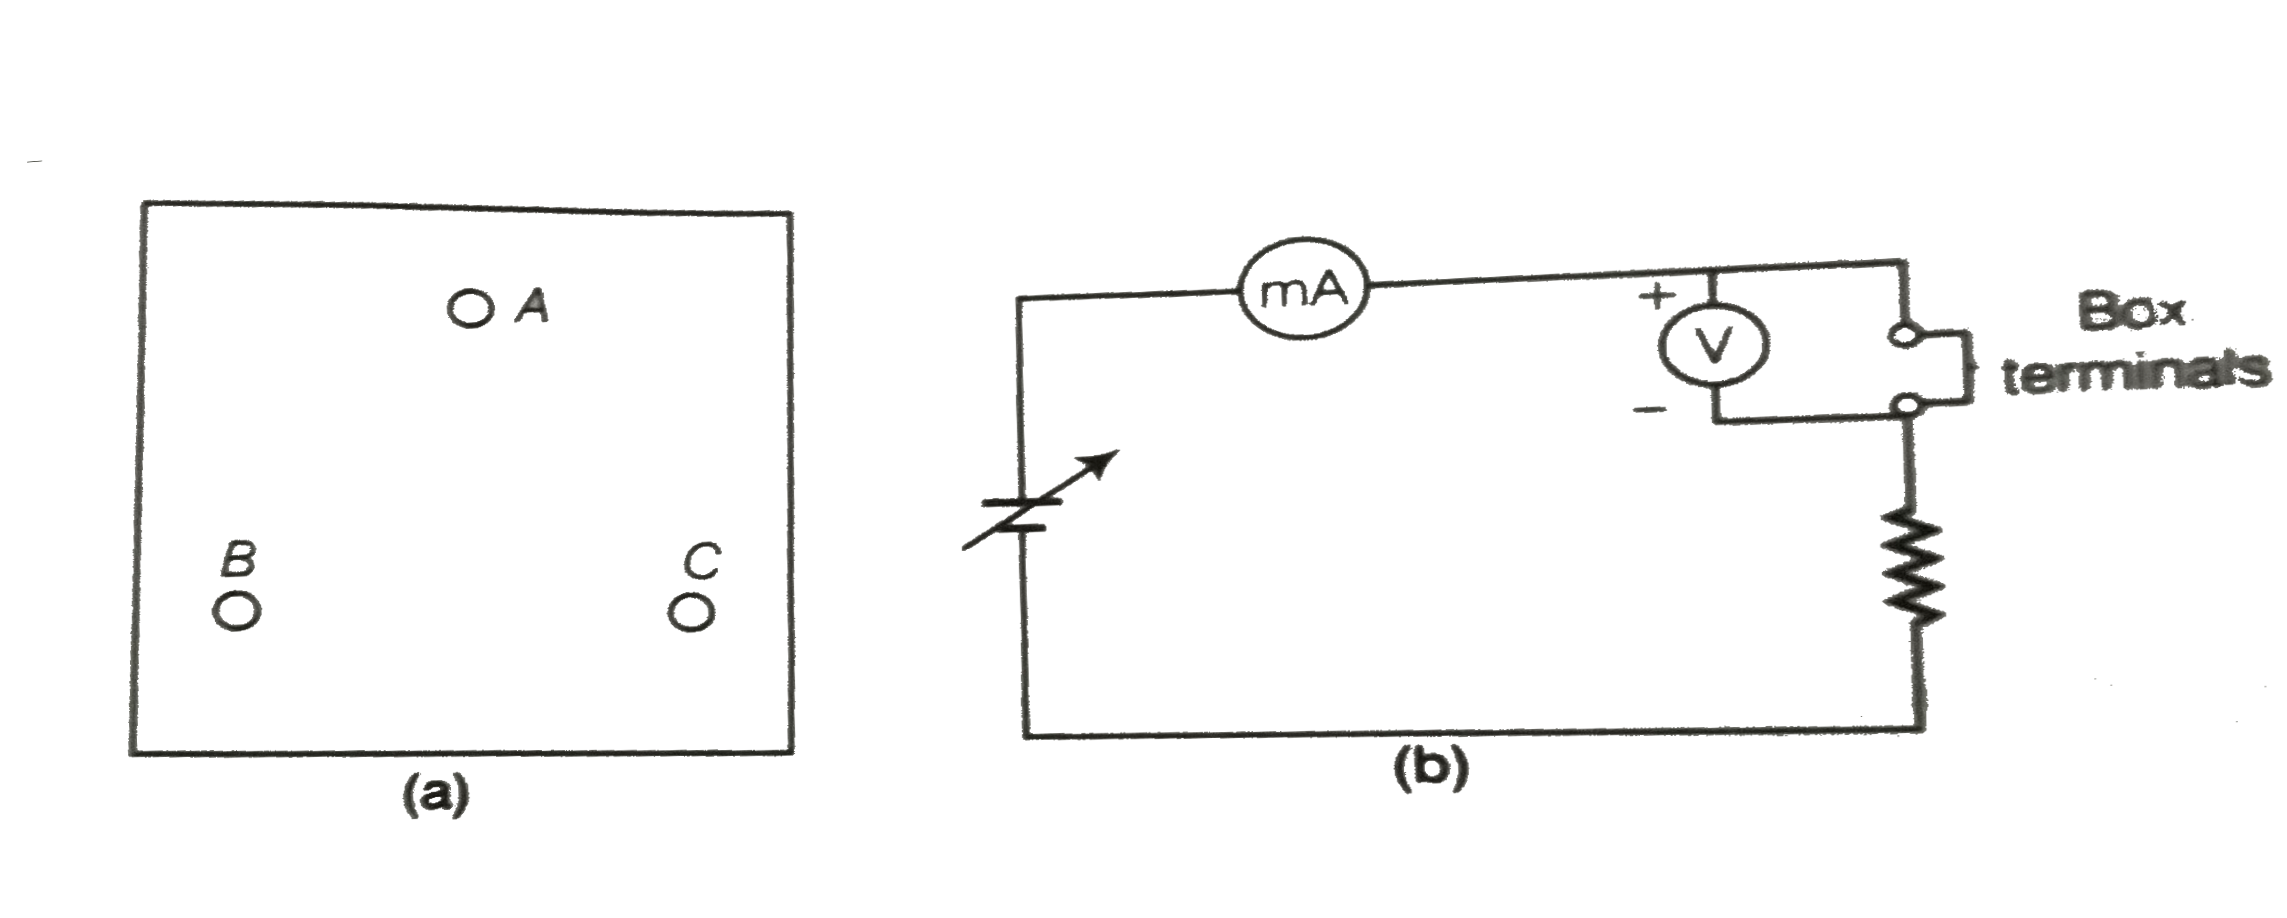
Three components namely, two germanium diodes and one resistor are connected across these three terminals in some arrangement
A student performs an experiment in which any two of these three terminals are connected in the circuit shown in figure.
The student obtains graphs of current-voltage characteristics for unknown combination of components between the two terminals connected in the circuit. The graphs are
(i) When A is positive and B is negative
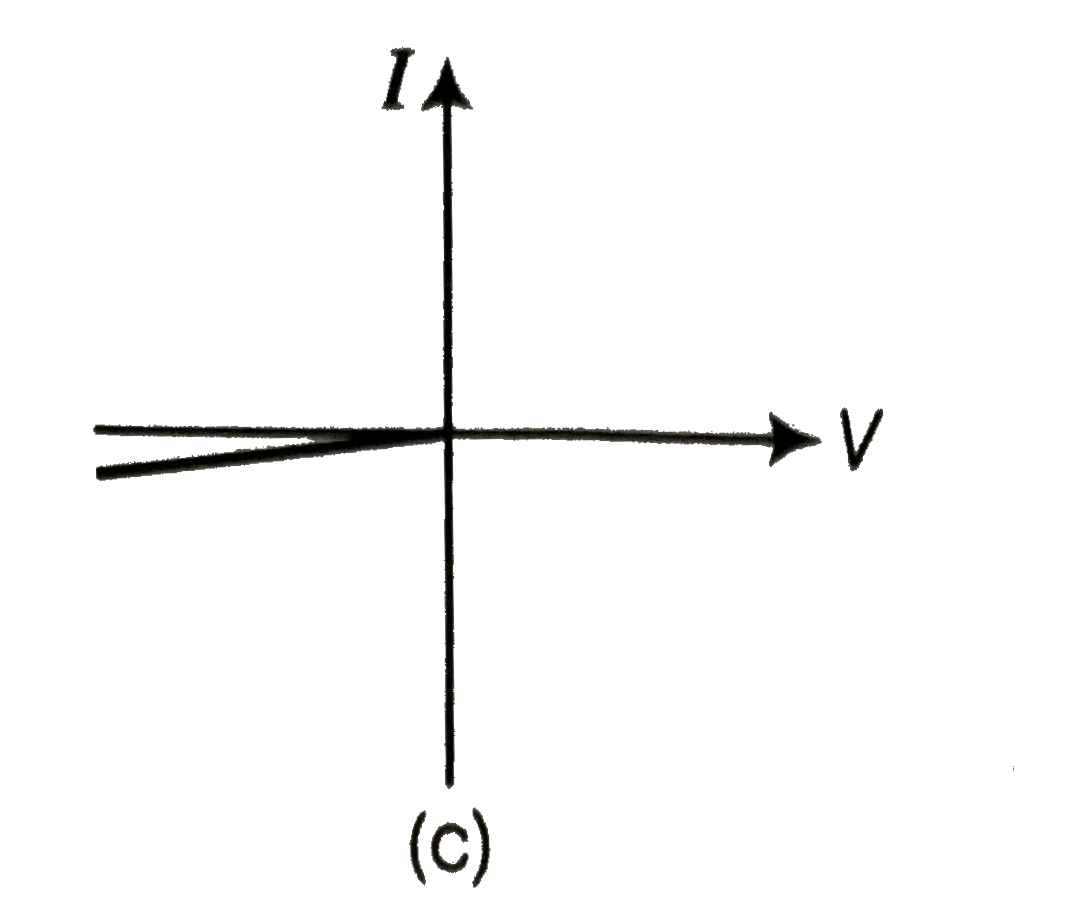
(ii) When A is negative and B is positive
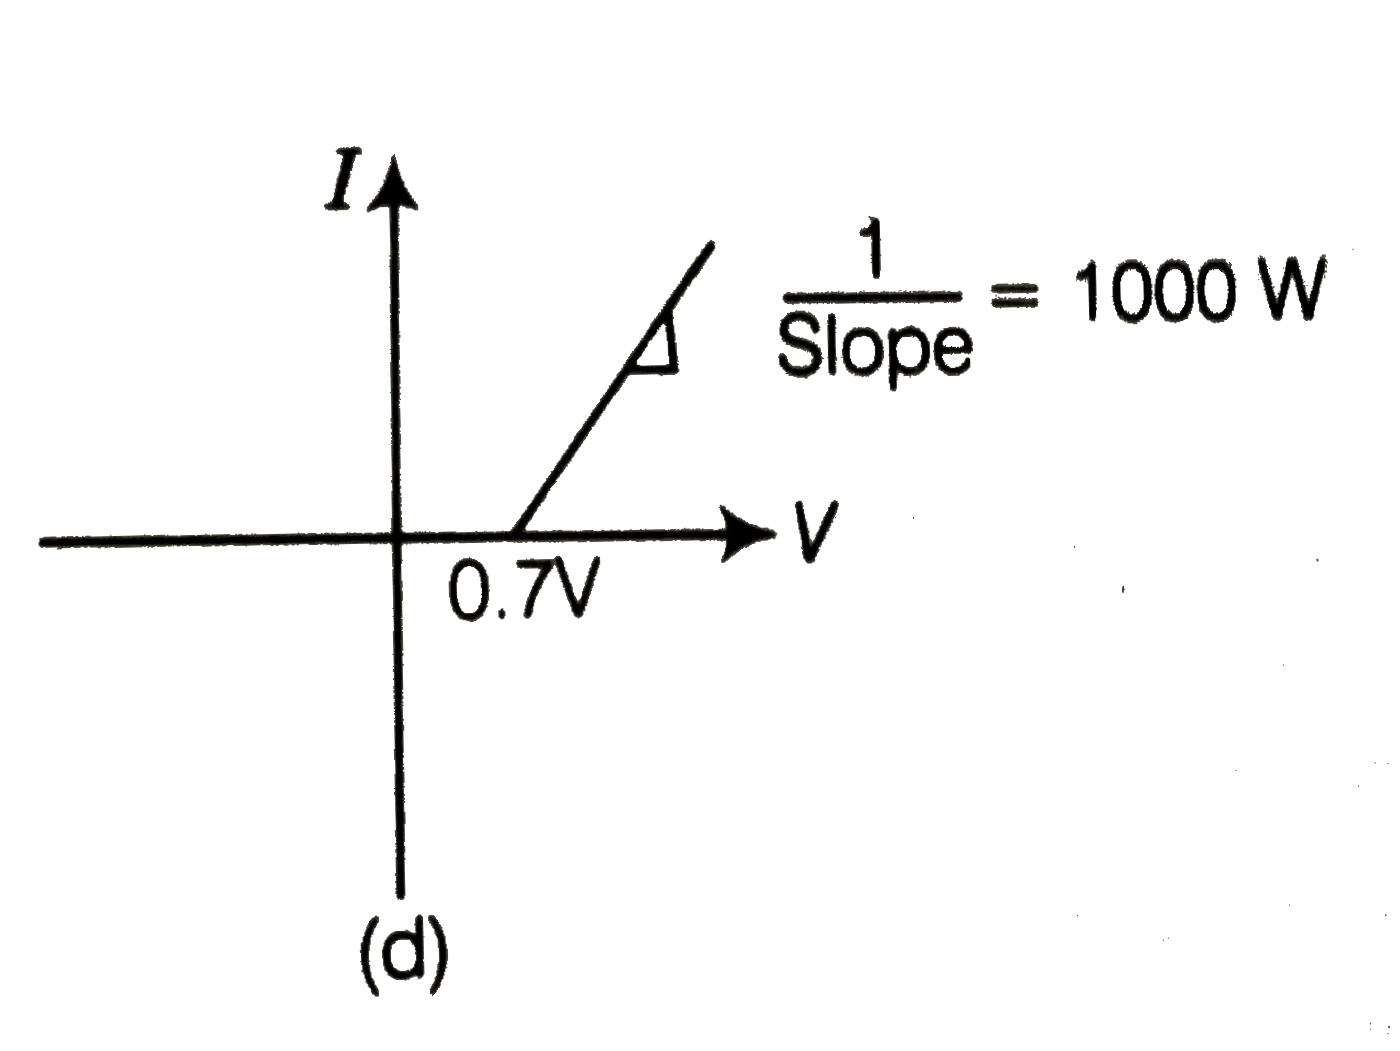
(iii) When B is negative and C is positve
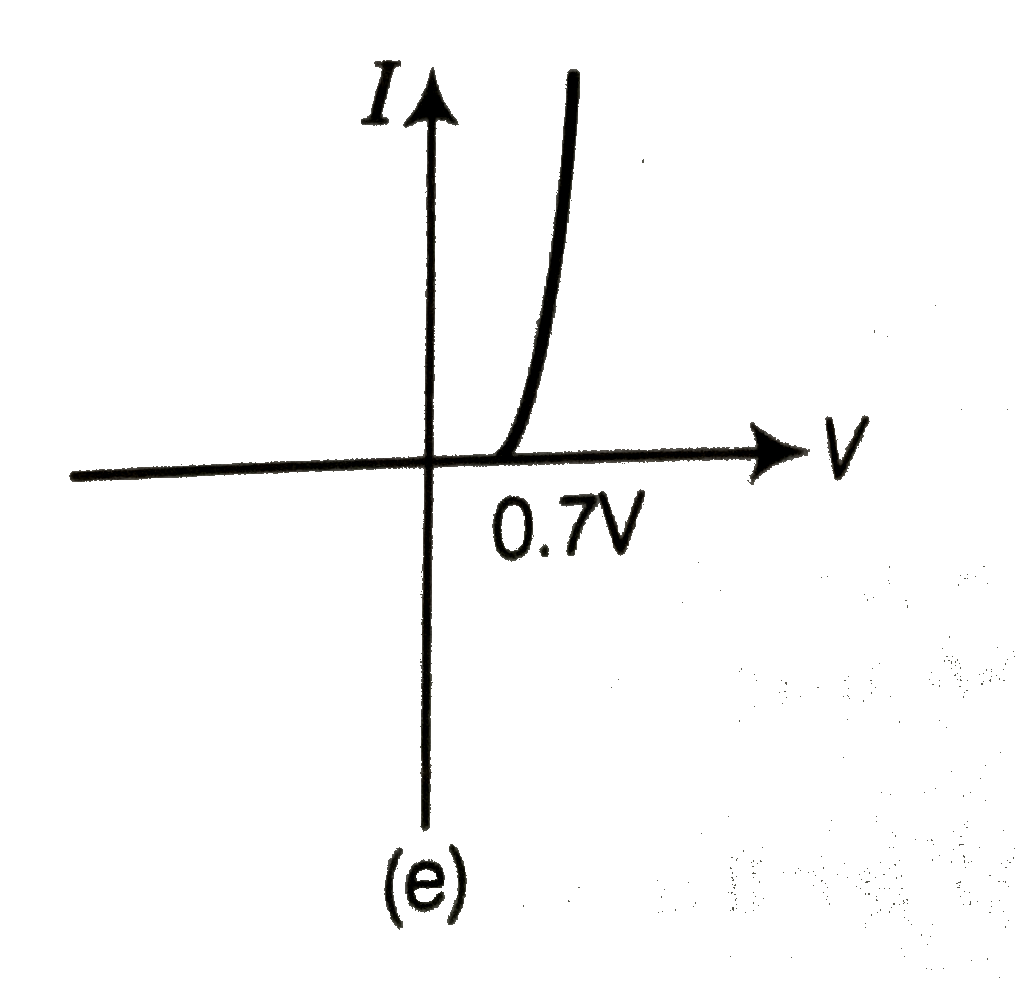
(iv) When B is positive and C is neagtive
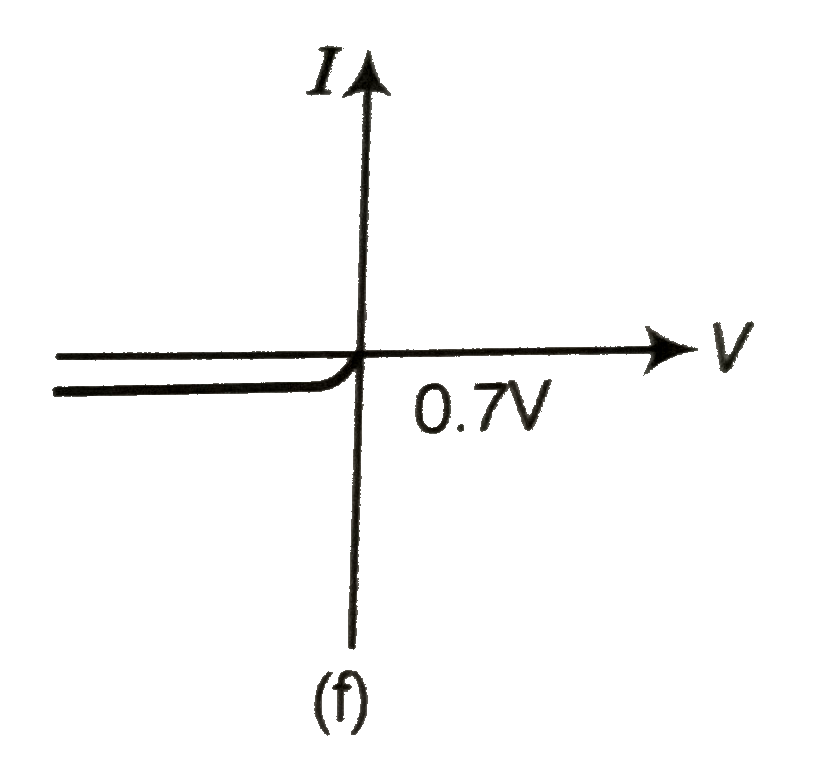
(v) When A is positive and C is negative
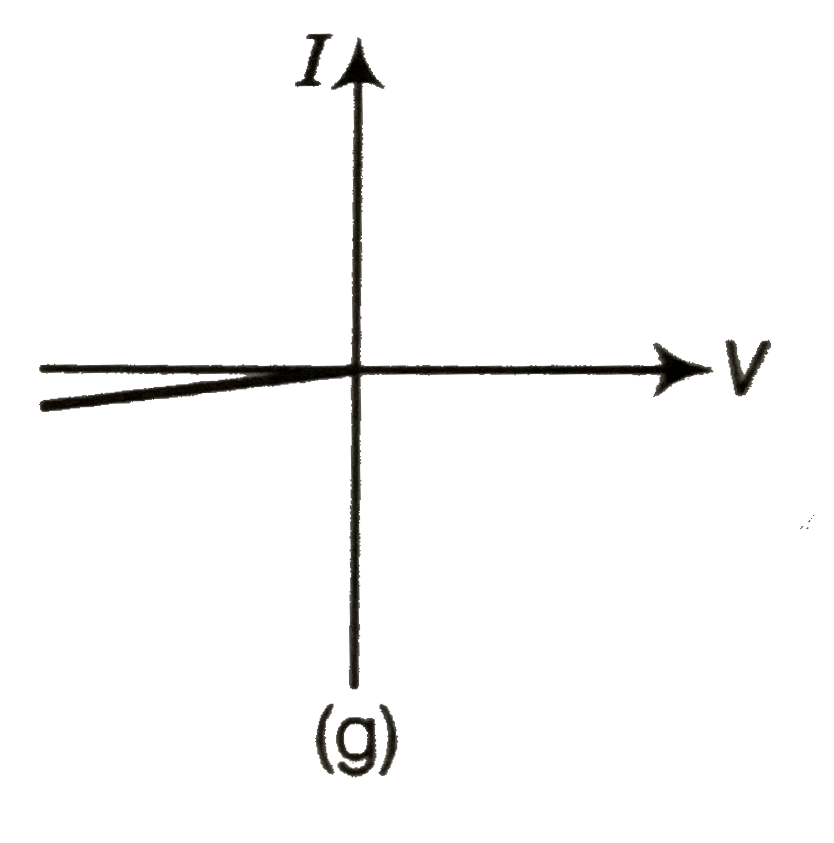
(vi) When A is negative and C is positive
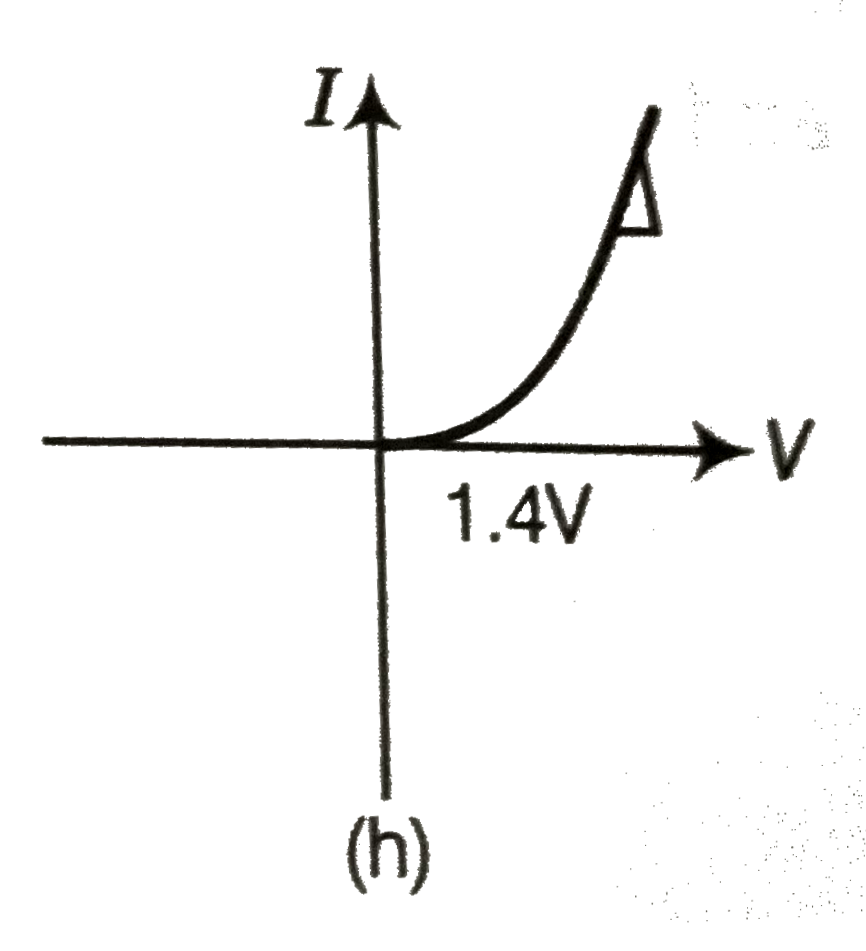
From these graphs of current − voltage characteristic shown in fig. (c) to (h) determine the arrangement of components between A, B and C.
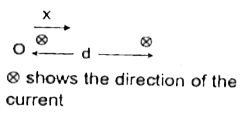
View SolutionWhich graph approximately shows the plot of magnetic field (B) with x between two current carrying conductors (as shown in the adjacent figure) if one of the conductors is at origin and they are separated by a distance d.
View Solution