Which one of the following graphs represents the variation of maximum kinetic energy (EK) of the emitted electrons with frequency u in photoelectric effect correctly ?
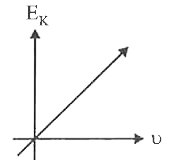
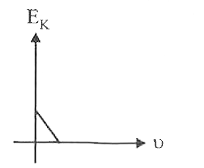
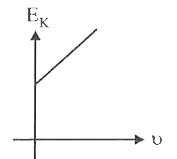
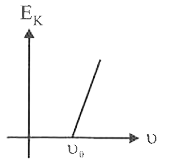
The correct Answer is:D
Step by step video, text & image solution for Which one of the following graphs represents the variation of maximum kinetic energy (E_K) of the emitted electrons with frequency u in photoelectric effect correctly ? by Physics experts to help you in doubts & scoring excellent marks in Class 12 exams.
Topper's Solved these Questions
- BOOK - DISHA PUBLICATIONCHAPTER - DUAL NATURE OF RADIATION AND MATTEREXERCISE - EXERCISE -2 : CONCEPT ALLPLICATOR30videos
DUAL NATURE OF RADIATION AND MATTER
- BOOK - DISHA PUBLICATIONCHAPTER - DUAL NATURE OF RADIATION AND MATTEREXERCISE - EXERCISE -2 : CONCEPT ALLPLICATOR30videos
DUAL NATURE OF RADIATION AND MATTER
- BOOK - DISHA PUBLICATIONCHAPTER - CURRENT ELECTRICITYEXERCISE - EXERCISE-2 Concept Applicator23videos
CURRENT ELECTRICITY
- BOOK - DISHA PUBLICATIONCHAPTER - ELECTRIC CHARGES AND FIELDS EXERCISE - Exercise - 2 : Concept applicator24videos
ELECTRIC CHARGES AND FIELDS
Similar Questions
Knowledge Check
- Question 1 - Select One
Which of the following graph is correctly represented?
A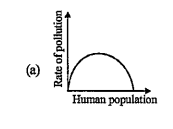 B
B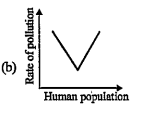 C
C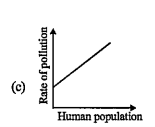 D
D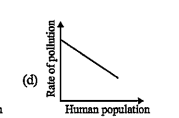
- Question 2 - Select One
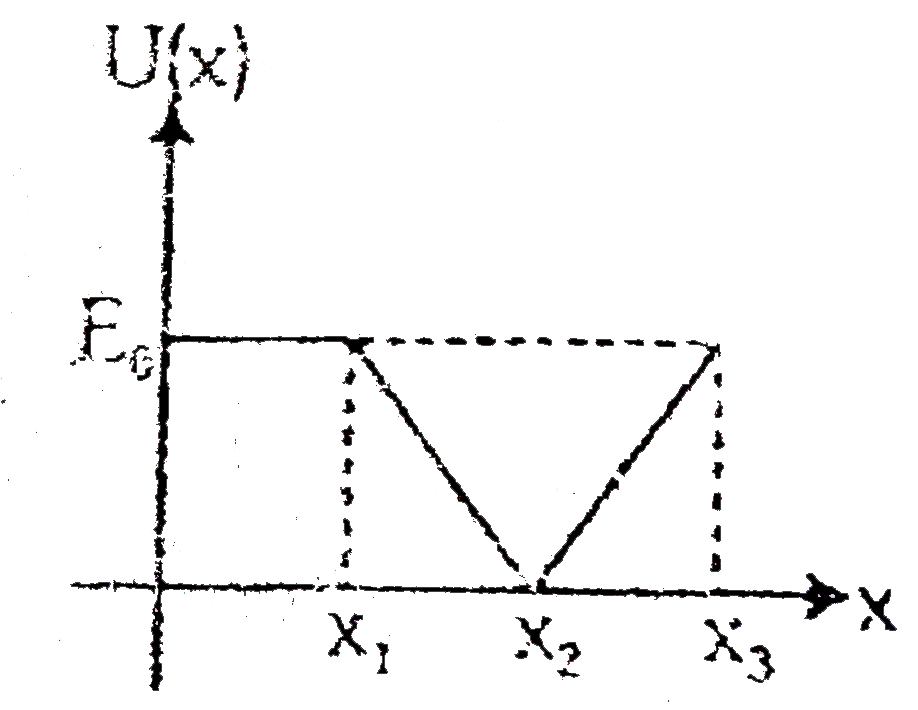
The potential energy U(x) of a particle moving along x−axis is shown in figure. Which one of the following graphs represents the variation of kinetic energy of this particel if its total mechanical enery is E0
 A
A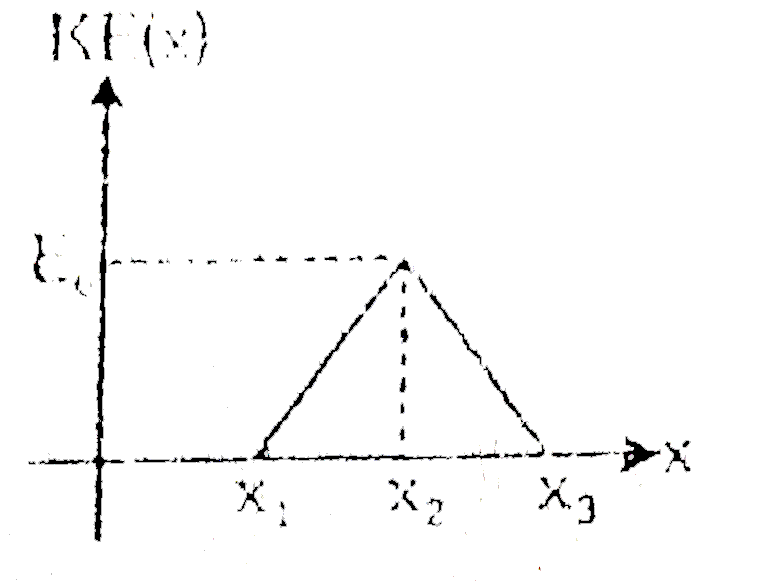 B
B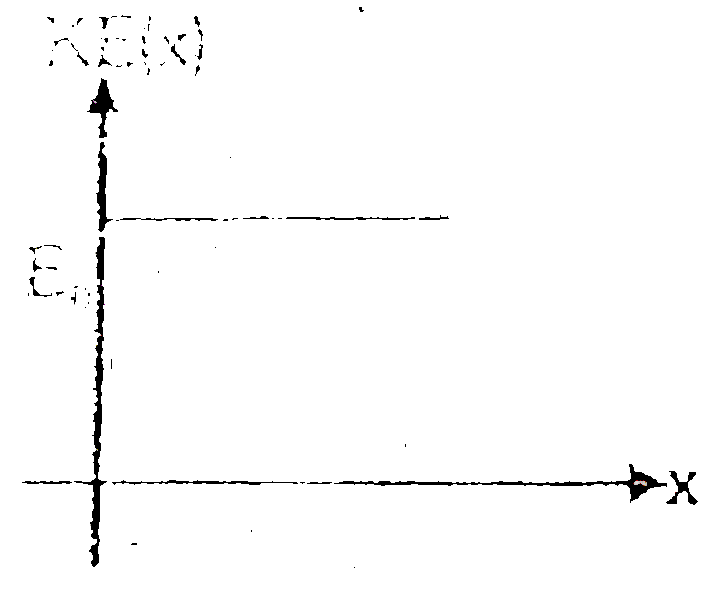 C
C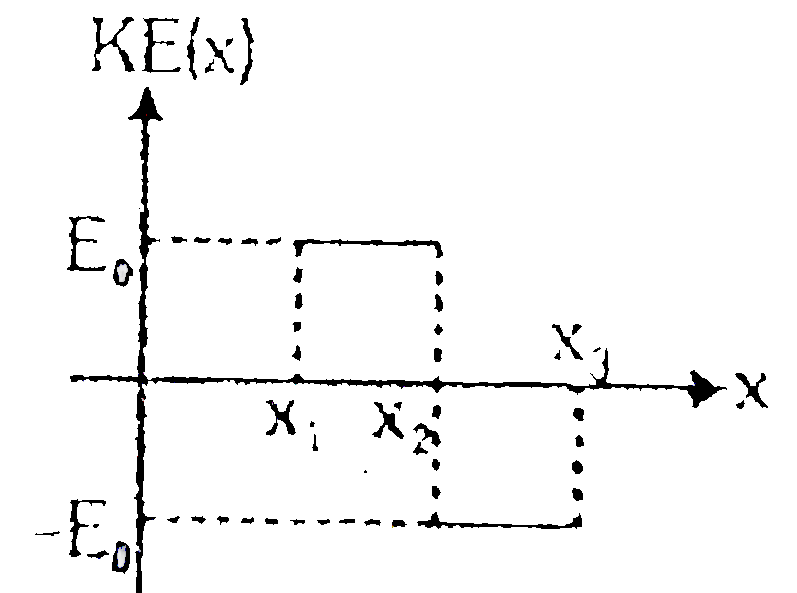 D
D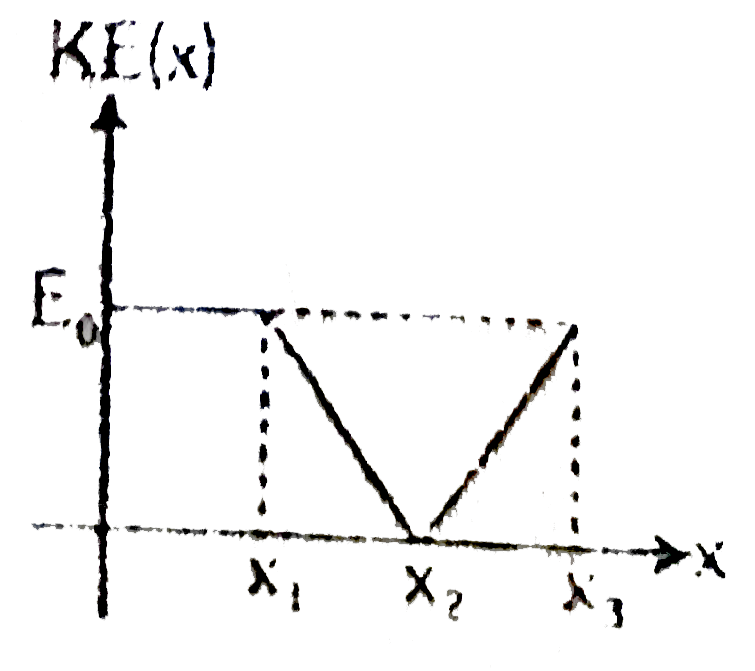
- Question 3 - Select One
The maximum kinetic energy of emitted electrons in a photoelectric effect does not depend upon
AIntensityBWork functionCWavelengthDFrequency
Which one of the following correctly represents the variation between linear momentum (P) and kinetic energy (E) ofa body?
View SolutionThe kinetic energy of the ejected electrons in photoelectric effect is
View SolutionWhich of the following graphs represents the graphical relation between momentum (p) and kinetic energy (K) for a body in motion?
View SolutionThe graph which represents the variation of mean kinetic energy of moleules with temperature ∘C is ?
View SolutionWhich one of the following graphs in figure shows the variation of photoelectric current (I) with voltage (V) between the electrodes in a photoelectric cell?
View Solution

