Which one of the following correctly represents the variation between linear momentum (P) and kinetic energy (E) ofa body?
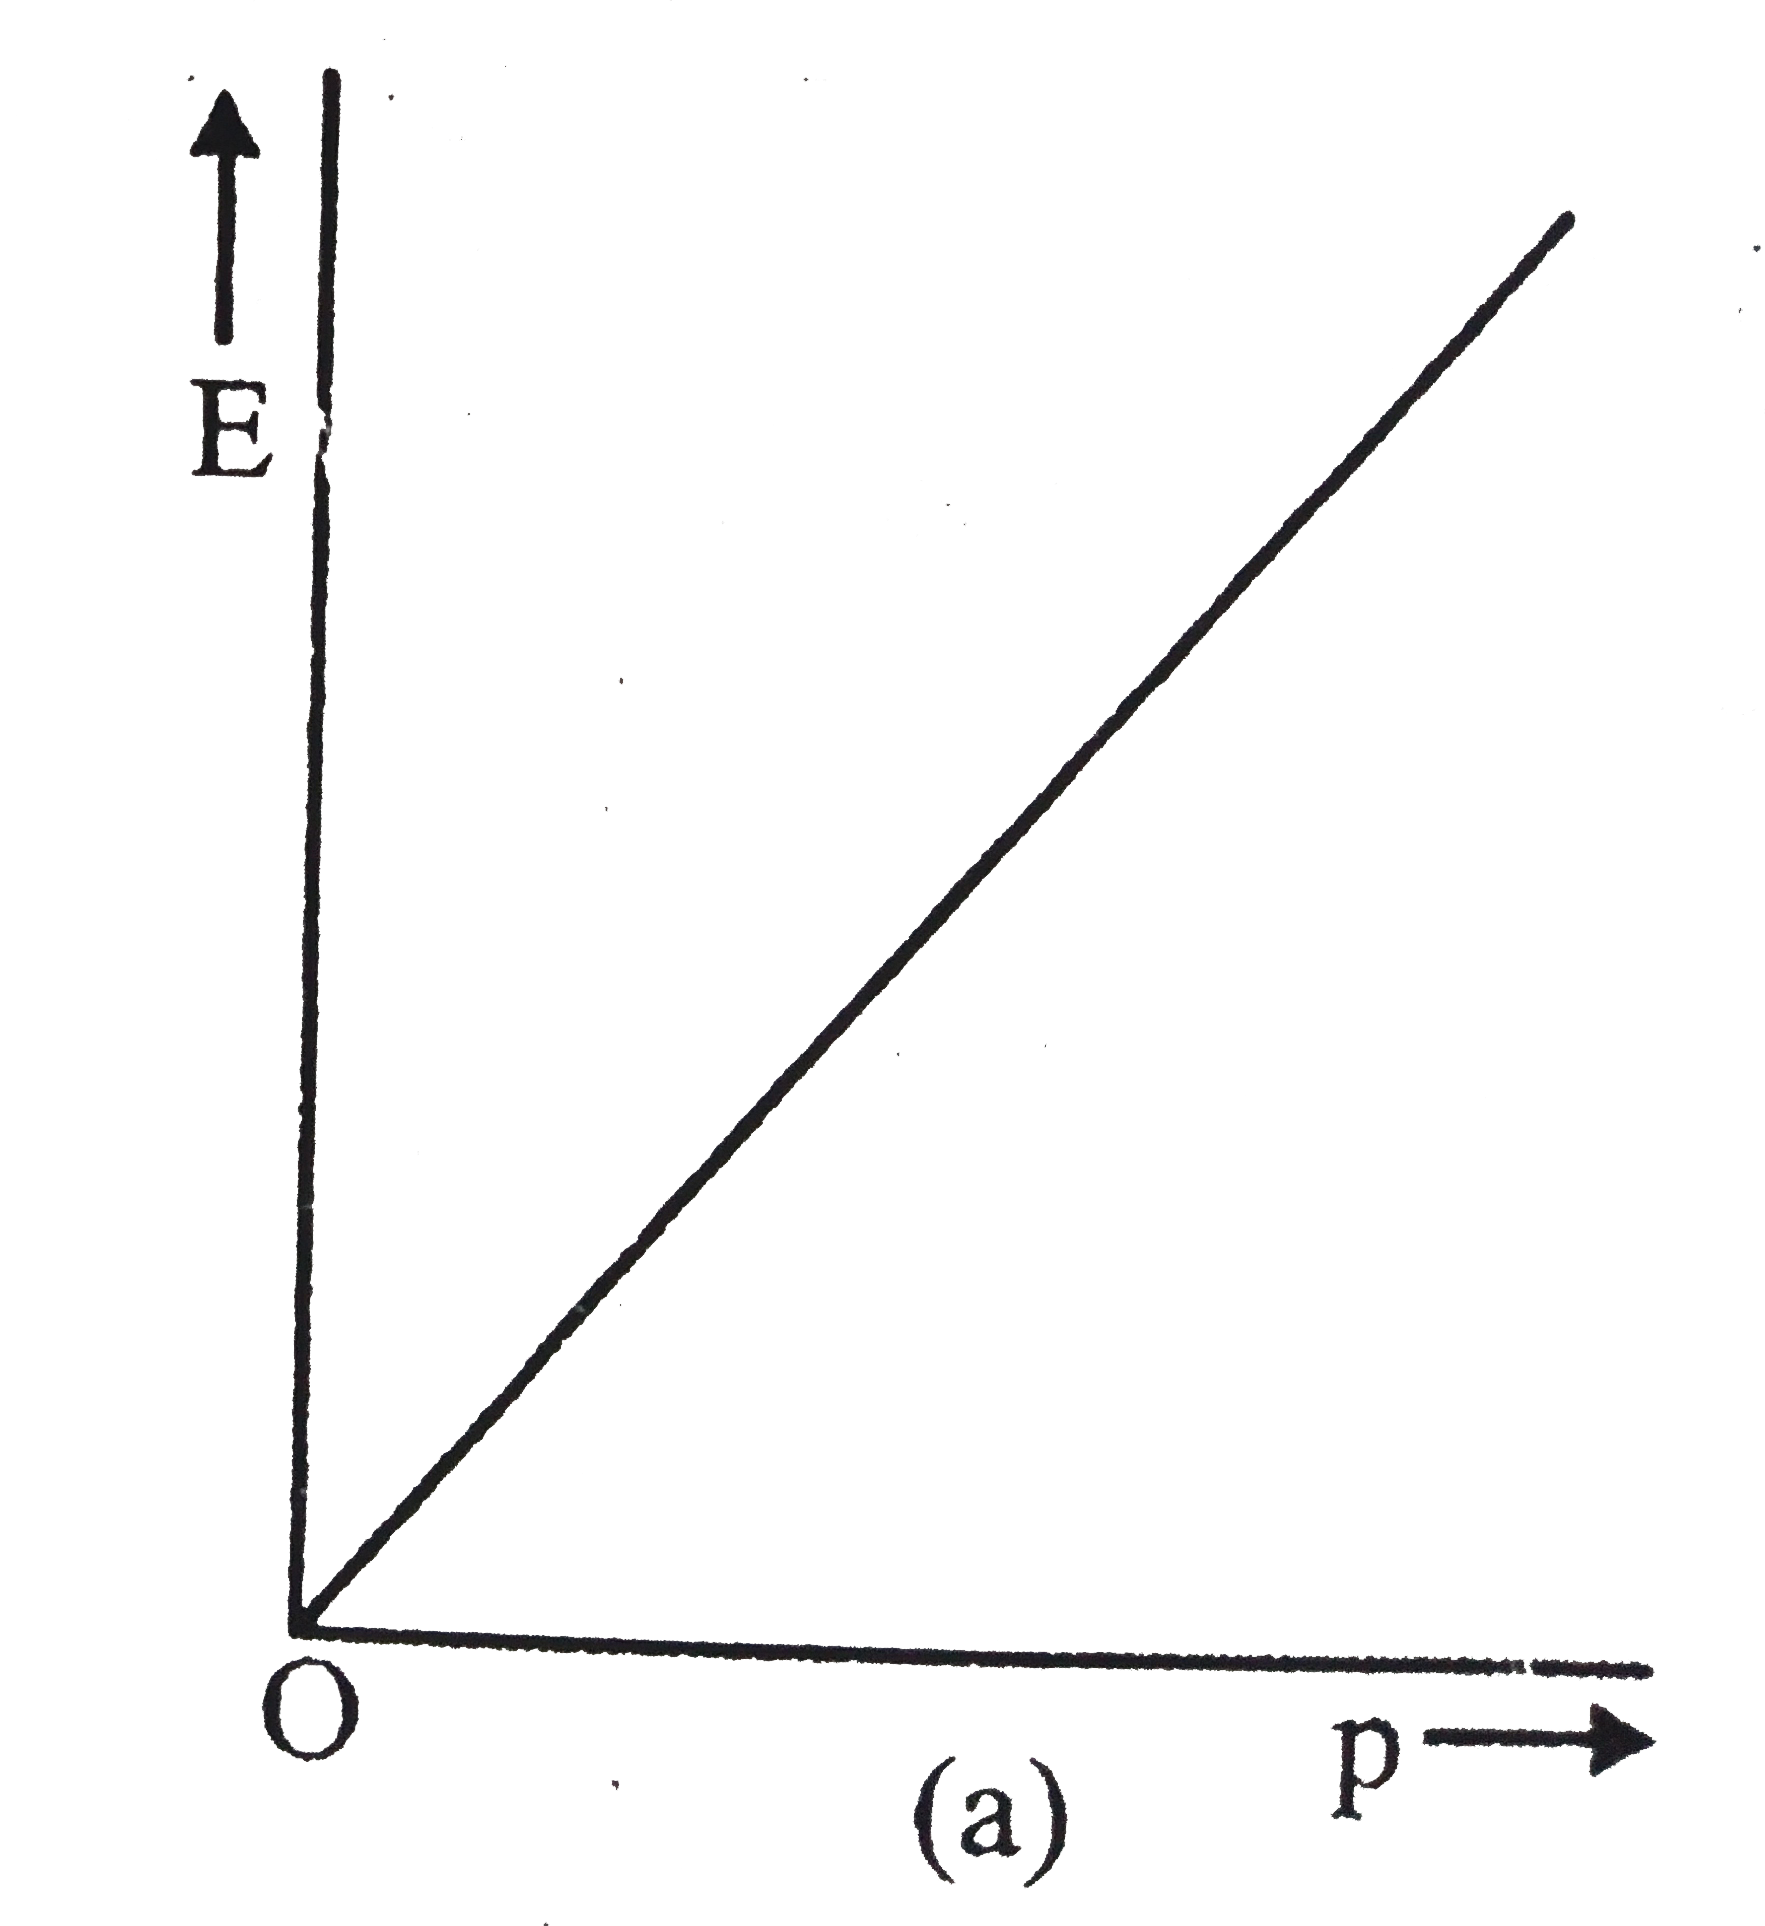
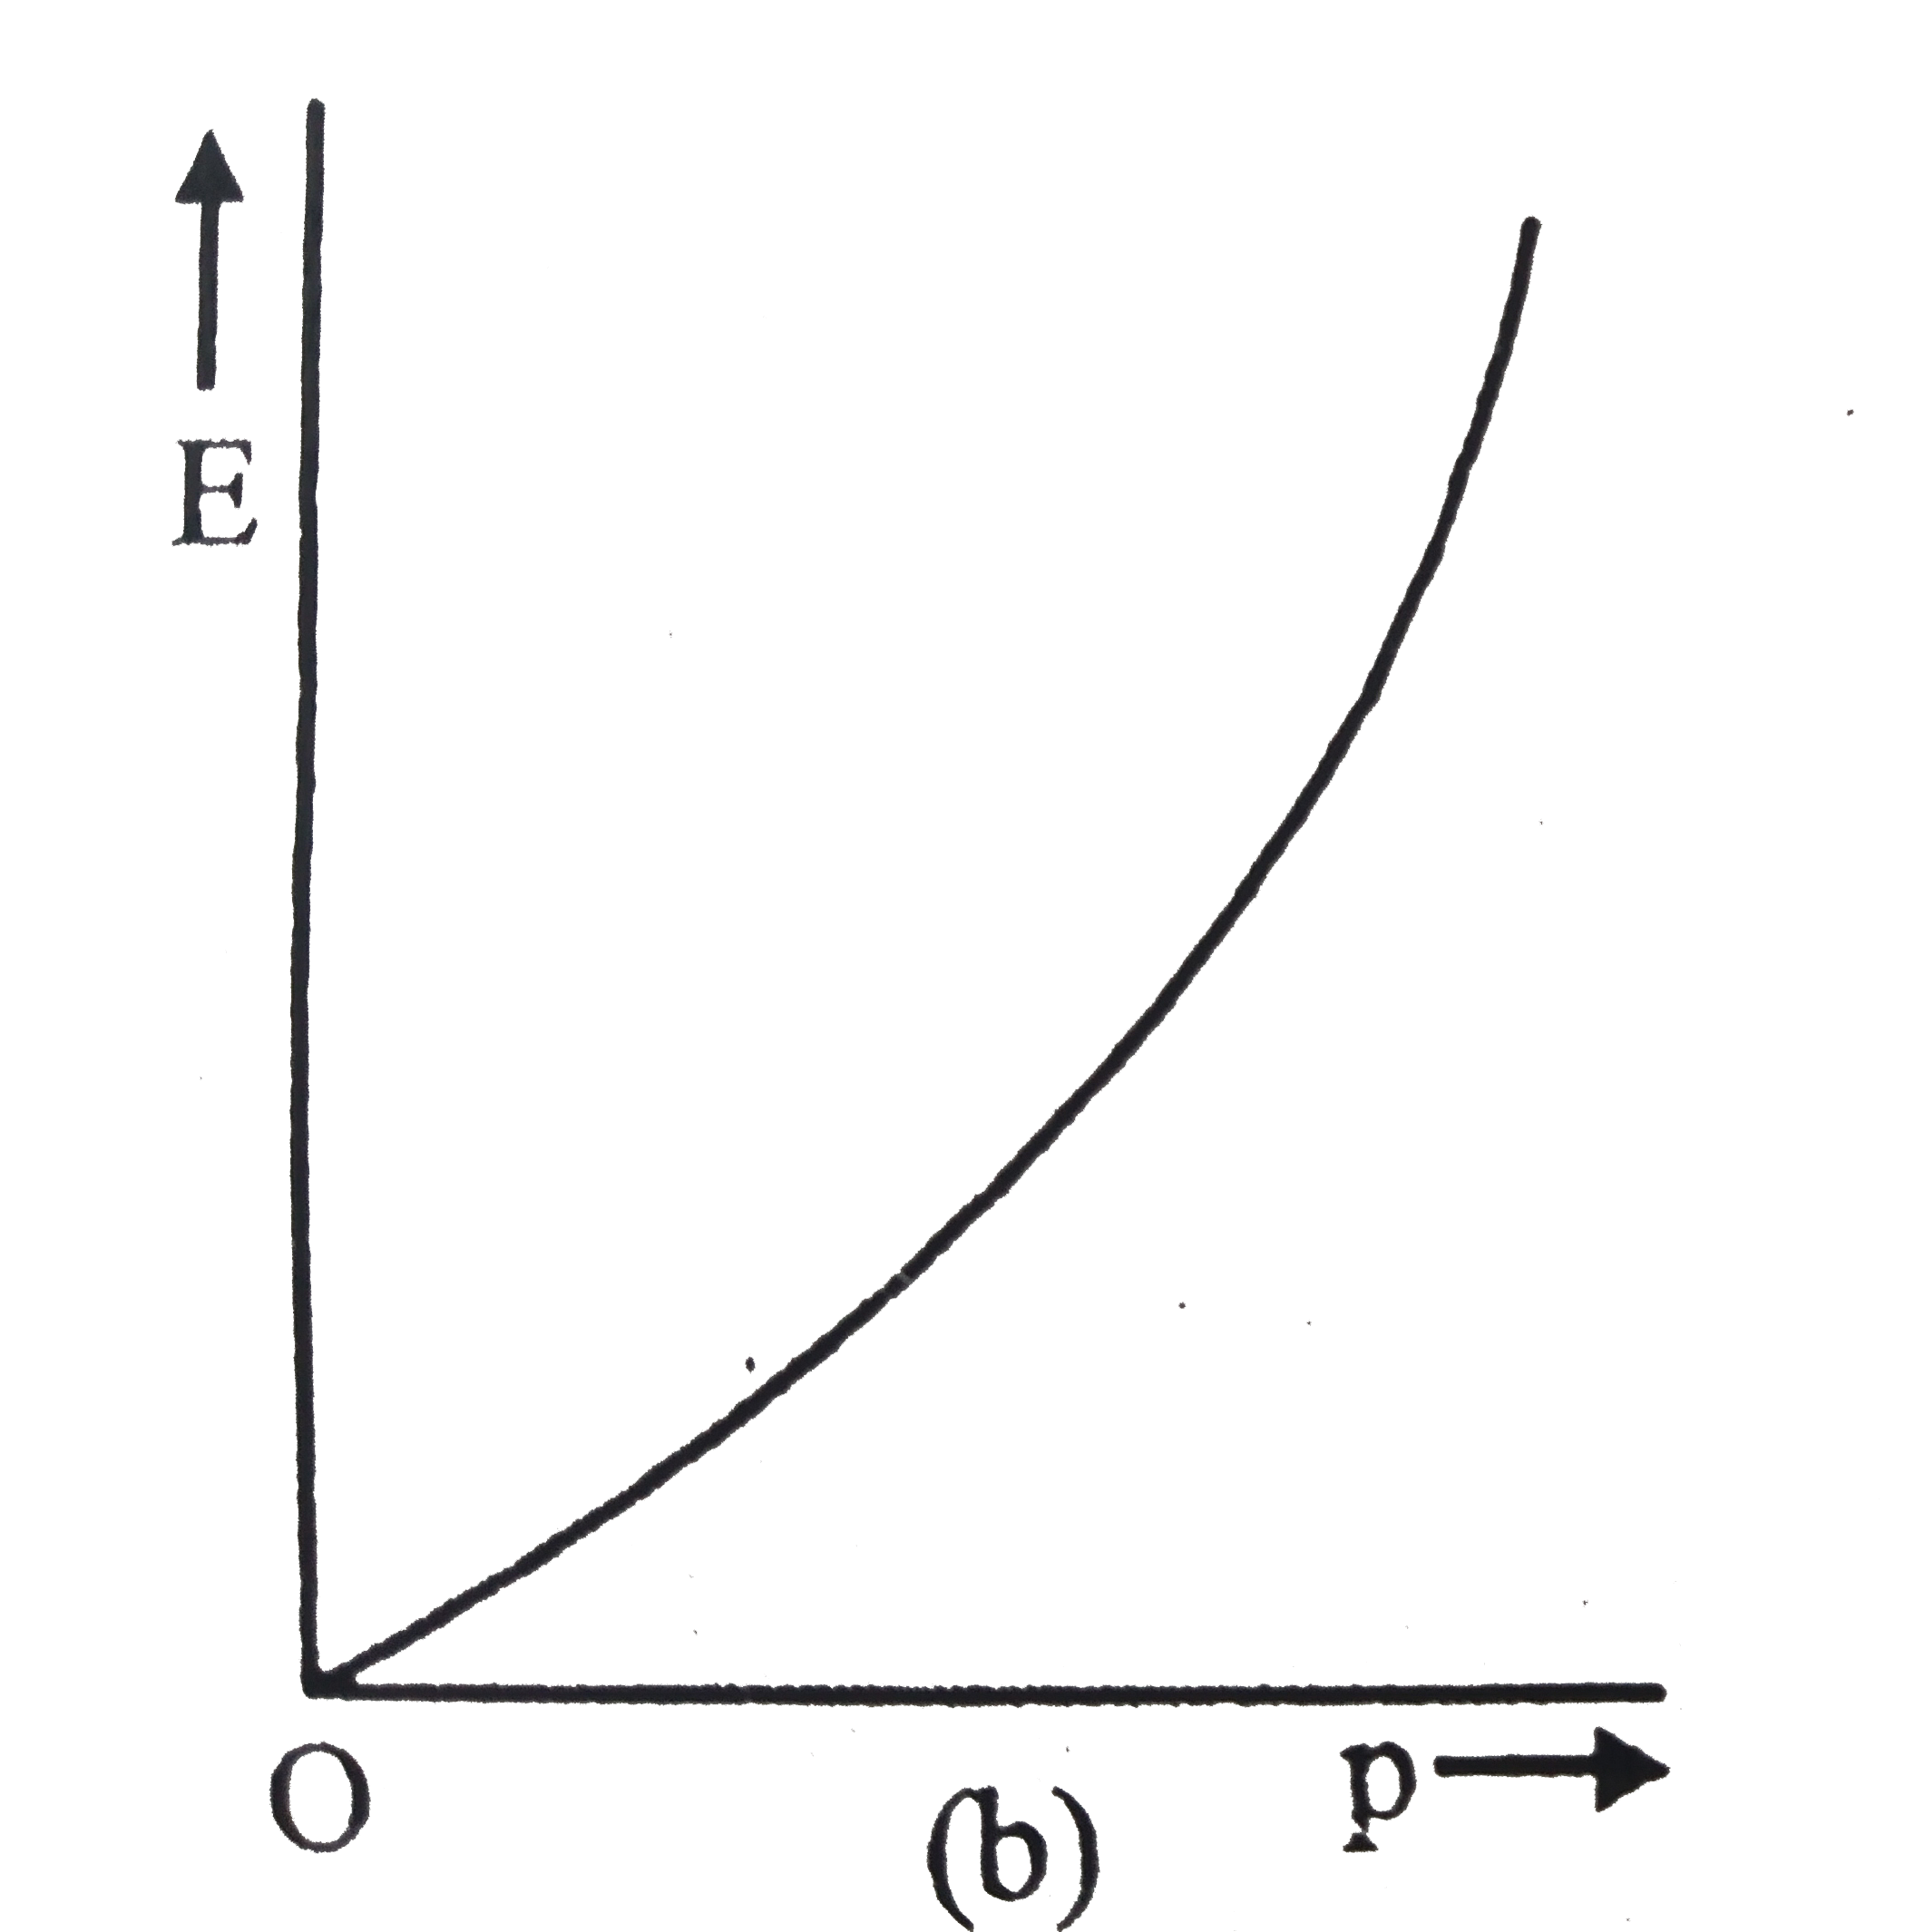
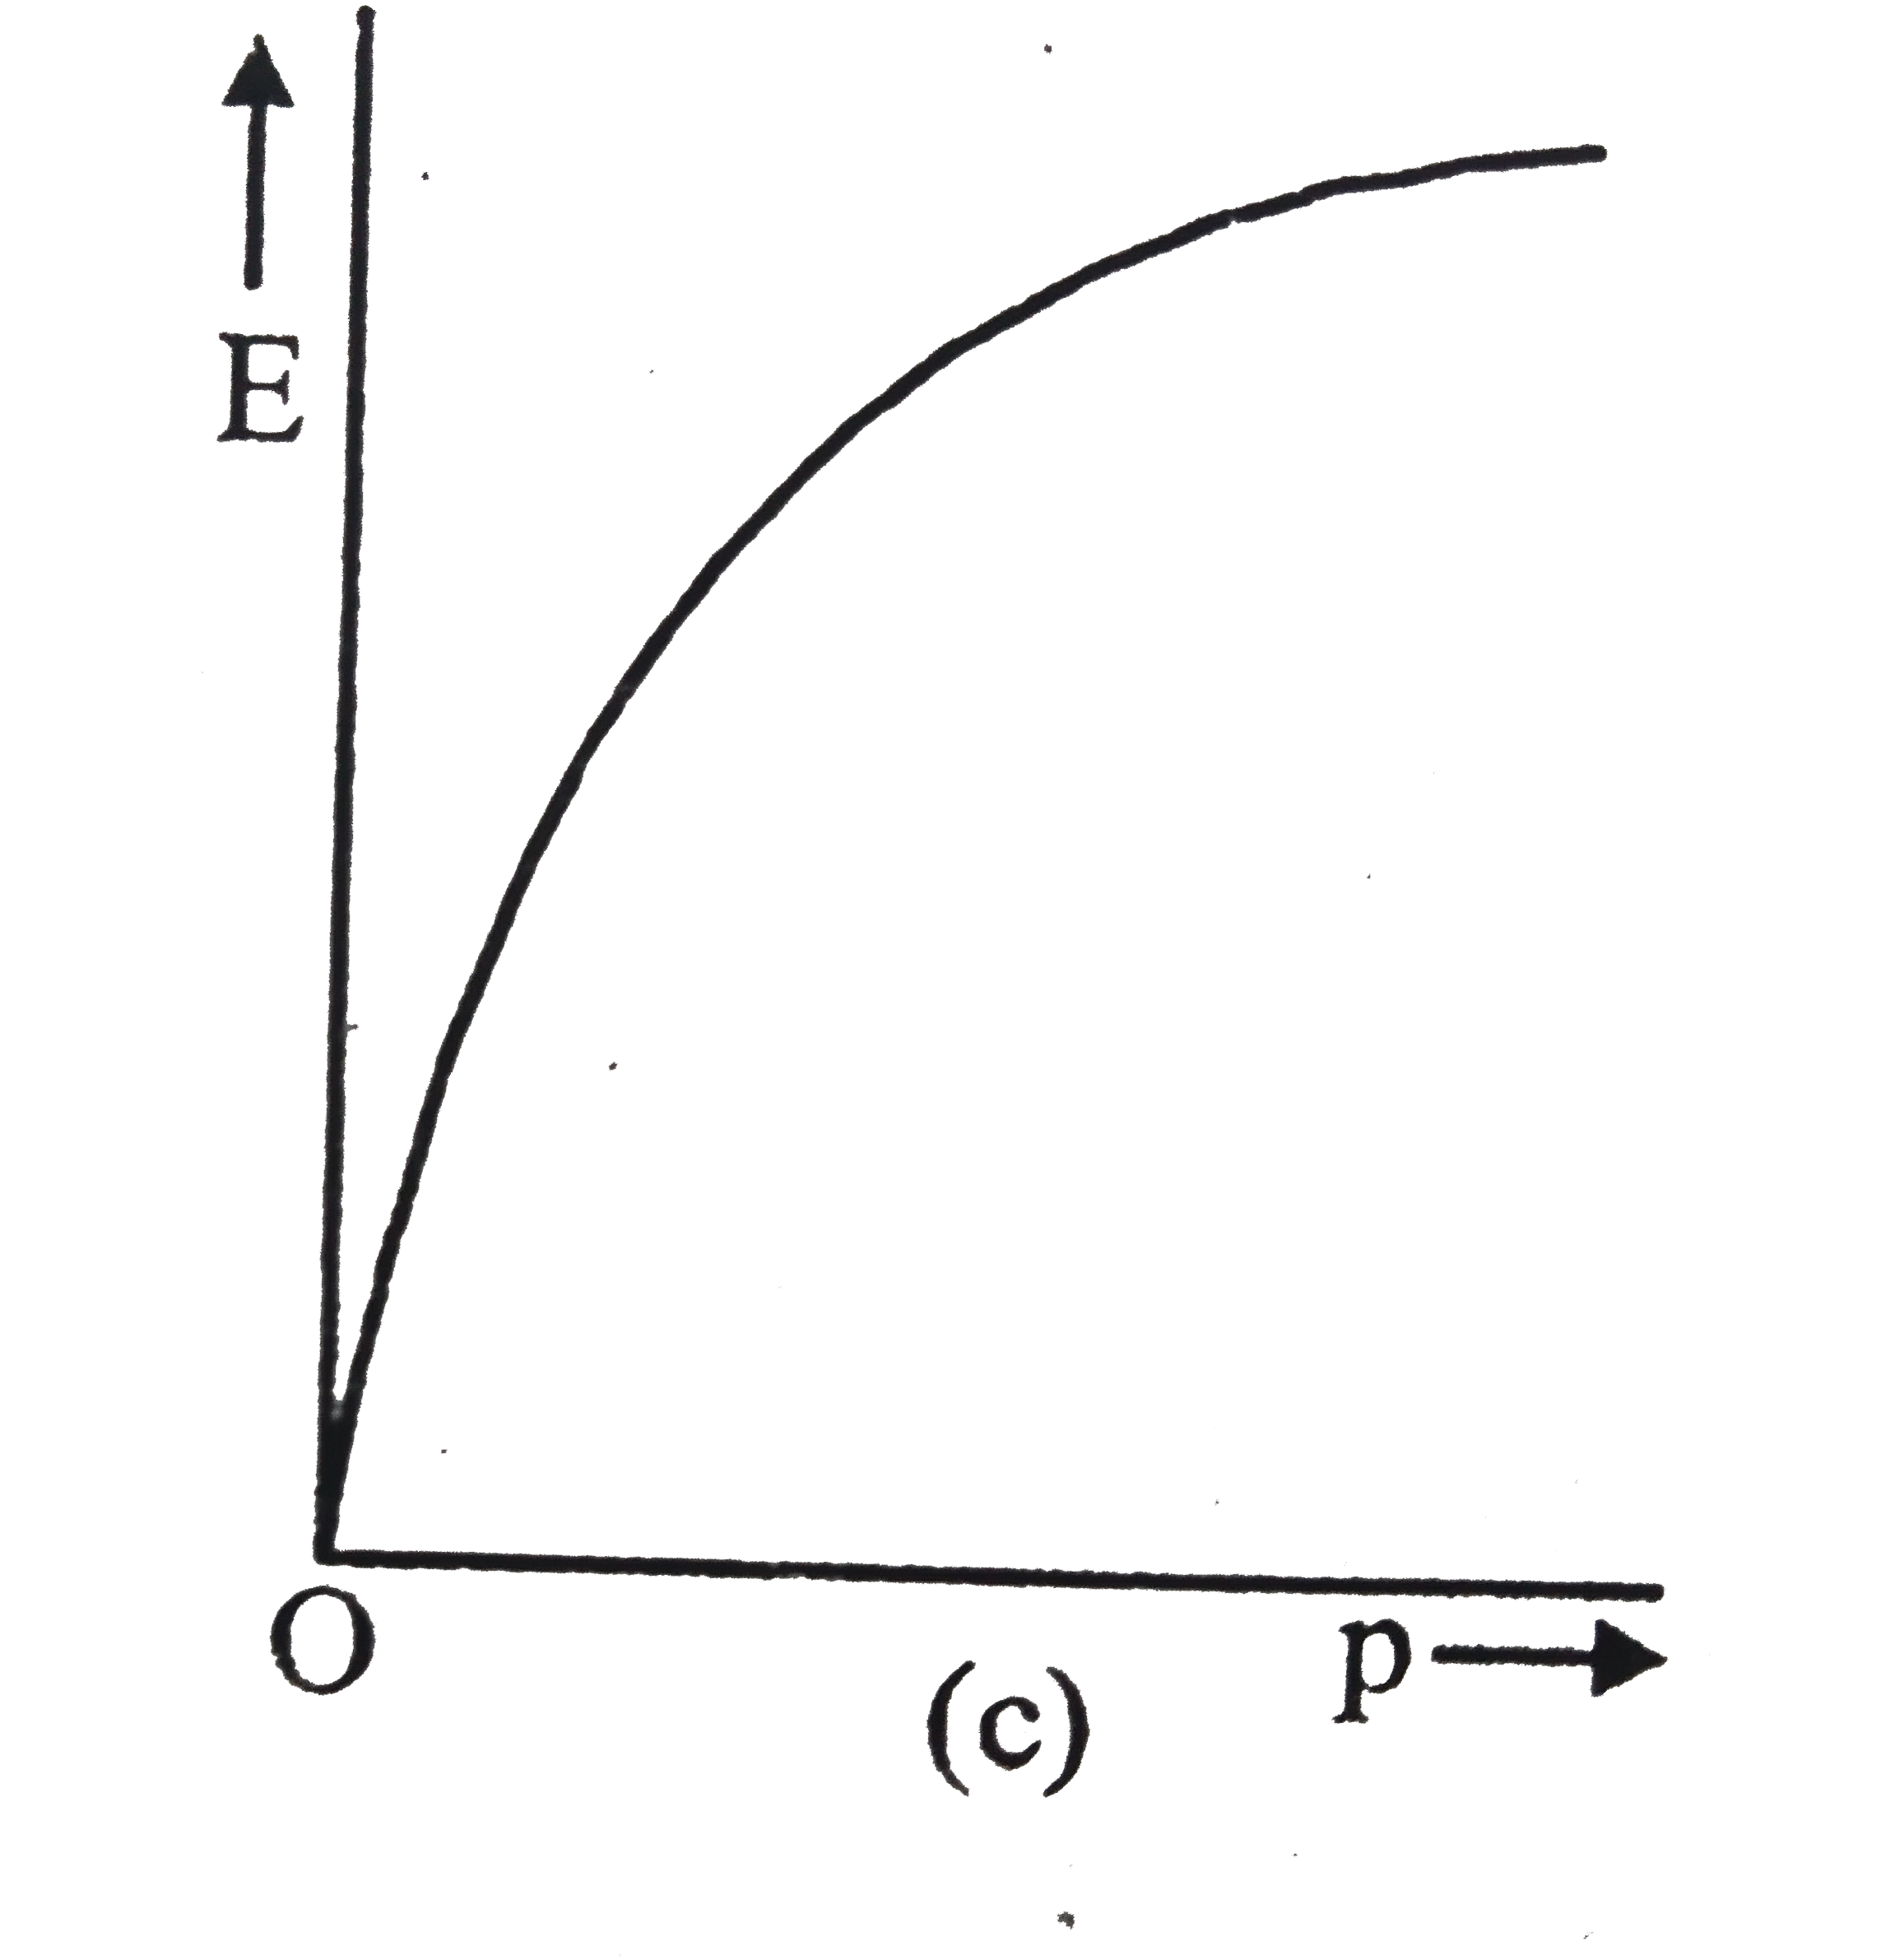
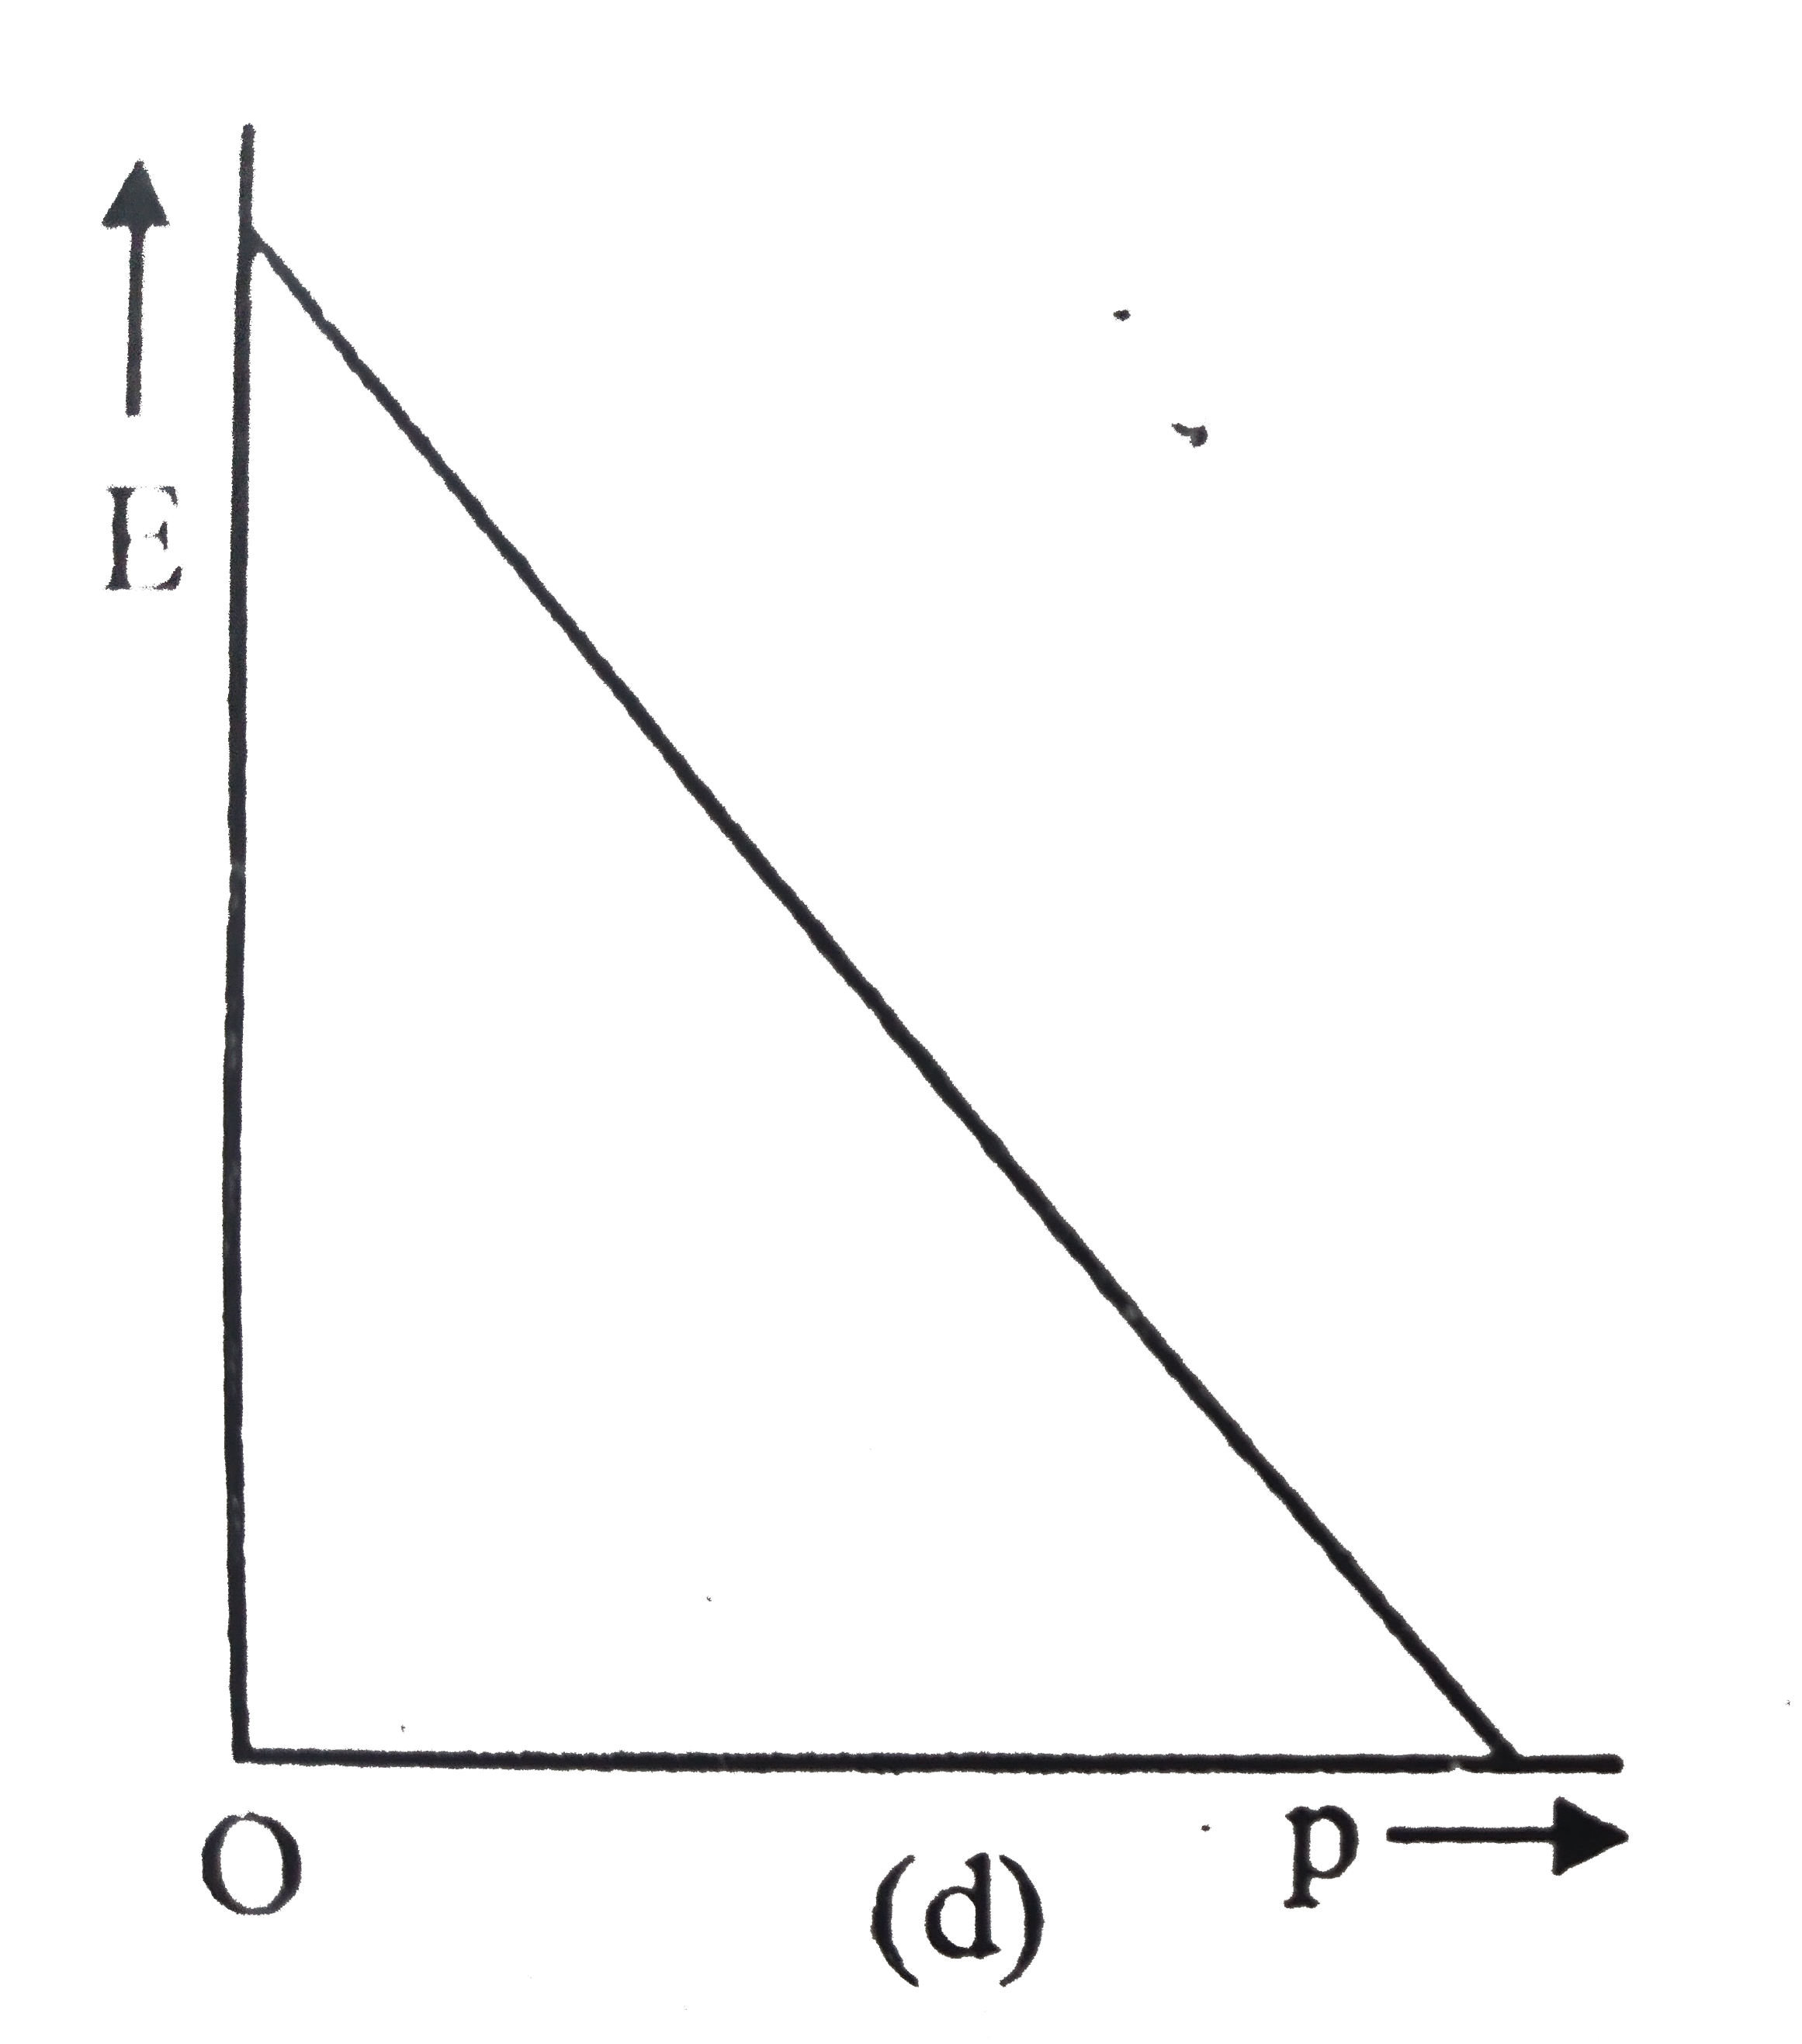
The correct Answer is:B
To determine the relationship between linear momentum (P) and kinetic energy (E) of a body, we start with the definitions of both quantities:
1. Linear Momentum (P):
P=mv
where m is the mass of the body and v is its velocity.
2. Kinetic Energy (E):
E=12mv2
Next, we can express kinetic energy in terms of momentum. We know that momentum can be rewritten in terms of velocity:
v=Pm
Substituting this expression for v into the kinetic energy formula gives:
E=12m(Pm)2
E=12m⋅P2m2
E=P22m
This equation shows that kinetic energy E is proportional to the square of the momentum P:
E∝P2
Now, to express the relationship between P and E, we can rearrange the equation:
P2=2mE
Taking the square root of both sides gives:
P=√2mE
This indicates that momentum P is proportional to the square root of kinetic energy E:
P∝√E
Conclusion:
The relationship between linear momentum (P) and kinetic energy (E) can be represented graphically as P versus √E. The graph will show that as kinetic energy increases, momentum increases as well, but at a decreasing rate (since it is a square root relationship).
P=mv
where m is the mass of the body and v is its velocity.
E=12mv2
v=Pm
E=12m(Pm)2
E=12m⋅P2m2
E=P22m
E∝P2
P2=2mE
Taking the square root of both sides gives:
P=√2mE
P∝√E
The relationship between linear momentum (P) and kinetic energy (E) can be represented graphically as P versus √E. The graph will show that as kinetic energy increases, momentum increases as well, but at a decreasing rate (since it is a square root relationship).
Topper's Solved these Questions
Similar Questions
Which of following graphs correctly represents the variation of particle momentum with de-Broglie wavelength?
View SolutionWhich one of the following graphs represents the variation of maximum kinetic energy (EK) of the emitted electrons with frequency u in photoelectric effect correctly ?
View Solution
Knowledge Check
Which of the following graphs represents the graphical relation between momentum (p) and kinetic energy (K) for a body in motion?
A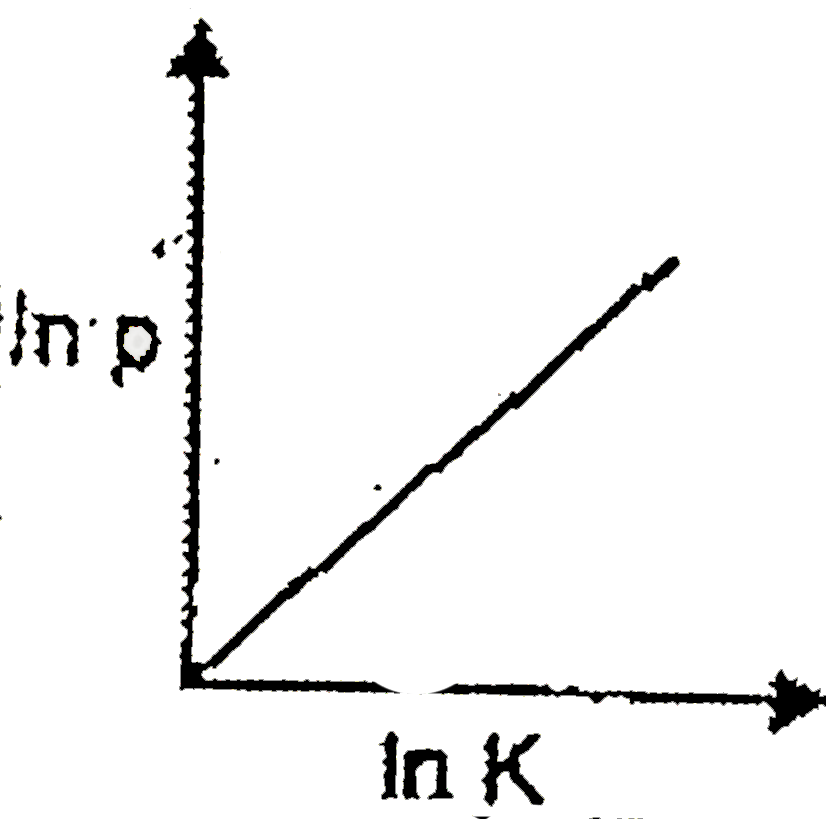 B
B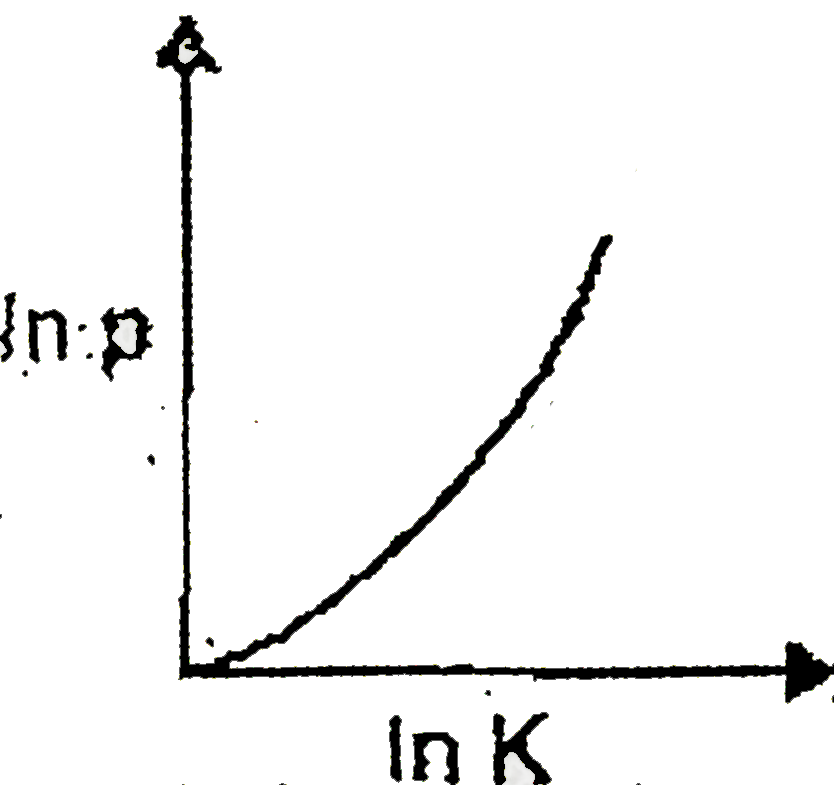 C
C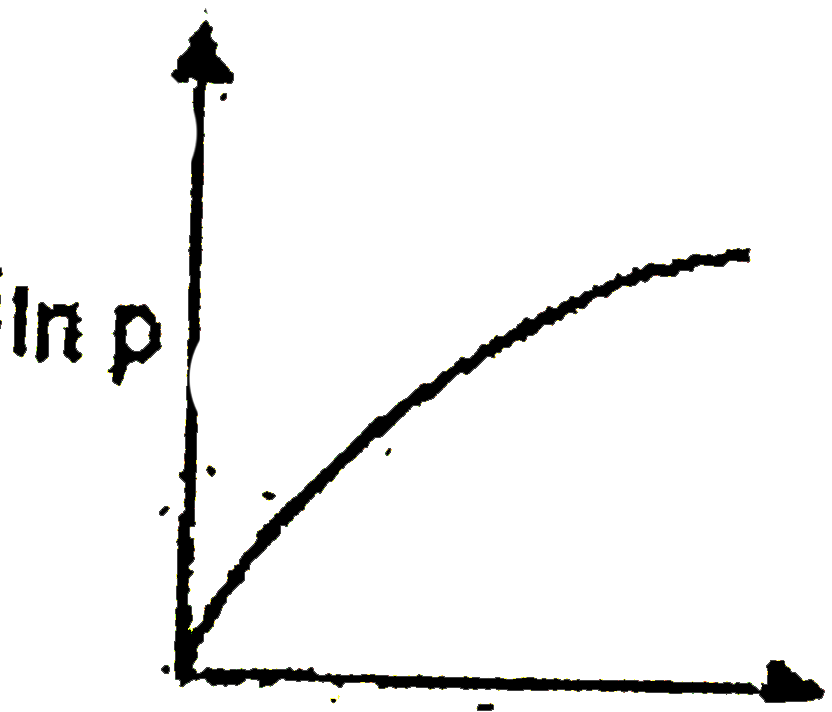 DNone
DNoneWhich of the following expressions correctly represents the relationship between the average molar kinetic energies (KE) of CO and N2 molecules at the same temperature?
AKECO=KEN2BKECO>KEN2CKECO<KEN2DCannot be predicted unless volumes of the gases are givenWhich of the following expressions correctly represents the relationship between the average molar kinetic energies (KE) of CO and N2 molecules at the same temperature?
A¯¯¯¯¯¯KECO=¯¯¯¯¯¯KEN2B¯¯¯¯¯¯KECO>¯¯¯¯¯¯KEN2C¯¯¯¯¯¯KECO<¯¯¯¯¯¯KEN2DAll of the above
The graph between linear monentum (p) and Kinetic energy (k) is best represented by
View SolutionWhich of the following expressions correctly represents the relationship between the average molar kinetic energies (KE) of CO and N2 molecules at the same temperature?
View SolutionWhich of the following expression correctly represents the relationship between the average kinetic energy of CO and N2 molecules at the same temperature?
View SolutionRelationship between angular momentum L and kinetic energy E of a rigid body in pure rotation is
View SolutionA body moves from rest with a constant acceleration. Which one of the following graphs represents the variation of its kinetic energy K with the distance travelled x?
View Solution
