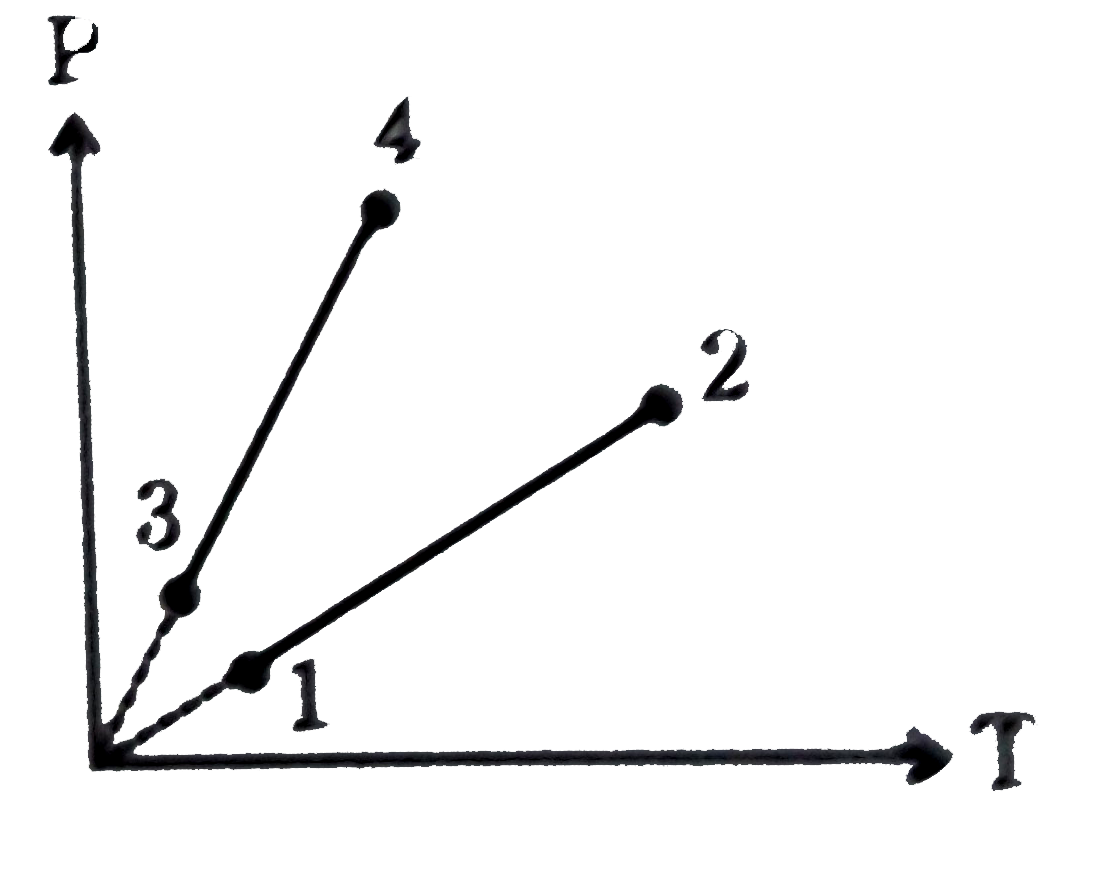
PV versus T graph of equal masses of H2, He and O2 is shown in Figure choose the correct alternative.

A corresponds to He, B to H2 and C to O2
A corresponds to H2, B to He and C to O2
A corresponds to He, B to O2 and C to H2
A corresponds to O2, B to H2 and C to He
The correct Answer is:A
Step by step video & image solution for PV versus T graph of equal masses of H_(2), He and O_(2) is shown in Figure choose the correct alternative. by Physics experts to help you in doubts & scoring excellent marks in Class 12 exams.
Updated on:21/07/2023Topper's Solved these Questions
- RACEBOOK - ALLENCHAPTER - RACEEXERCISE - Basic Maths (Thermal Physics) (Thermodynamic process)
21 Videos
- RACEBOOK - ALLENCHAPTER - RACEEXERCISE - Basic Maths (Dscillations) (Kinematics of SHM)
20 Videos
- RACEBOOK - ALLENCHAPTER - RACEEXERCISE - Basic Maths (Thermal Physics) (Mode of Heat Transfer)
12 Videos
- NEWTONS LAWS OF MOTIONBOOK - ALLENCHAPTER - NEWTONS LAWS OF MOTIONEXERCISE - EXERCISE-III
28 Videos
- SIMPLE HARMONIC MOTIONBOOK - ALLENCHAPTER - SIMPLE HARMONIC MOTIONEXERCISE - Example
1 Videos
Similar Questions
Knowledge Check
PV versus T graph of equal masses of H2, He and CO2 is shown in figure. Choose the correct alternative?
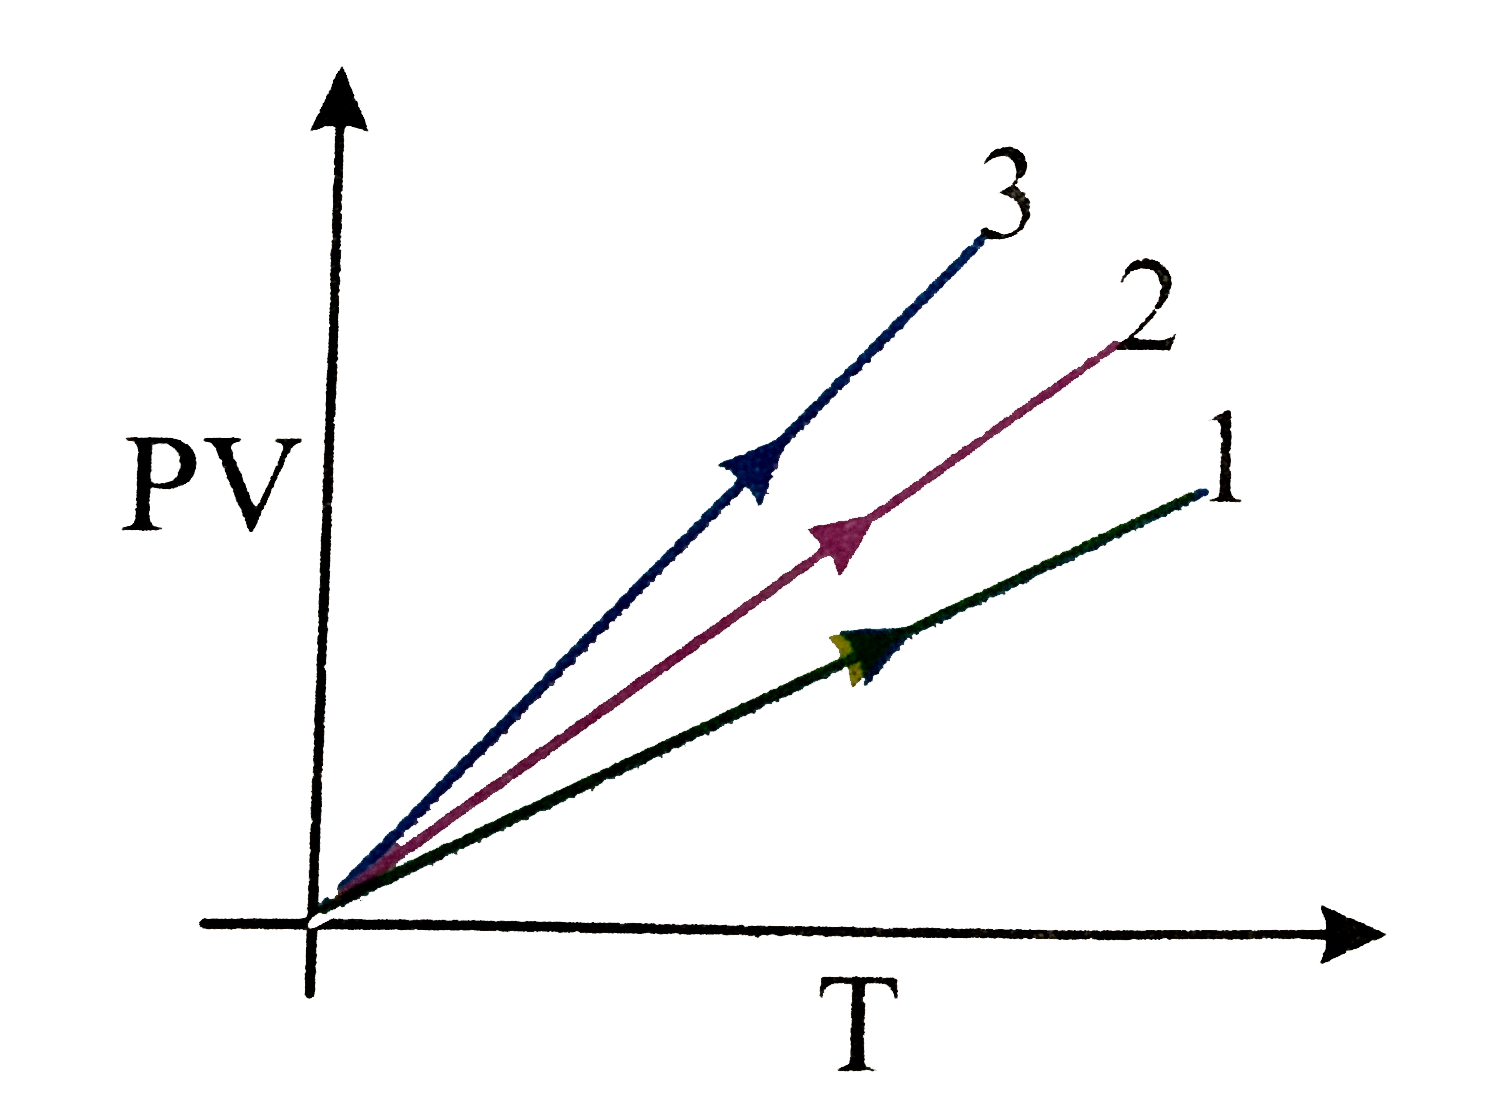 A3 corresponds to H2,2 to He and 1 to CO2B1 corresponds to He, 2 to H2 and 3 to CO2C1 corresponds to He, 3 to H2 and 2 to CO2D1 corresponds to CO2,2 to H2 and 3 to He
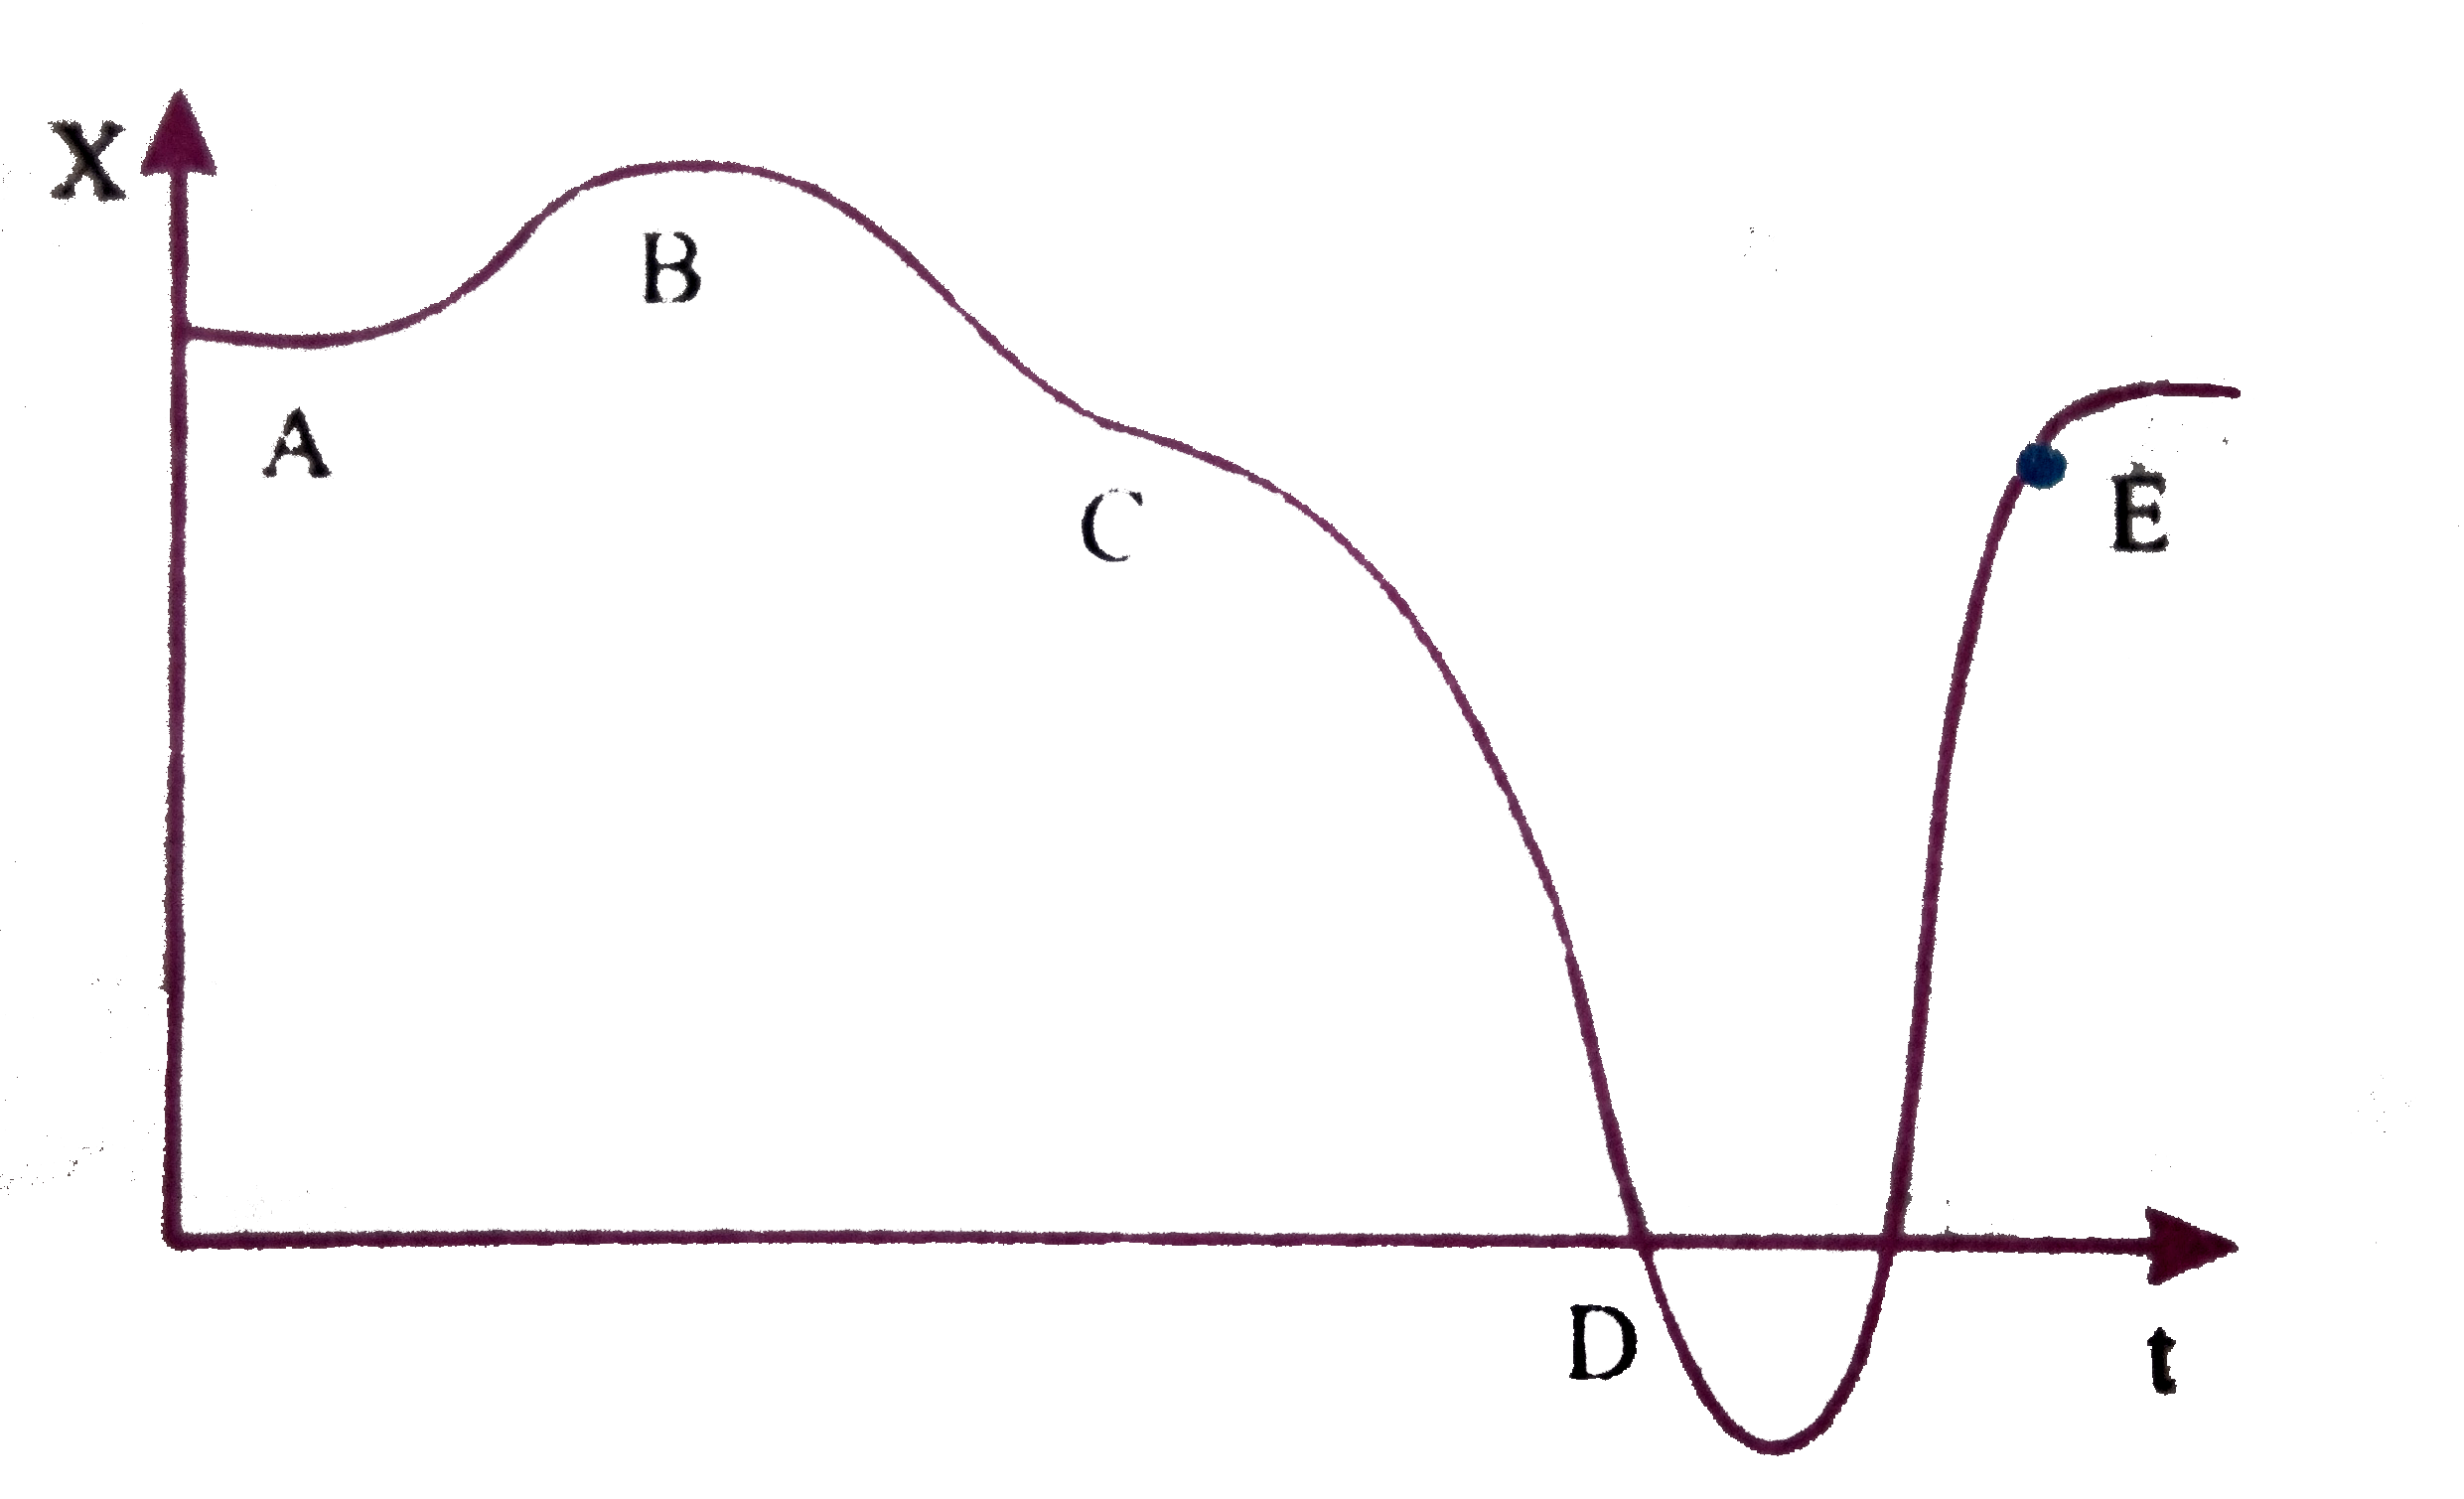
A graph of x versus t is shown in figure. Choose correct alternative from below.AThe particle was released from rest at t=0BAt B, the accleration a>0CAverage velocity for the motion between A and D is positive.DThe speed at D exceeds that at E.Equal masses of SO2 and O2 are placed in a flask at STP . Choose the correct statement .
AThe number of molecules of O2 are more than SO2 .BVolume occupied at STP is more for O2 than SO2CThe ratio of number of atoms of SO2 and O2 is 3:4.DMoles of SO2 is greater than the moles of O2
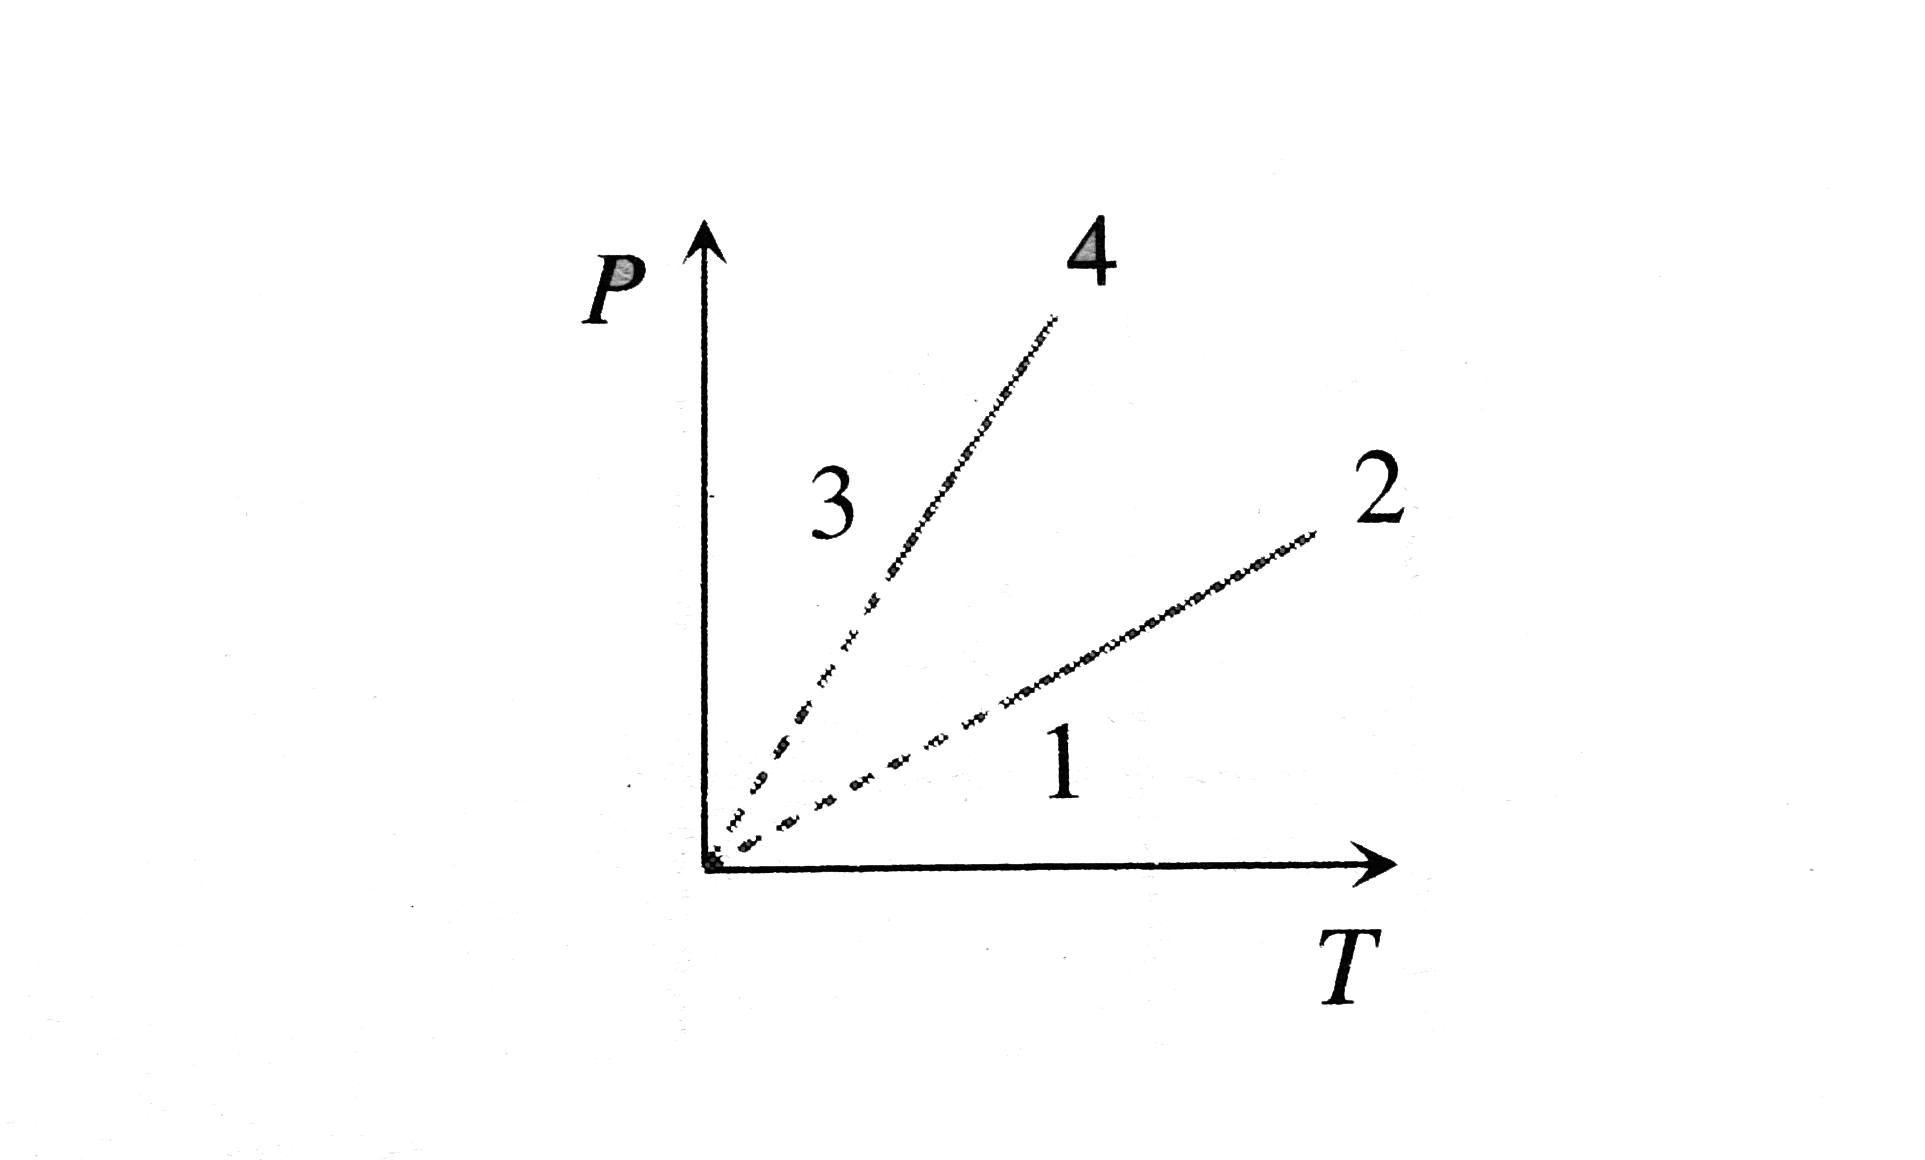
Pressure versus temperature graph of an ideal gas of equal number of moles of different volumes is plotted as shown in Fig. Choose the correct alternative.
View Solution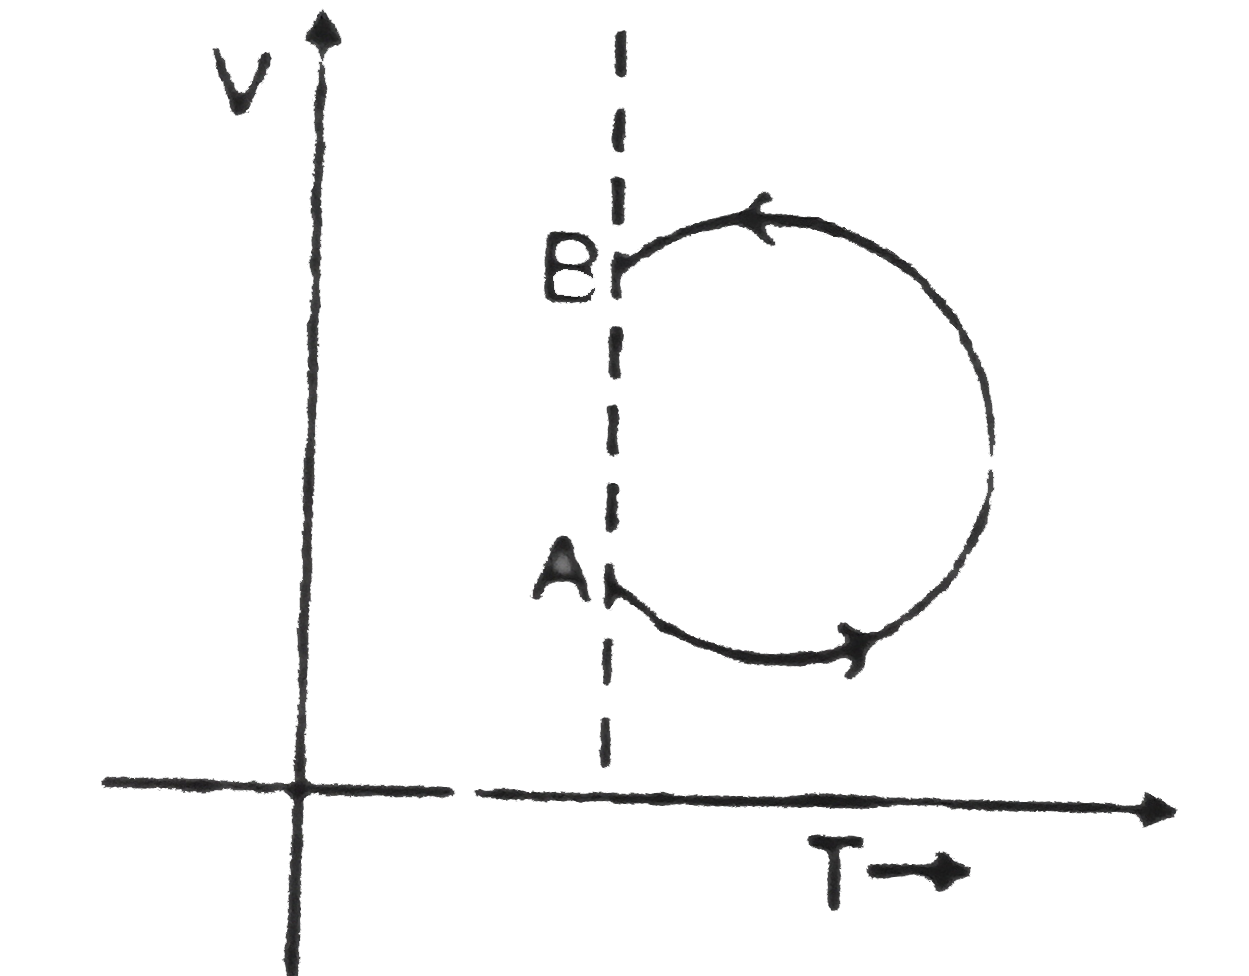
With reference of the above graph, choose the correct alternatives
View SolutionA particle is moving in such a way that its velocity versus time graph is a parabola (t=kv2,k is constant) as shown in the figure. Choose the correct option(s)

View SolutionThe P−T graph for the given mass of an ideal gas is shown in figure. Then the volume
_E01_022_Q01.png)
View SolutionThe heating curve of a particular substance in solid state is as shown in the figure .choose the correct alternative
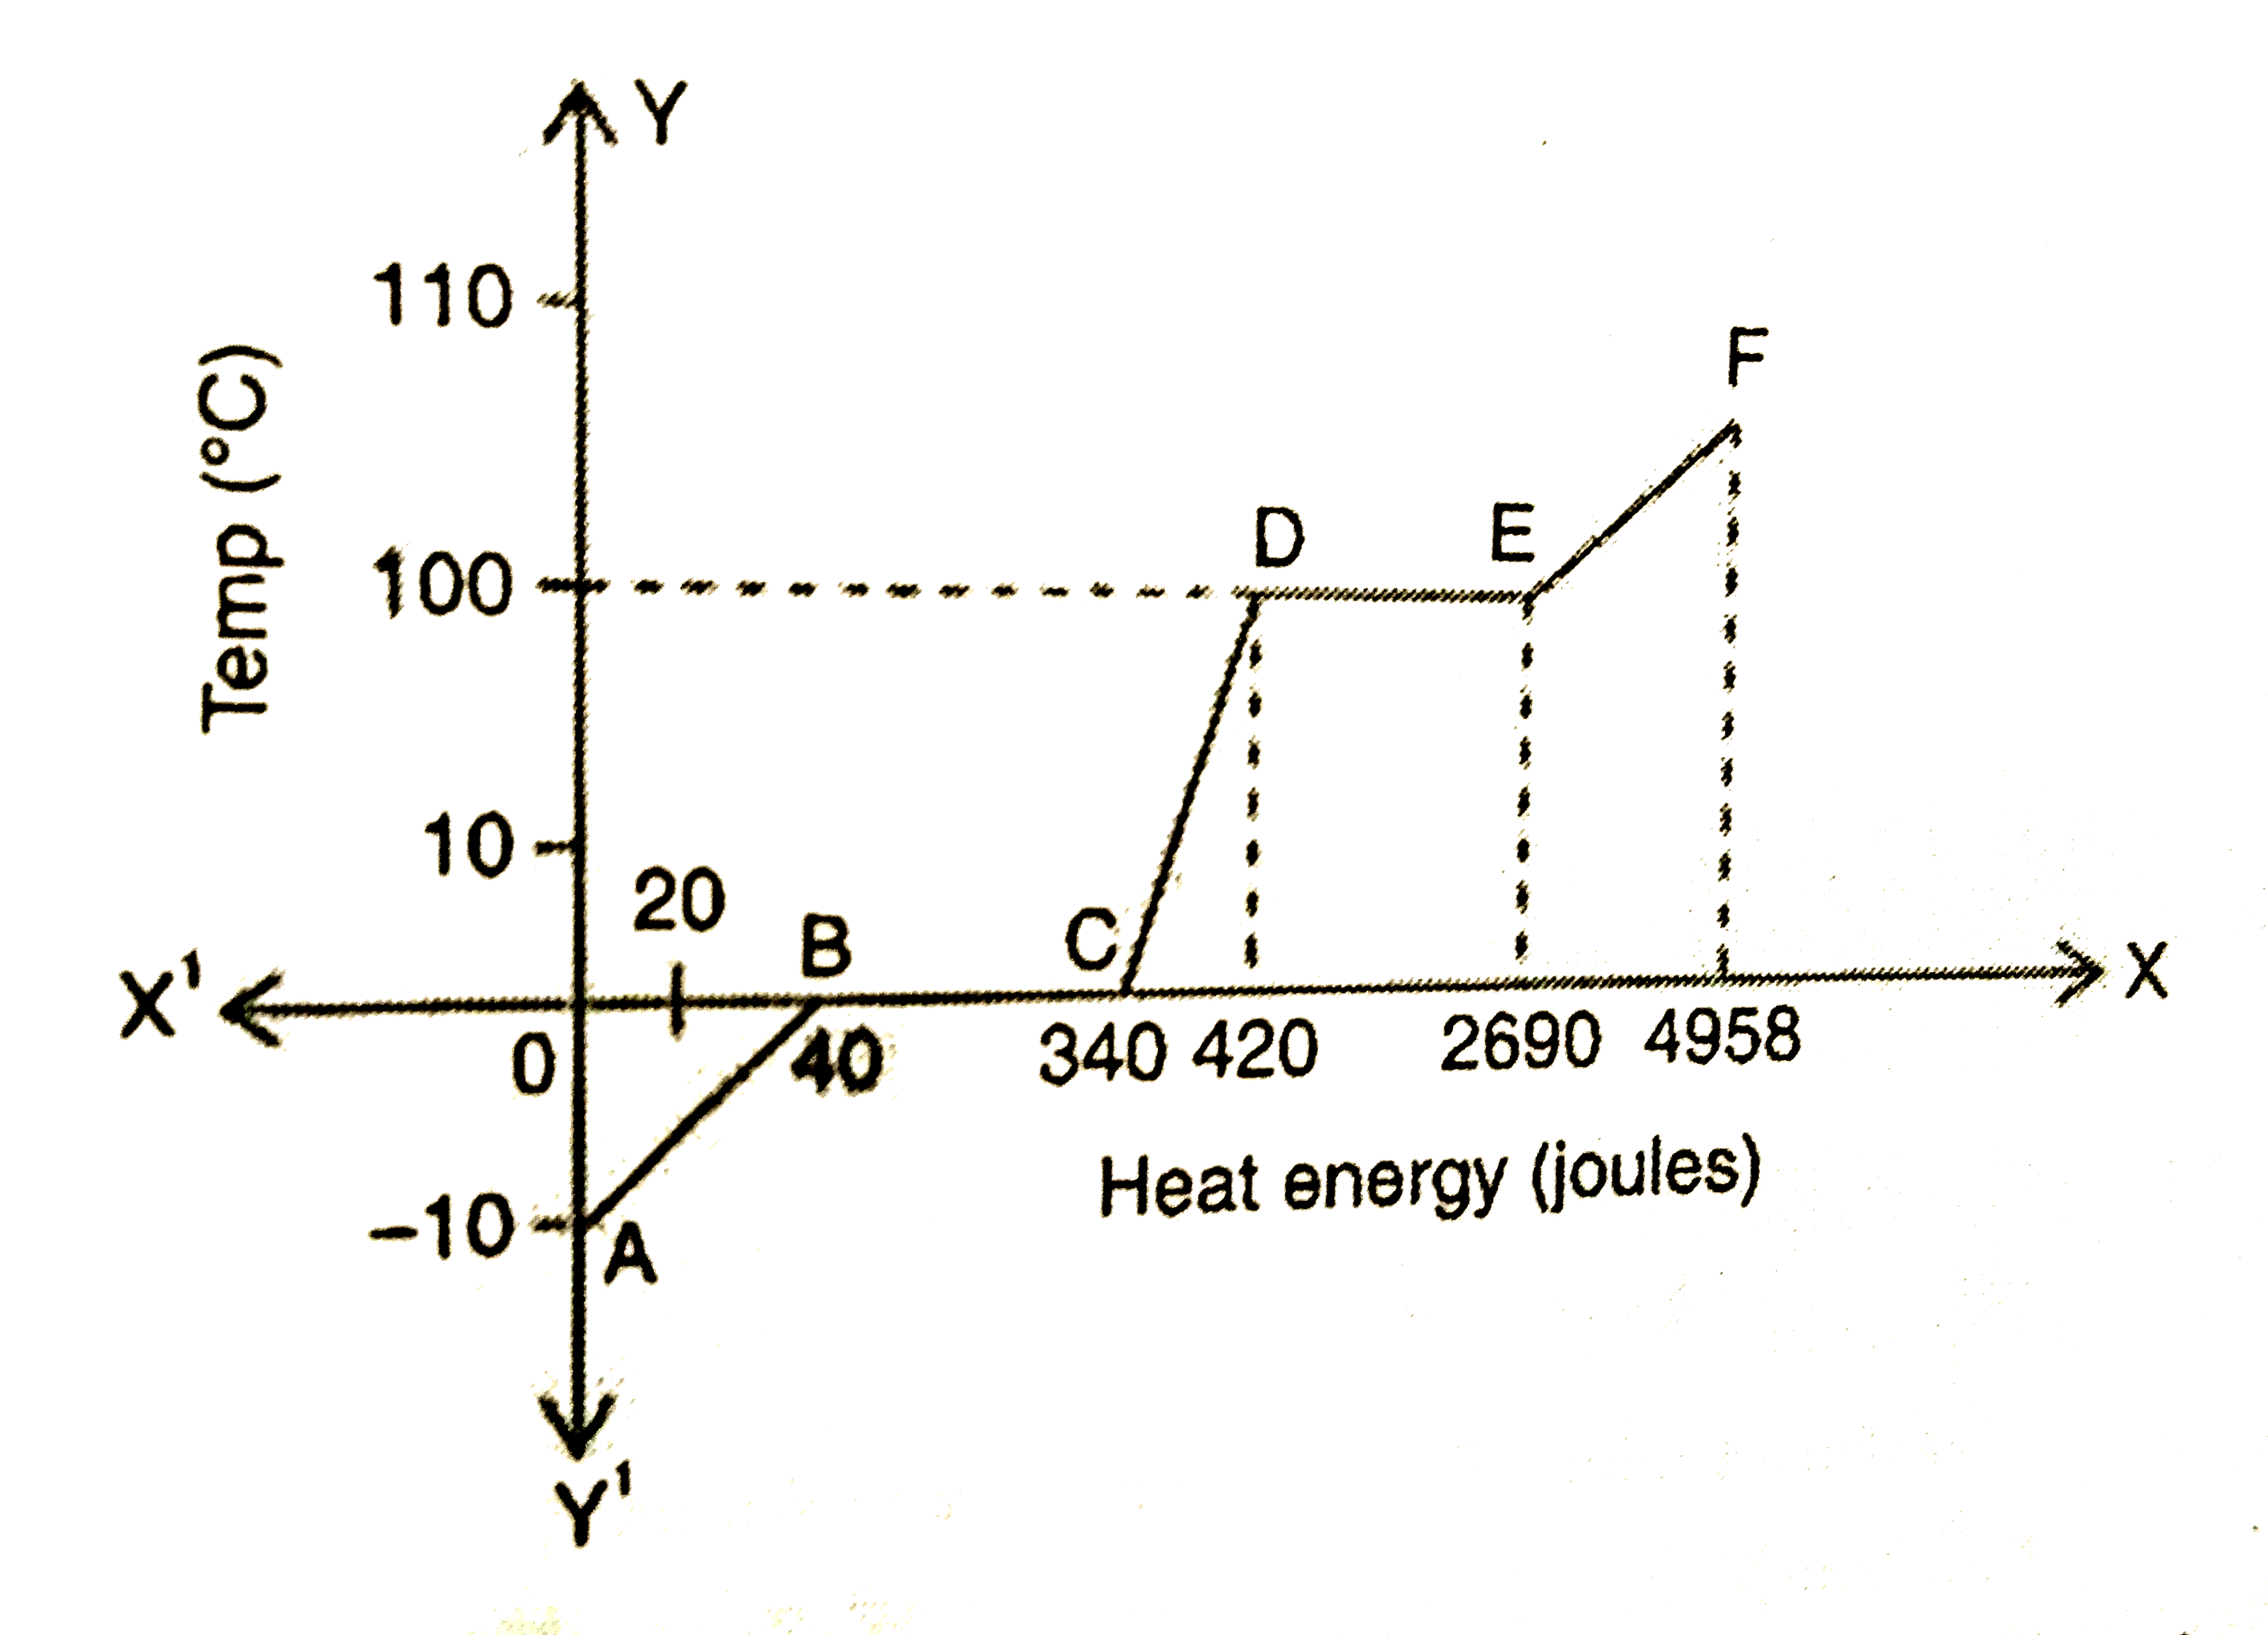
The change of state in the graph is represented by ________part.
View Solution

