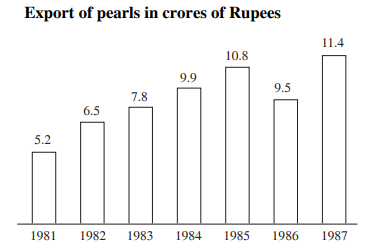
In which of the following pairs of years was the average export of pearls around Rs 9 crores? (a) 2002 and 2003 (b) 2003 and 2004 (c) 2004 and 2005 (d) 2005 and 2006
To solve the question, we need to find the average export of pearls for the given pairs of years and determine which pair has an average close to Rs 9 crores. Here’s a step-by-step solution:
Step 1: Identify the export values for each year
We will assume the following export values based on the video transcript:
- 2002: Rs 6.5 crores
- 2003: Rs 7.8 crores
- 2004: Rs 9.9 crores
- 2005: Rs 10.8 crores
- 2006: Rs 9.5 crores
Step 2: Calculate the average for each pair of years
Option (a): 2002 and 2003
- Export values: Rs 6.5 crores (2002) and Rs 7.8 crores (2003)
- Average = (6.5 + 7.8) / 2
- Average = 14.3 / 2 = Rs 7.15 crores
Option (b): 2003 and 2004
- Export values: Rs 7.8 crores (2003) and Rs 9.9 crores (2004)
- Average = (7.8 + 9.9) / 2
- Average = 17.7 / 2 = Rs 8.85 crores
Option (c): 2004 and 2005
- Export values: Rs 9.9 crores (2004) and Rs 10.8 crores (2005)
- Average = (9.9 + 10.8) / 2
- Average = 20.7 / 2 = Rs 10.35 crores
Option (d): 2005 and 2006
- Export values: Rs 10.8 crores (2005) and Rs 9.5 crores (2006)
- Average = (10.8 + 9.5) / 2
- Average = 20.3 / 2 = Rs 10.15 crores
Step 3: Compare the averages
- Option (a): Rs 7.15 crores
- Option (b): Rs 8.85 crores
- Option (c): Rs 10.35 crores
- Option (d): Rs 10.15 crores
Step 4: Determine which average is closest to Rs 9 crores
The average for option (b) is Rs 8.85 crores, which is the closest to Rs 9 crores when compared to the other options.
Final Answer
The correct answer is (b) 2003 and 2004.
---
We will assume the following export values based on the video transcript:
- 2002: Rs 6.5 crores
- 2003: Rs 7.8 crores
- 2004: Rs 9.9 crores
- 2005: Rs 10.8 crores
- 2006: Rs 9.5 crores
- Export values: Rs 6.5 crores (2002) and Rs 7.8 crores (2003)
- Average = (6.5 + 7.8) / 2
- Average = 14.3 / 2 = Rs 7.15 crores
- Export values: Rs 7.8 crores (2003) and Rs 9.9 crores (2004)
- Average = (7.8 + 9.9) / 2
- Average = 17.7 / 2 = Rs 8.85 crores
- Export values: Rs 9.9 crores (2004) and Rs 10.8 crores (2005)
- Average = (9.9 + 10.8) / 2
- Average = 20.7 / 2 = Rs 10.35 crores
- Export values: Rs 10.8 crores (2005) and Rs 9.5 crores (2006)
- Average = (10.8 + 9.5) / 2
- Average = 20.3 / 2 = Rs 10.15 crores
- Option (a): Rs 7.15 crores
- Option (b): Rs 8.85 crores
- Option (c): Rs 10.35 crores
- Option (d): Rs 10.15 crores
The average for option (b) is Rs 8.85 crores, which is the closest to Rs 9 crores when compared to the other options.
The correct answer is (b) 2003 and 2004.
Topper's Solved these Questions
Similar Questions
For which of the following pairs of years the total exports from the three companies together are equal? (a) 2005 and 2008 (b) 2006 and 2008 (c) 2007 and 2008 (d) 2005 and 2006 (d) 2003 and 2004
View SolutionIn which year was there maximum percentage increase in export of pearls to that in the previous year? (a) 2002 (b) 2007 (c) 2005 (d) 2004
View Solution
Knowledge Check
Study the following graph carefully and answer the questions given below it -----

In which of the following pairs of years was the average export of pearls around 9 crores ?A1982 and 1983B1983 and 1984C1984 and 1985D1985 and 1986Study the following graph carefully and answer the questions given below –

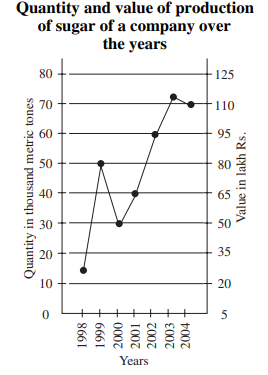
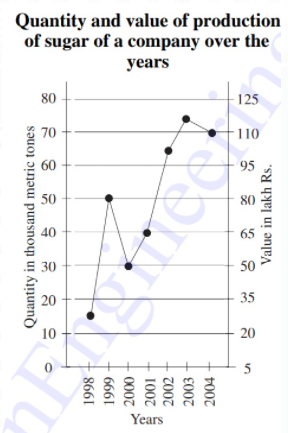
What was the difference between the average production of sugar during the average production of sugar during the year 1998, 1999, 2000 and 2001 and that of 2001, 2002, 2003 and 2004 in thousand metric tons?A15B20C25DNone of theseStudy the following graph carefully and answer the question given below-----

What was the difference between the average production of sugar during the years 1998,1999,2000 and 2001 and that of 2001,2002,2003 and 2004 in thousand metric tons ?A15B20C25DNone of these
In which year was the difference between the exports from Companies X and Y the minimum? (a) 2004 (b) 2005 (c) 2006 (d) 2007 (e) None of these
View SolutionStudy the following bar-graph carefully and answer the question:
The average export of pearls for the given period (in crores Rs) is
View Solution
In which year per cent unit cost in highest ? (a) 2006 (b) 2005 (c) 2009 (d) 2011
View SolutionThe maximum difference between the amount invested in raw materials and the value of sales of finished goods was during the year (a) 2005 (b) 2006 (c) 2007 (d) 2008 (e) 2009
View SolutionLet x and y are distinct numbers such that 2005+x=y2 and 2005+y=x2. The product xy is: (a) -2004 (b) 2004 (c) 2005 (d) -2006
View Solution
