Directions (Questions 16-20): Study the following graph carefully and answer the questions given below: Total Number of Students Appeared and Qualified from Various Schools at a Scholarship Exam (FIGURE) The average number of students qualified in the examination from Schools C and D is what percent of the average number of students appeared for the examination from the same schools? (rounded off to 2 digits after decimal) (a) 58.62 (b) 73.91 (c) 62.58 (d) 58.96 (e) None of these
Step by step video & image solution for Directions (Questions 16-20): Study the following graph carefully and answer the questions given below: Total Number of Students Appeared and Qualified from Various Schools at a Scholarship Exam (FIGURE) The average number of students qualified in the examination from Schools C and D is what percent of the average number of students appeared for the examination from the same schools? (rounded off to 2 digits after decimal) (a) 58.62 (b) 73.91 (c) 62.58 (d) 58.96 (e) None of these by Maths experts to help you in doubts & scoring excellent marks in Class 14 exams.
Updated on:21/07/2023Topper's Solved these Questions
Similar Questions
The number of students appeared for the scholarship exam from School D is approximately what percent of the total number of students appeared for the exam from all the schools together? (a) 12 (b) 24 (c) 29 (d) 18 (e) 8
View Solution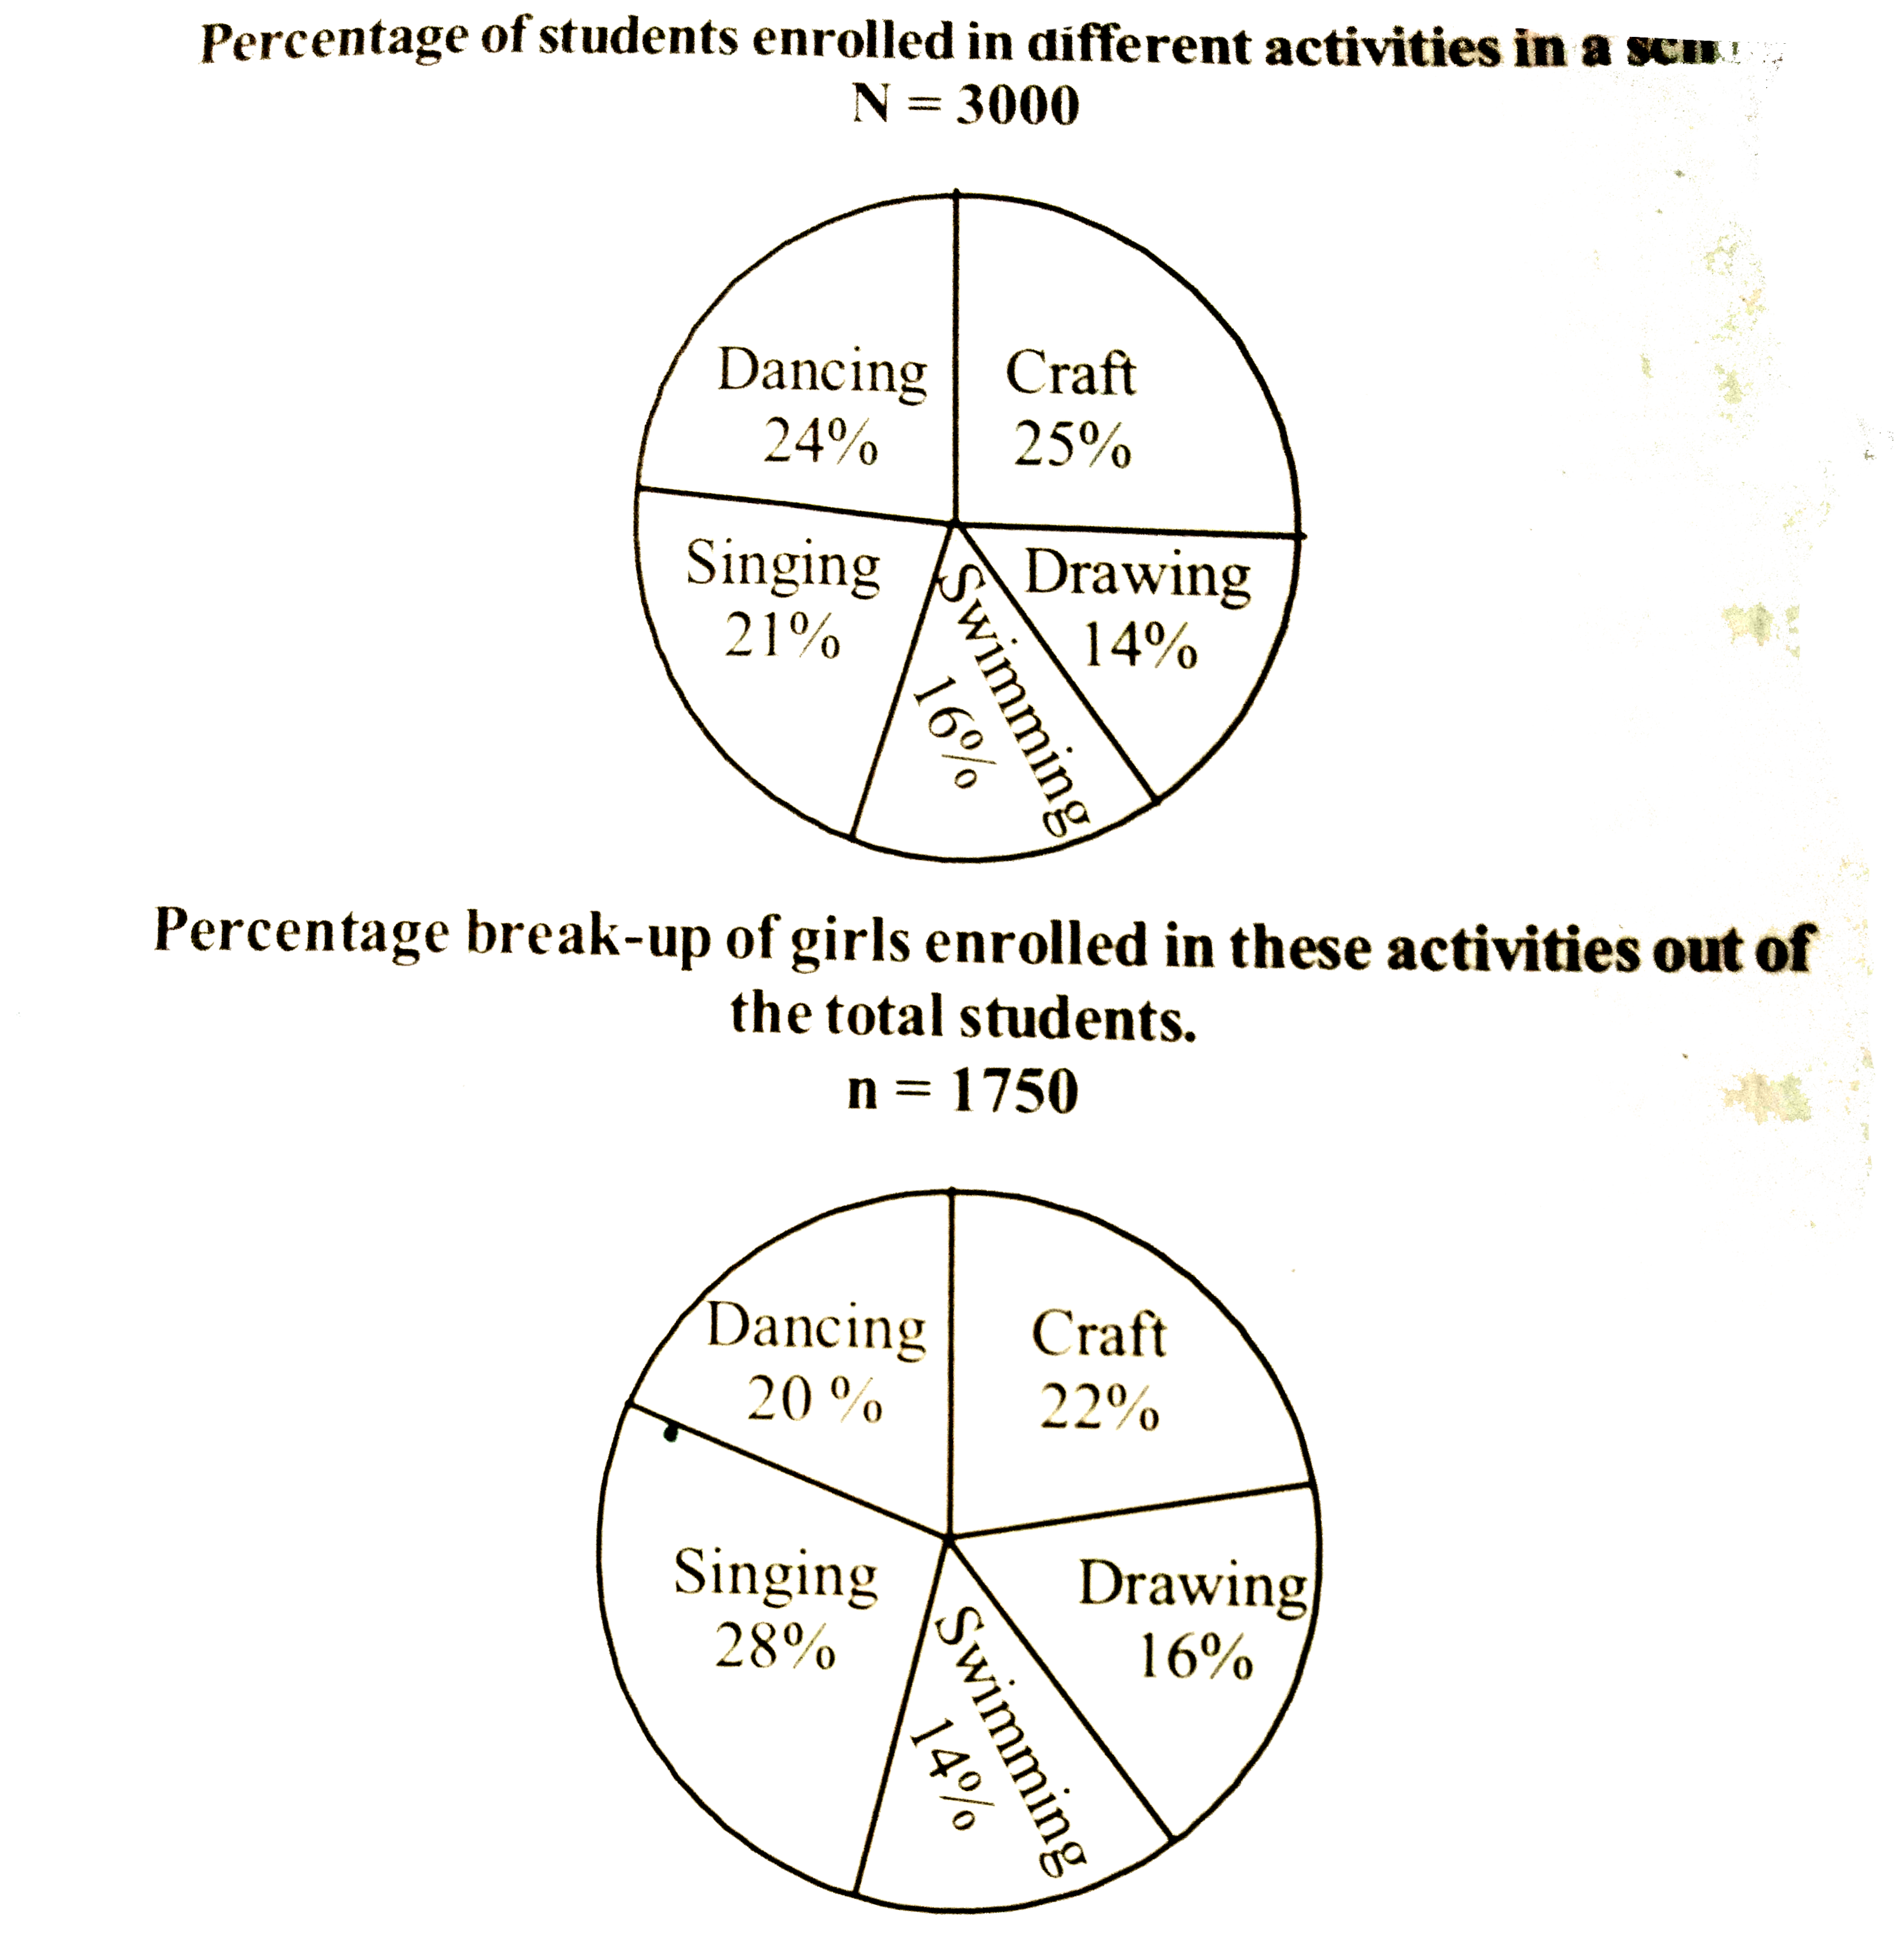
Number of girls enrolled in Dancing from what per cent of total number of students in the school ? (rounded off to two digits after decimal)
View Solution
Knowledge Check
Study the following table carefully to answer these questions ---
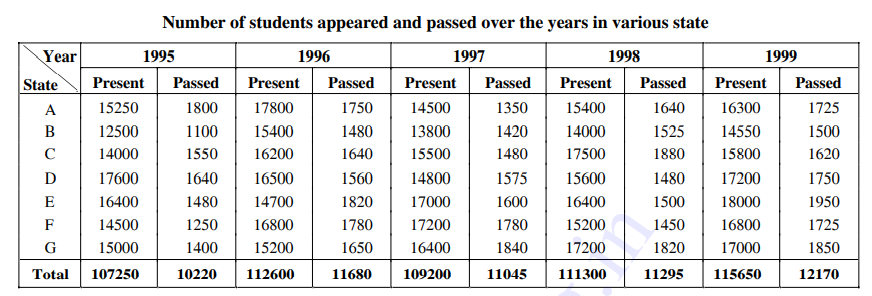
What is the average number of students appeared in B for all years ?A15850B14550C15050DNone of theseStudy the following graph carefully and answer the questions that follow
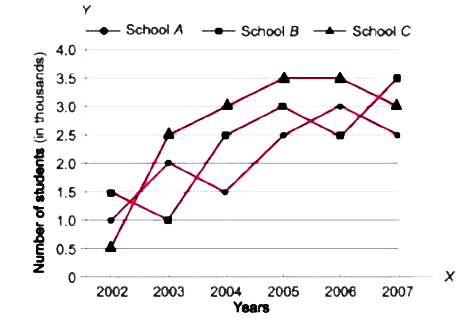
What was the average number of students in all schools together in the year 2006 ?A30000B9000C3000D6000Read the following table carefully and answer the questions given below.

If the number of students appeared from school C in each year is 4800, what is the average number of passed students from school C in all the years ?A2608B2618C2816D2728
Read the bar graph carefully and answer the following questions.
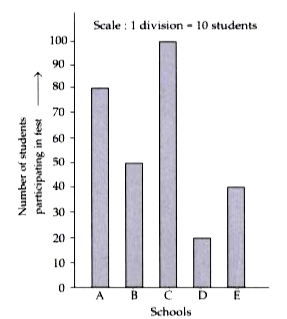 From which school maximum number of students participated ?
View SolutionWhat is the ratio of the number of students qualified in the scholarship examination from School A and the number of students qualified in the examination from School B ? (a) 8 : 3 (b) 5 : 7 (c) 7 : 3 (d) 7 : 5 (e) None of these
View SolutionNumber of students from various school playing various games is given in following table
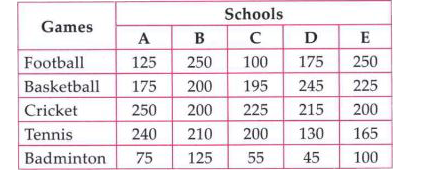
The number of students playing football from school D is what per cent of the total number of students playing all the given games from the school D ? (Round off to 2 digits after decimal )
View SolutionStudy the following graph and answer the questions given below it.
Number of Students from Various Faculties Studying in Various Colleges (Number in Thousands)
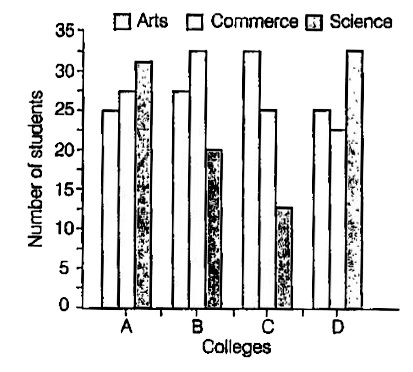
What is the average number of students from the faculty of Arts from all the colleges together ?
View SolutionStudy the following graph and answer the questions given below it.
Number of Students from Various Faculties Studying in Various Colleges (Number in Thousands)
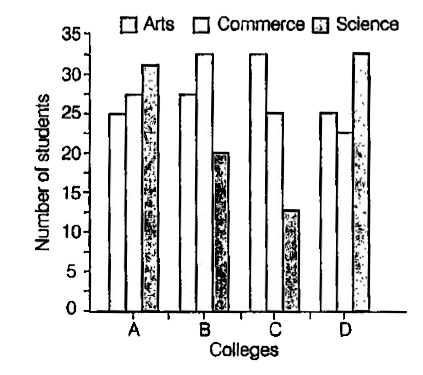
What is the average number of students studying in college A from all the faculties together ?
View Solution
