Directions (Questions 11-15): Study the following bar graph and the table carefully and answer the questions given below: Time Taken (in Hours) by 6 Vehicles on Two Different Days (FIGURE) Distance Covered (in km) by 6 Vehicles on Each day (FIGURE) Which of the following vehicles travelled at the same speed on both the days? A (b) C (c) F (d) B (e) None of these
Step by step video & image solution for Directions (Questions 11-15): Study the following bar graph and the table carefully and answer the questions given below: Time Taken (in Hours) by 6 Vehicles on Two Different Days (FIGURE) Distance Covered (in km) by 6 Vehicles on Each day (FIGURE) Which of the following vehicles travelled at the same speed on both the days? A (b) C (c) F (d) B (e) None of these by Maths experts to help you in doubts & scoring excellent marks in Class 14 exams.
Updated on:21/07/2023Topper's Solved these Questions
Similar Questions
Direction: Read the following table carefully and answer the questions given below: The given table shows the number of boys and girls in 5 different school:
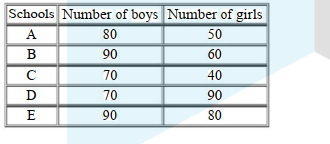
Find the average number of girls in schools B,C, and E
View SolutionDirection: Read the following table carefully and answer the questions given below:- The given the table is showing the number of students in different school:-
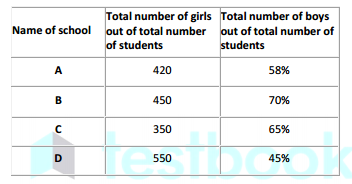
Find the average number of girls in schools B, C, and D.
View Solution
Knowledge Check
Study the following table carefully and answer the questions given below :
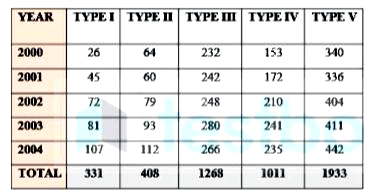
The percentage increase in sales in 2003 over the previous year was maximum for which Type of vehiclesAType IIBType ICType IIIDType VStudy the following graph carefully and answer the questions given below
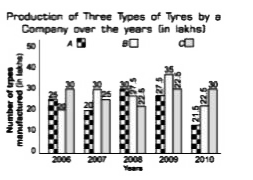
In which of the following years, was the percentage production of B type to C type the maximum?A2008B2009C2010D2007Study the following table carefully and answer the questions given below:
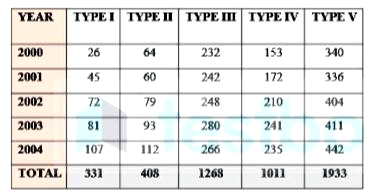
In which of the following years was the Sales of Type II vehicles approximated 25% of the Type V vehicles?A2000B2002C2004D2003
Study the following graph carefully and answer the question given below it.
Production and sale of printers of various companies in a month.
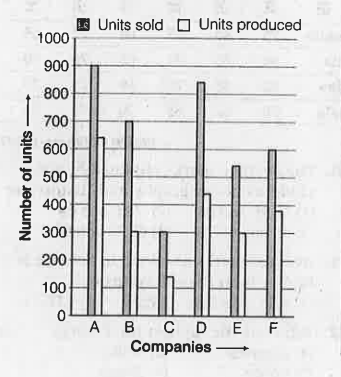
The total produced by the companies A B and C together is
View SolutionStudy the following information carefully and answer the questions given below:
* D is the mother of E, who is the sister of F.
* A is the father of C. B is wife of A.
* F is son of C.
How is B related to D?
View SolutionStudy the following information carefully and answer the questions given below:
* D is the mother of E, who is the sister of F.
* A is the father of C. B is wife of A.
* F is son of C.
How is E related to A?
View SolutionStudy the following table carefully and answer the questions given below:
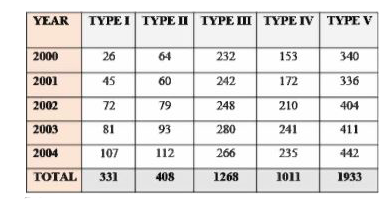
If the same percentage increase in the sales of Type I vehicles in 2004 over 2003 is expected in 2005, approximatdy how many Type I vehicles will be sold in 2005?
View SolutionStudy the following figure and answer the questions given below.
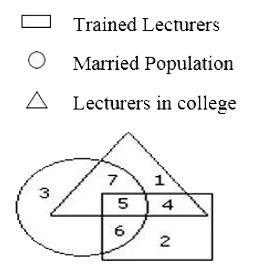
By which number, the trained unmarried lecturers in the college are represented?
A. 6
B. 5
C. 7
D. 4
View Solution
