Directions (Questions 27-31): Out of the bar graphs given below, one shows the amount (in lakh Rs) invested by a company in purchasing raw materials over the years and the other shows the value (in lakh Rs) of finished goods sold by the company over the years. Study the bar graph and answer the questions based on them. Amount Invested In Raw Materials (in Lakh Rs) (FIGURE) In which years, there is maximum percentage increase in the amount invested in raw materials as compared to the previous year (a) 2006 (b) 2007 (c) 2008 (d) 2009 (e) 2010
Step by step video & image solution for Directions (Questions 27-31): Out of the bar graphs given below, one shows the amount (in lakh Rs) invested by a company in purchasing raw materials over the years and the other shows the value (in lakh Rs) of finished goods sold by the company over the years. Study the bar graph and answer the questions based on them. Amount Invested In Raw Materials (in Lakh Rs) (FIGURE) In which years, there is maximum percentage increase in the amount invested in raw materials as compared to the previous year (a) 2006 (b) 2007 (c) 2008 (d) 2009 (e) 2010 by Maths experts to help you in doubts & scoring excellent marks in Class 14 exams.
Updated on:21/07/2023Topper's Solved these Questions
Similar Questions
Out of the bar graphs provided below one shows the amount invested a company in purchasing raw material over the year and the other shows the values of finished goods sold by the company over the years
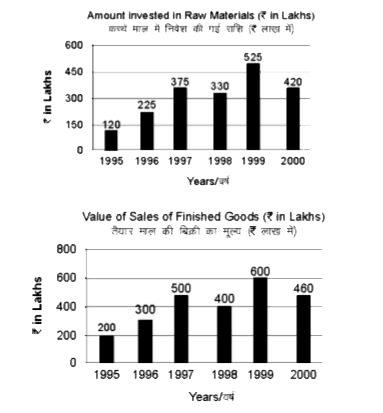
what was the difference between the average amount invested in raw materials during 1997 to 2000 and the average value of sales of finished goods during the same period 1997 to 2000
View SolutionThe bar graph given below shows the data of the production of paper (in lakh tonnes) by three different companies P, Q and R over the years.
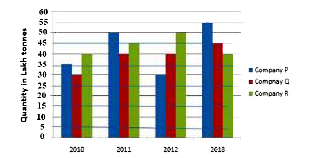
What is the percentage increase in the productionby company Q from 2010 to 2013?
View Solution
Knowledge Check
Study the following graph and answer the given questions
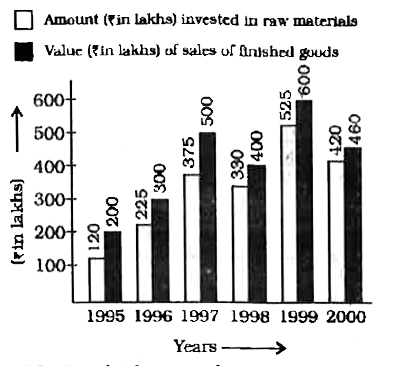
In which year, there has been a maximum percentage increase in the amount invested in raw materials as compared to the previous year ?A1996B1997C1998D1999The given bar graph shows the biscuit exports of India over a period of five years. Study the graph and answer the questions that follows
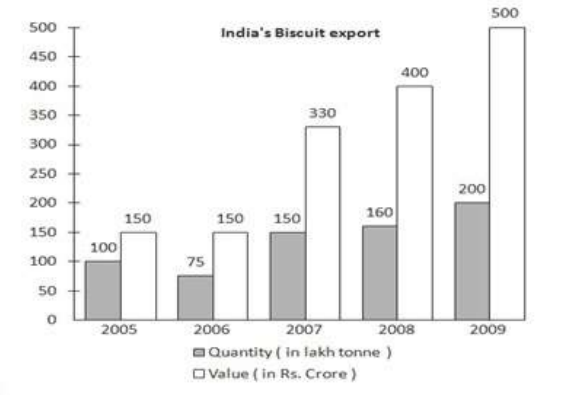
In which two year was the value per tonne equal?A2006 and 2007B2008 and 2009C2007 and 2008D2005 and 2006The pie chart shows the breakup of expenditure of a software company for the year 2017. Study the diagram and answer the following questions.
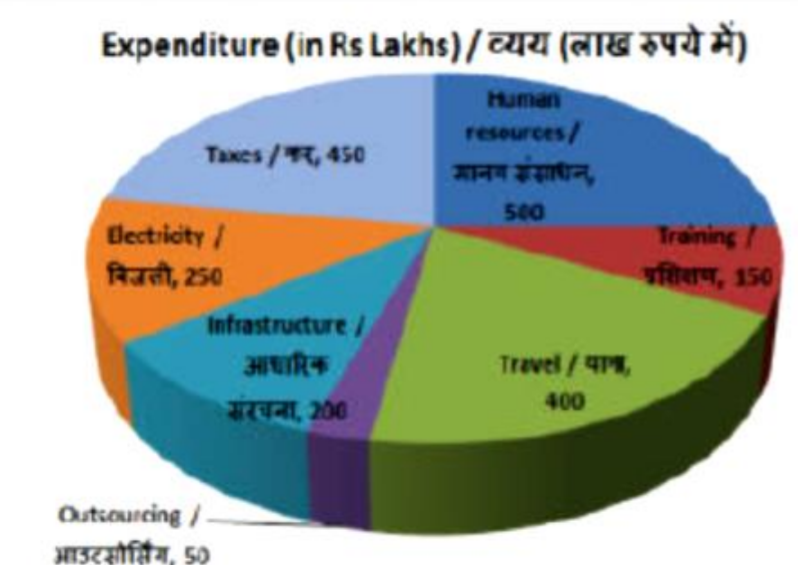
What is the total expenditure (in Rs lakhs)?A2000B1800C2250D2100
The pie chart shows the breakup of expendoture of a software company for the year 2017. Study the diagram and answer the following questions.
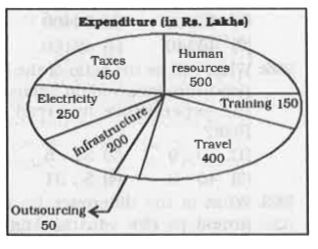
What is the total expenditure (in Rs. lakhs)?
View SolutionThe pie chart shows the breakup of expenditure of a mining company for the year 2017. Study the diagram and answer the following questions.
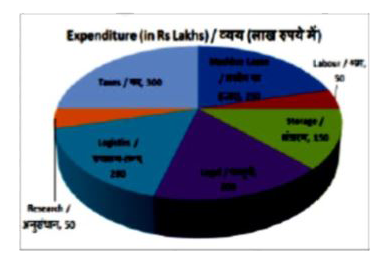
What is the total expenditure (in Rs lakhs)?
View SolutionThe pie chart shows the breakup of expenditure of a manufacturing company for the year 2017. Study the diagram and answer the following questions.
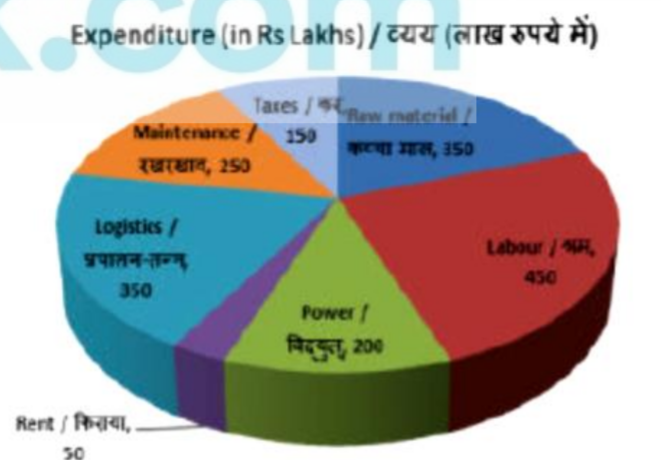
What is the total expenditure (in Rs lakhs)?
View SolutionThe pie chart shows the breakup of expendoture of a manufacturing company for the year 2017. Study the diagram and answer the following questions.
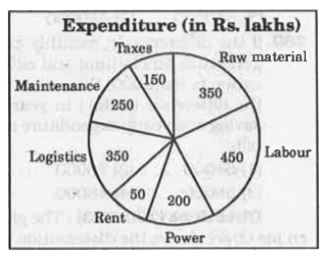
What is the total expenditure (in Rs. lakhs)?
View SolutionThe pie chart shows the break up of expenditure of a trading company for the year 2017. Study the diagram and answer th following questions.
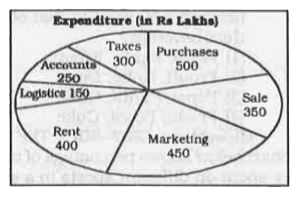
What is the total expenditure (in Rs. lakhs) ?
View Solution
