The value of sales of finished goods in 2009 was approximately what percent of the average amount invested in raw materials in the years 2007, 2008 and 2009? (a) 33% (b) 37% (c) 45% (d) 49% (e) 53%
Step by step video & image solution for The value of sales of finished goods in 2009 was approximately what percent of the average amount invested in raw materials in the years 2007, 2008 and 2009? (a) 33% (b) 37% (c) 45% (d) 49% (e) 53% by Maths experts to help you in doubts & scoring excellent marks in Class 14 exams.
Topper's Solved these Questions
Similar Questions
The sales of Company A in the year 2009 was approximately what percent of its production in the same year? (a) 65% (b) 73% (c) 79% (d) 83% (e) 69%
View SolutionThe semester fee charged for M.Phil. course in the year 2008 was approximately what percentage of the semester fee charged for M.Sc. course in the year 2009? (a) 67 (b) 84 (c) 80 (d) 76 (e) 72
View Solution
Knowledge Check
- Question 1 - Select One
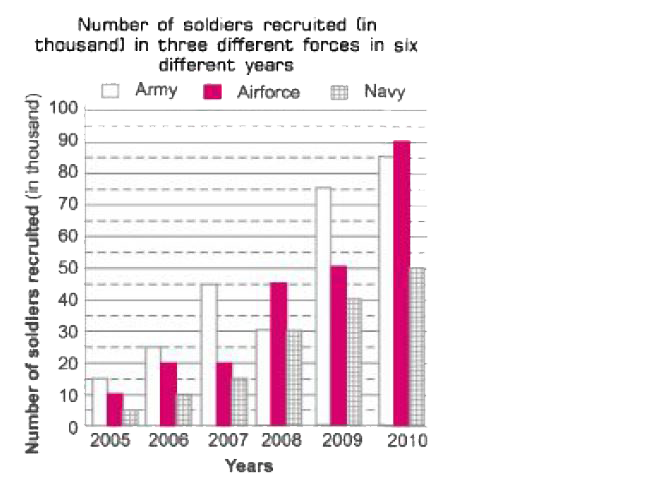
Number of soldiers recruited in navy in the year 2009 was what percentage of number of soldiers recruited in army in the year 2006?
 A140B150C160D180
 - Question 2 - Select One
What approximate value will come in place of question mark (?) in the given equations?
20 × 52/260 × 45% of 360 = ?A530B810C256D648
What is the percentage increase in the production of Company Y from 2006 to 2009? (a) 30% (b) 45% (c) 50% (d) 60% (e) 75%
View SolutionTotal number of girls enrolled in all the three schools in the year 2008 was what percentage of the number of girls enrolled in School C in the year 2011? (a) 44.4% (b) 225% (c) 165% (d) 240% (e) None of these
View SolutionThe distance travelled by vehicle F on Day 2 was approximately what per cent of the distance travelled by it on Day 1? (a) 80% (b) 65% (c) 85% (d) 95% (e) 90%
View SolutionFor a sphere of radius 10 cm, what percent of the numerical value of its volume would be the numerical value of the surface area? (a) 24% (b) 26.5% (c) 30% (d) 45%
View SolutionThe maximum difference between the amount invested in raw materials and the value of sales of finished goods was during the year (a) 2005 (b) 2006 (c) 2007 (d) 2008 (e) 2009
View SolutionDirections (Questions 27-31): Out of the bar graphs given below, one shows the amount (in lakh Rs) invested by a company in purchasing raw materials over the years and the other shows the value (in lakh Rs) of finished goods sold by the company over the years. Study the bar graph and answer the questions based on them. Amount Invested In Raw Materials (in Lakh Rs) (FIGURE) In which years, there is maximum percentage increase in the amount invested in raw materials as compared to the previous year (a) 2006 (b) 2007 (c) 2008 (d) 2009 (e) 2010
View Solution

