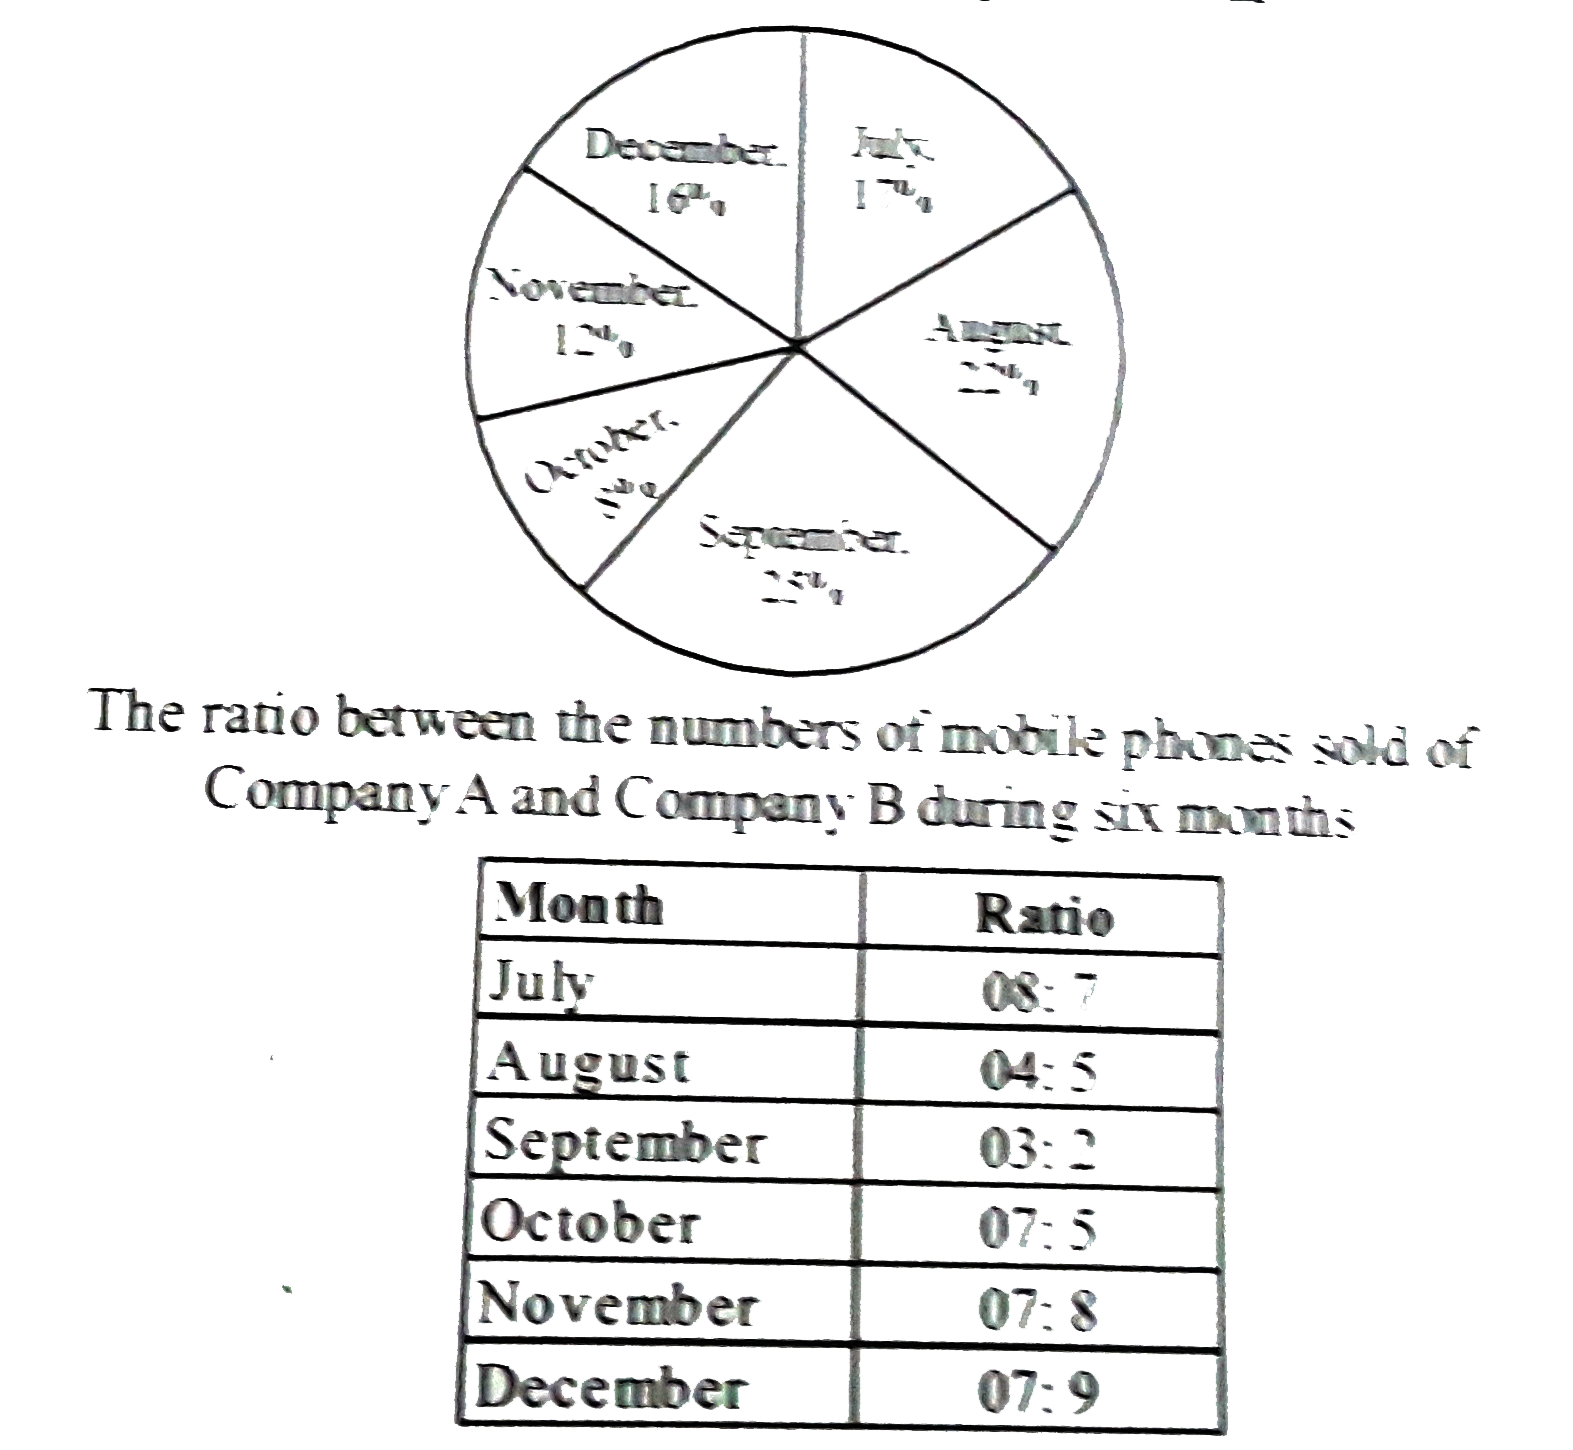
(Questions 5-9): Study the following pie-chart and table carefully and answer the questions given below: Percentage-wise Distribution of the Number of Mobile Phones Sold by a Shopkeeper During Six Months (FIGURE) What is the ratio of the number of mobile phones sold of Company B during July to those sold during December of the same company? (a) 119:145 (b) 116:135 (c) 119:135 (d) 119:130 (e) None of these
Step by step video & image solution for (Questions 5-9): Study the following pie-chart and table carefully and answer the questions given below: Percentage-wise Distribution of the Number of Mobile Phones Sold by a Shopkeeper During Six Months (FIGURE) What is the ratio of the number of mobile phones sold of Company B during July to those sold during December of the same company? (a) 119:145 (b) 116:135 (c) 119:135 (d) 119:130 (e) None of these by Maths experts to help you in doubts & scoring excellent marks in Class 14 exams.
Updated on:21/07/2023Topper's Solved these Questions
Similar Questions
Percentage -wise disribution of the number of mobile phones sold by a shopkeeper during six months
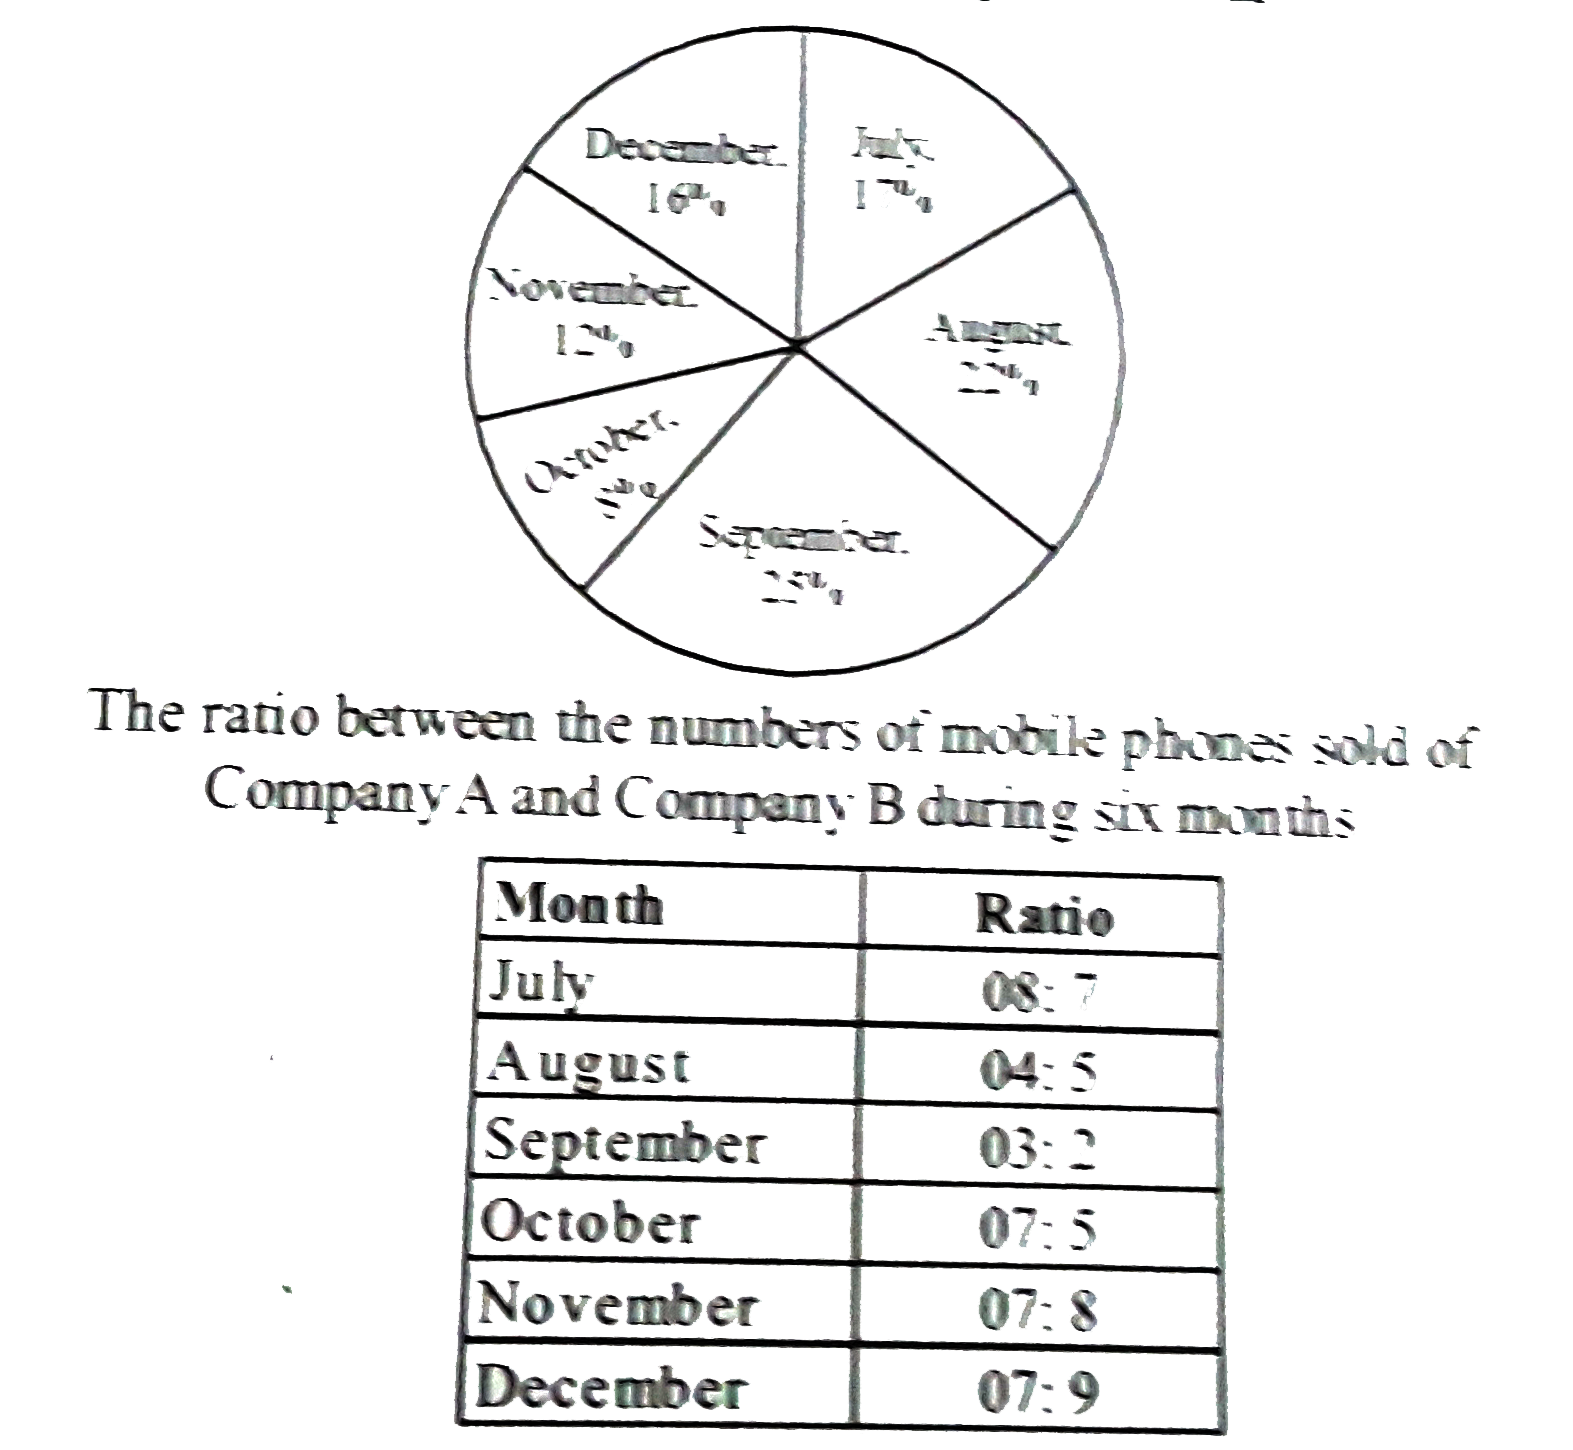
What is the ratio of the number of mobile phones sold of company B during July to those sold during December of the same company ?
View Solution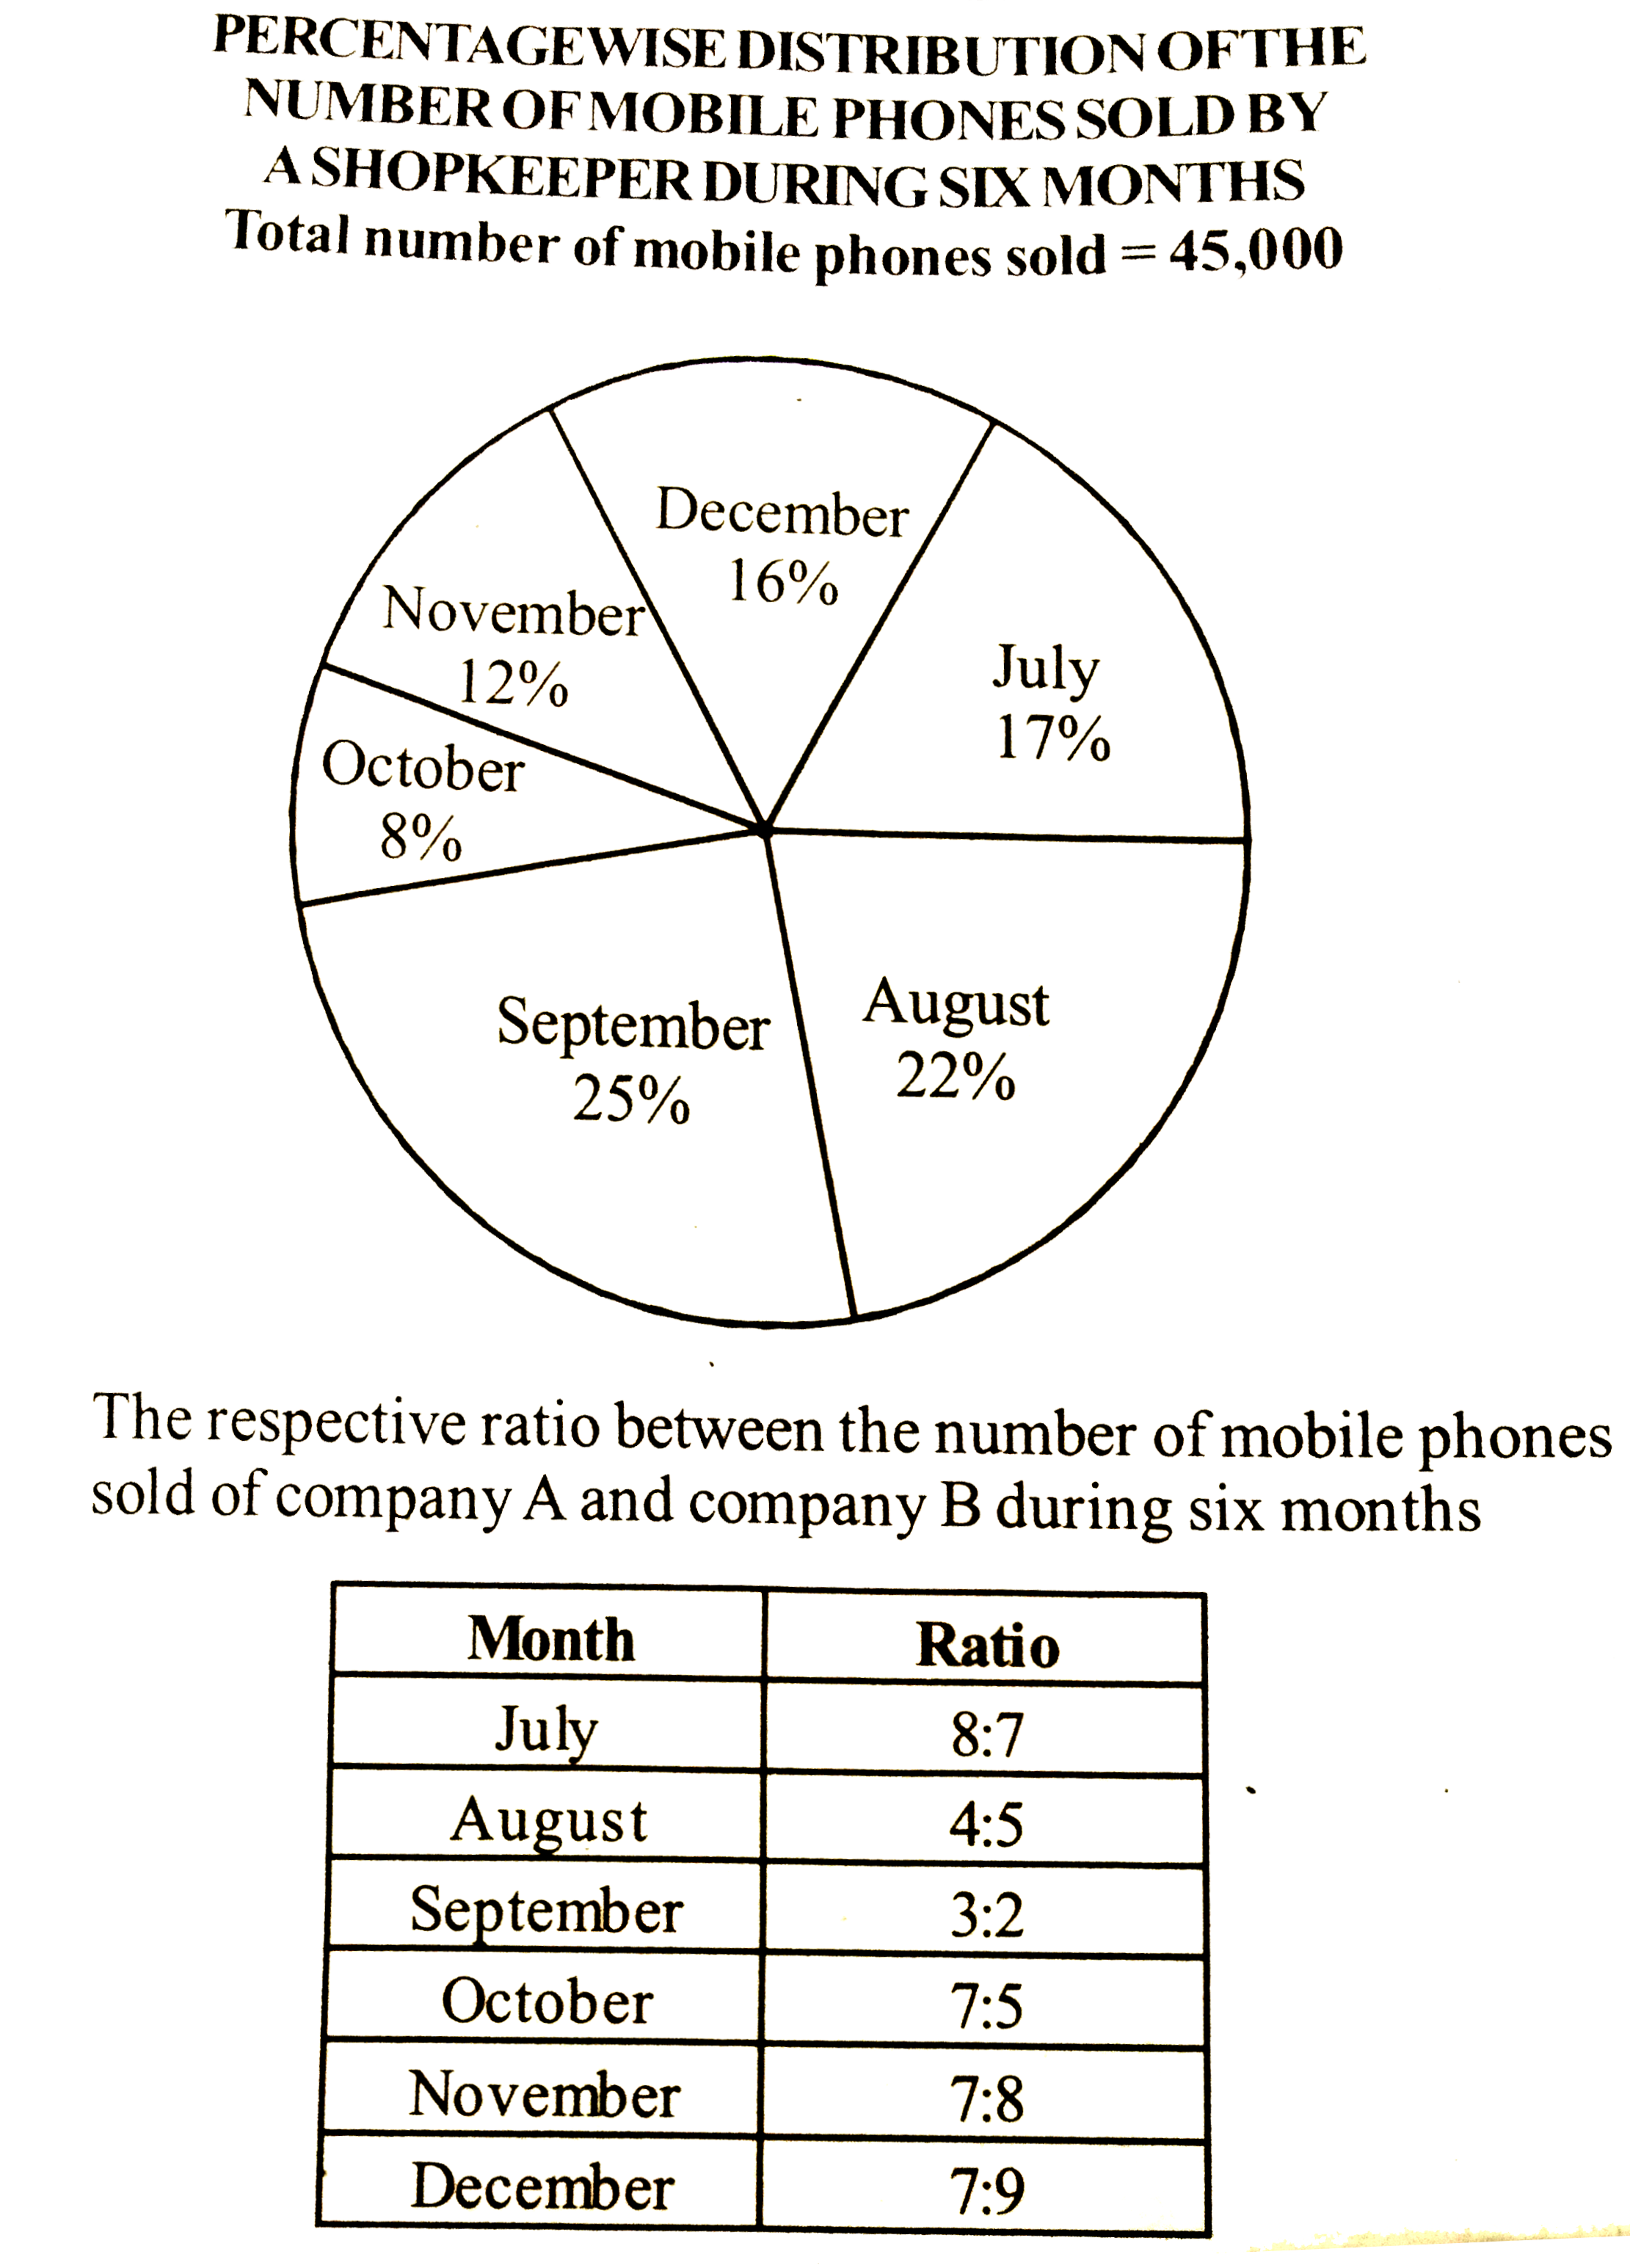
What is the respective ratio between the number of mobile phones sold of company B during July and thoses sold during December of the same company ?
View Solution
Knowledge Check
Study the following graph carefully to answer the questions given below.
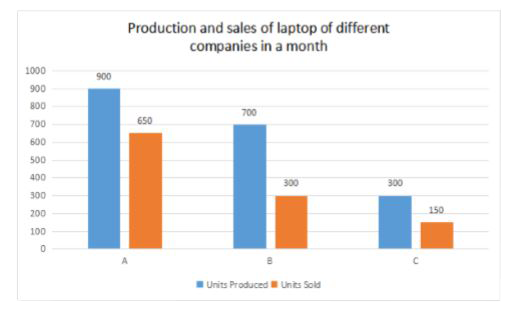
What is the average number of Units of laptop sold by all the Companies together?A41023B39123C36613D36623
Percentage -wise disribution of the number of mobile phones sold by a shopkeeper during six months
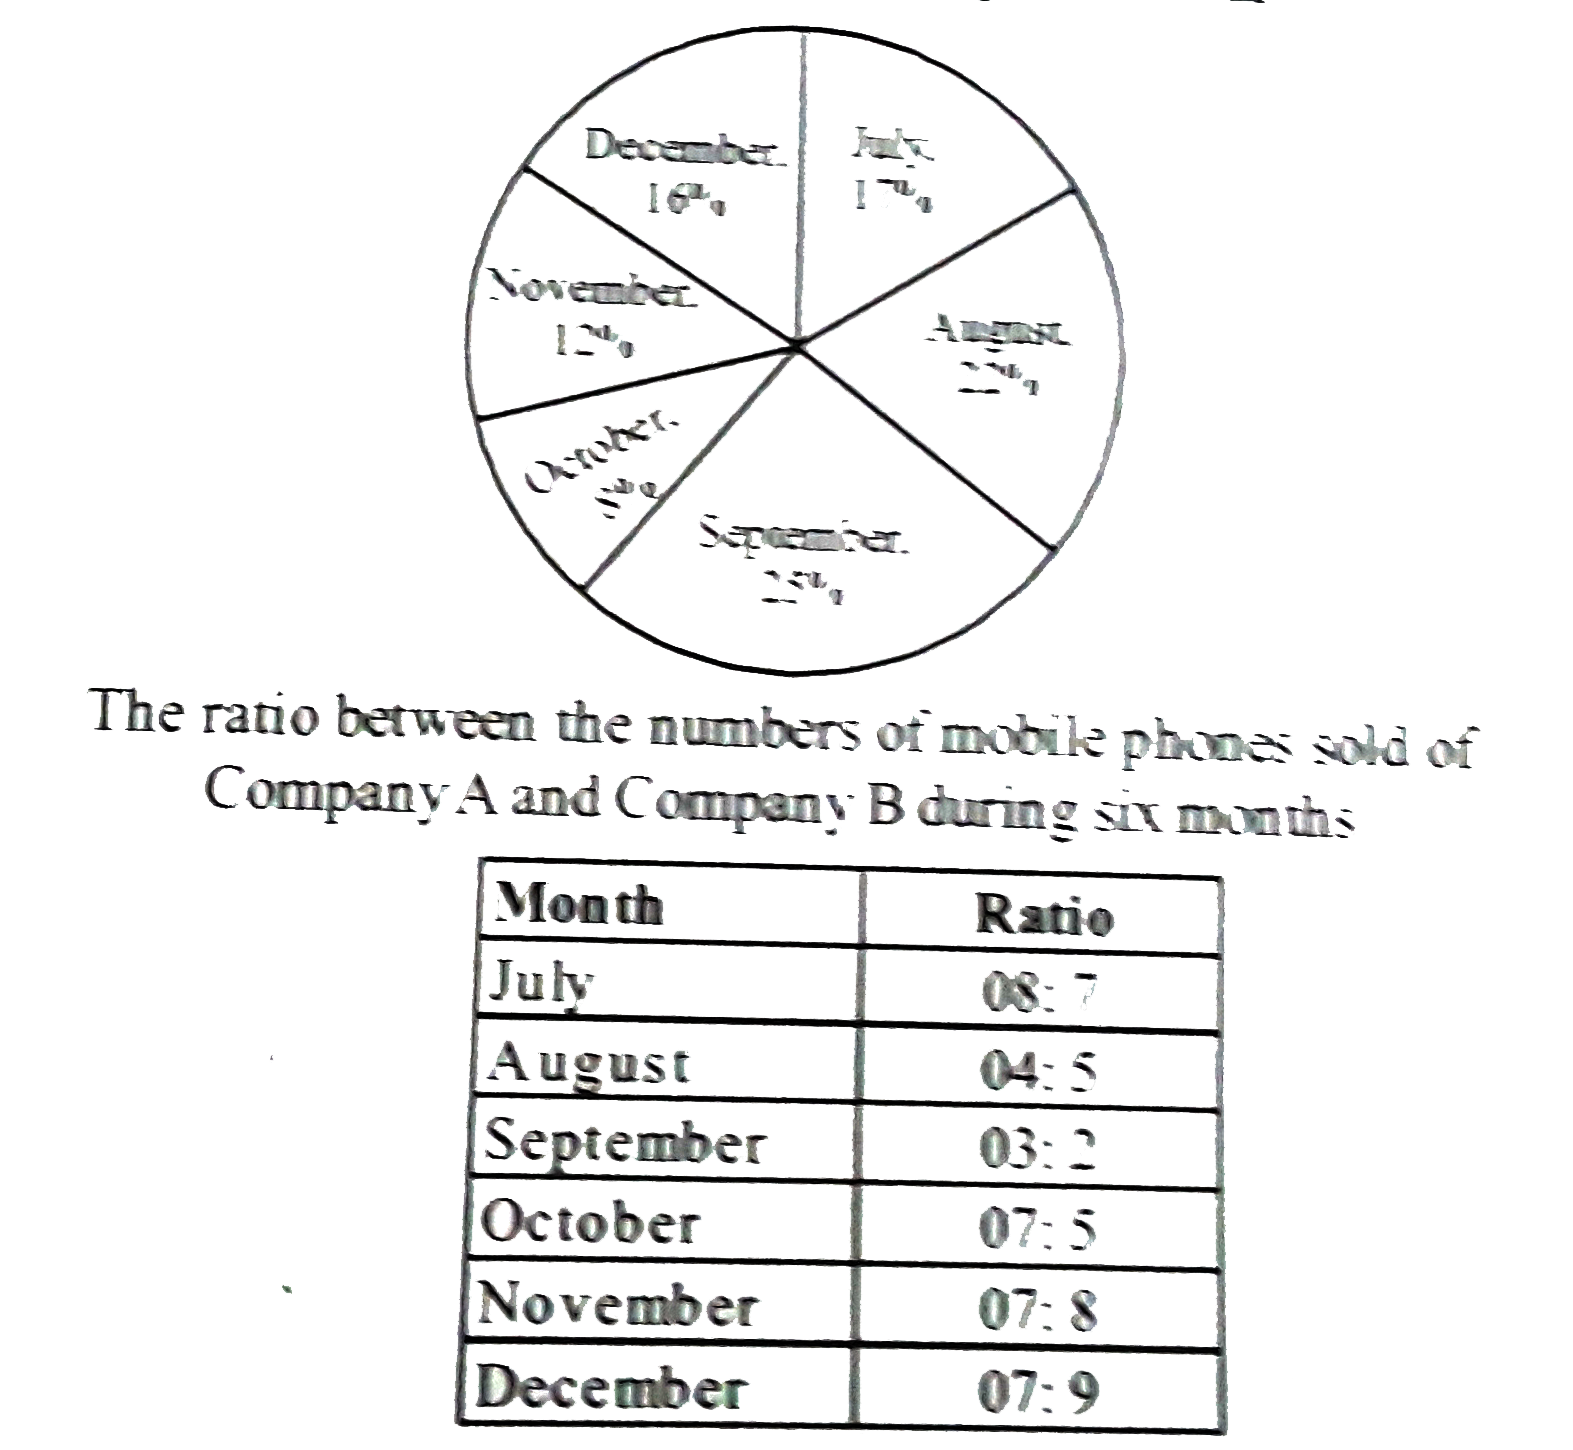
What is the total number of mobile phones sold of Company B During August and September together ?
View Solution
What is the total number of mobile phones sold of company B during Agust and September together ?
View SolutionPercentage -wise disribution of the number of mobile phones sold by a shopkeeper during six months
If 35% of the mobile phones sold by Company A during November were sold A at a discount, how many mobile phones of Company A during that month wre sold without a discount ?
View Solution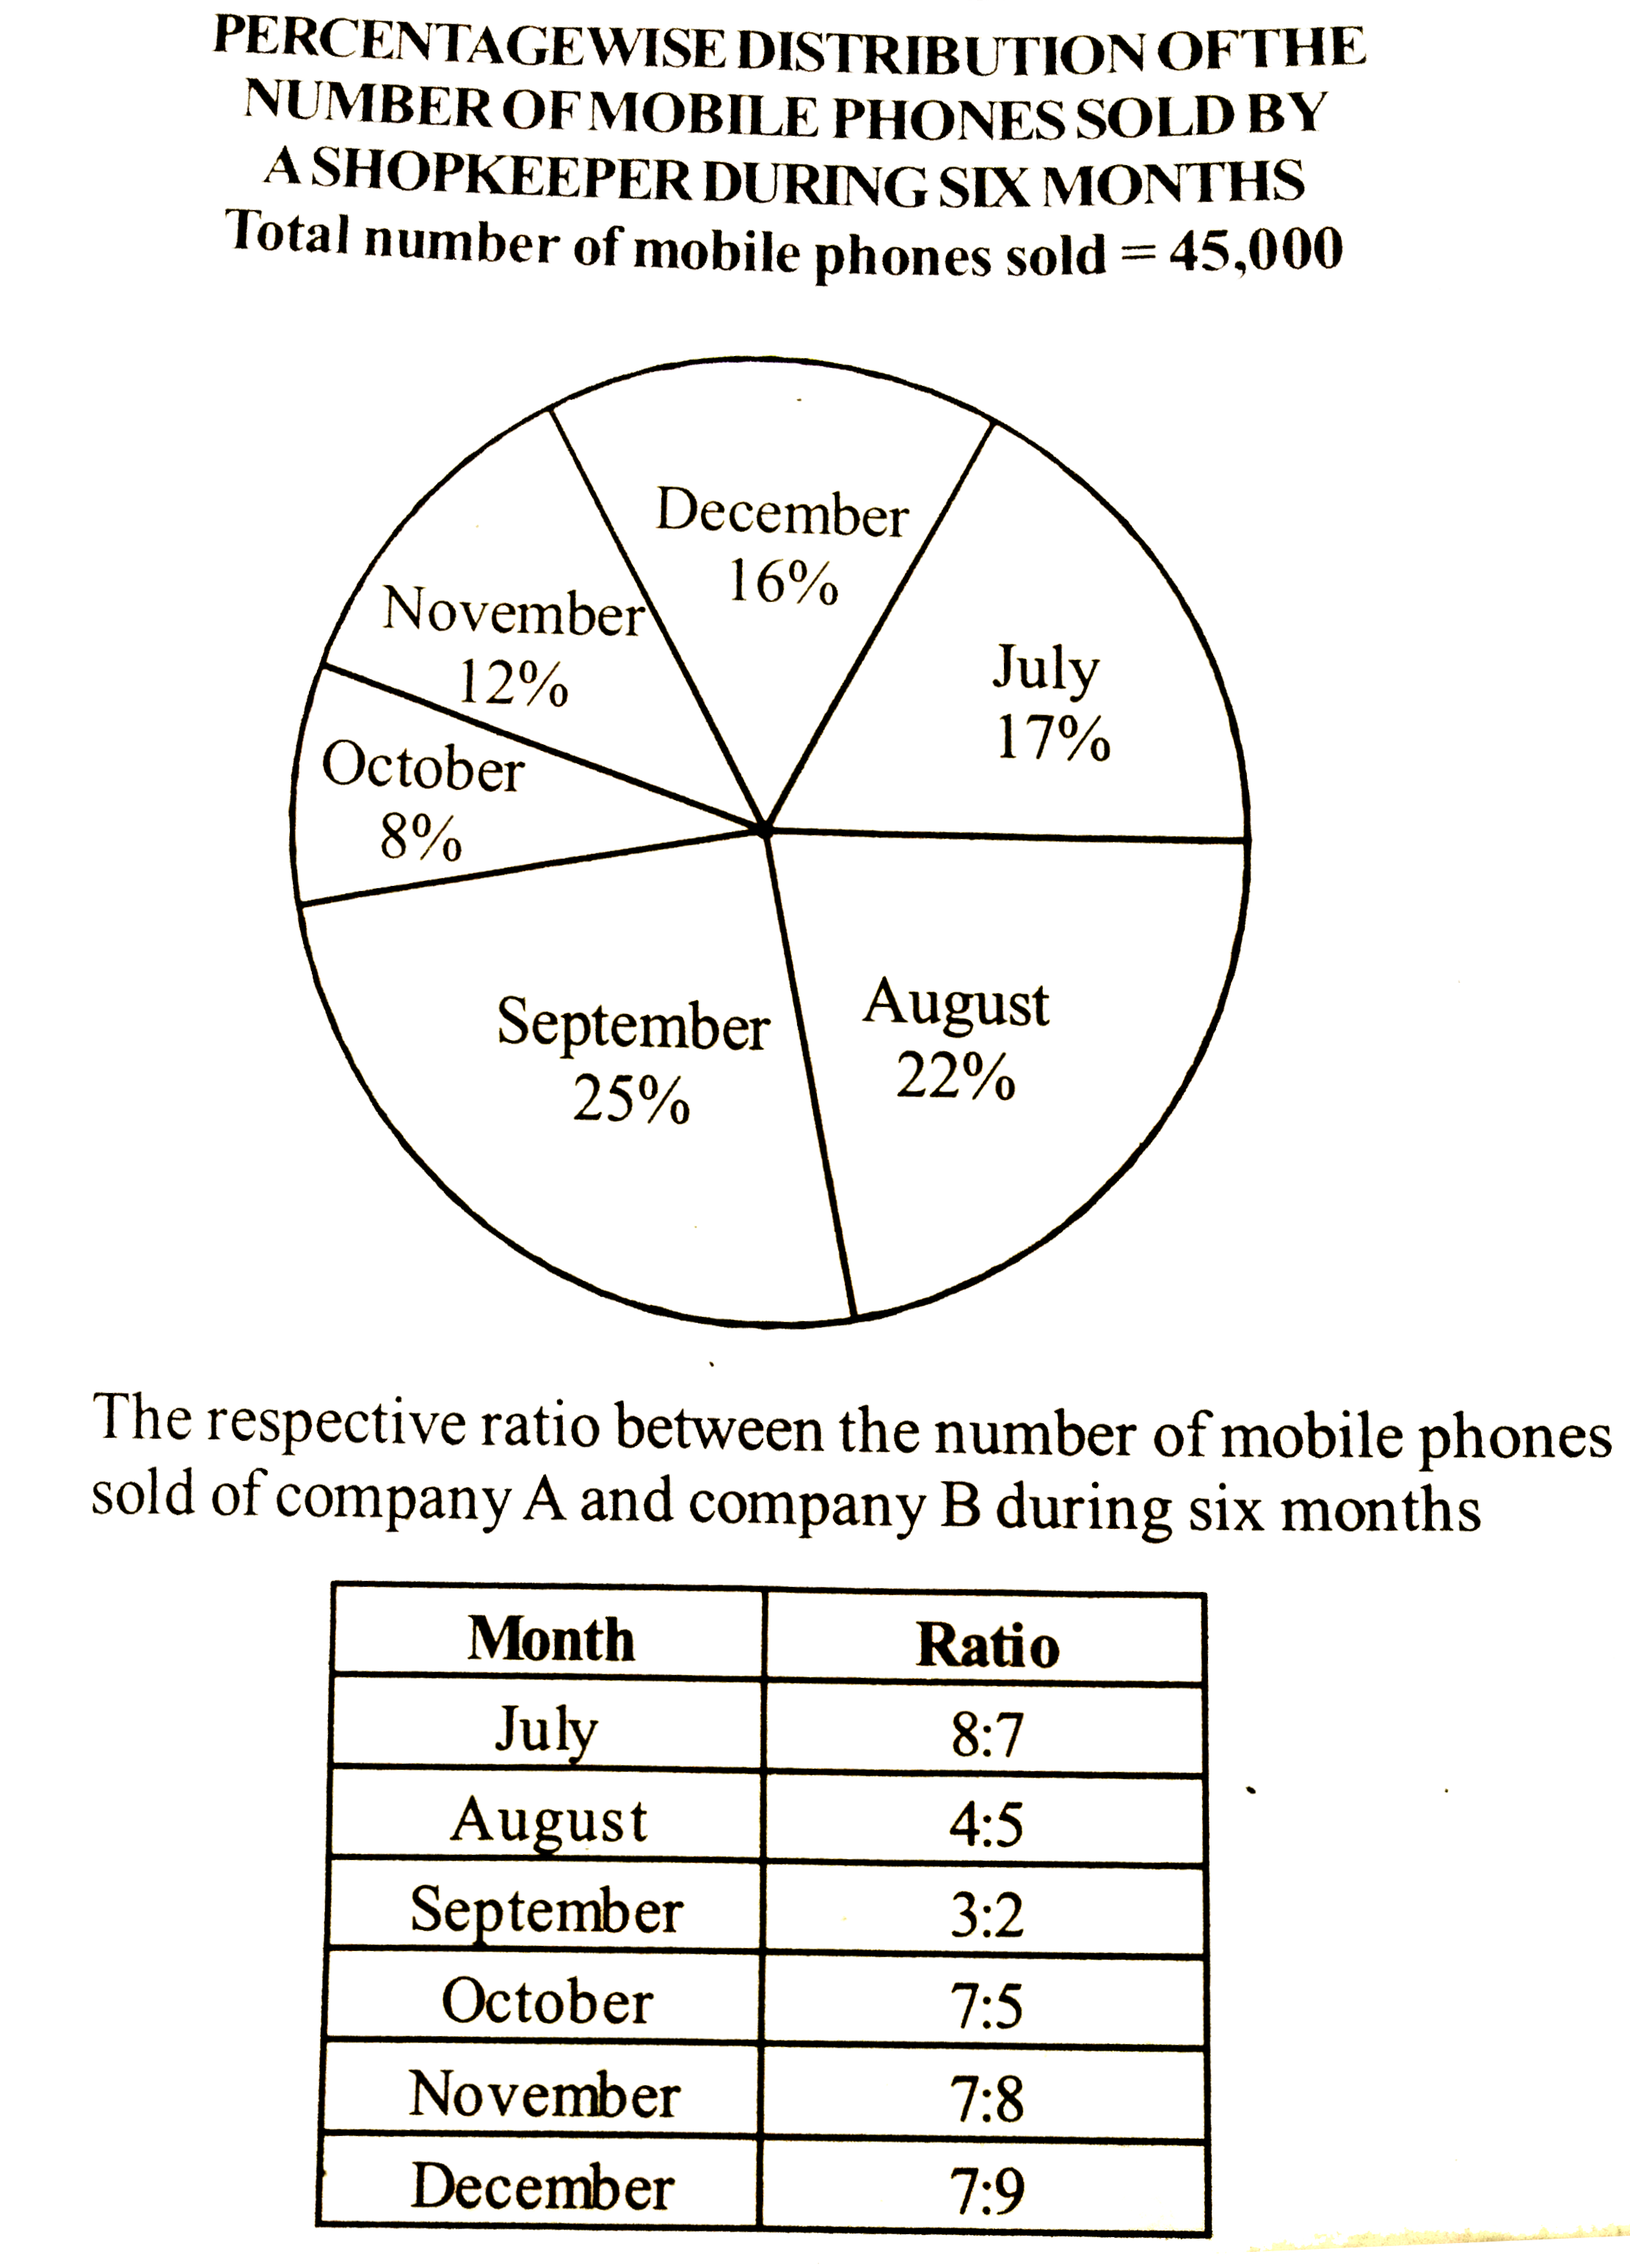
The number of mobile phones sold of company A during July is approximately what percent of number of mobile phones sold of compnay A during December ?
View SolutionPercentage -wise disribution of the number of mobile phones sold by a shopkeeper during six months .Total number of mobile phones sold=45000
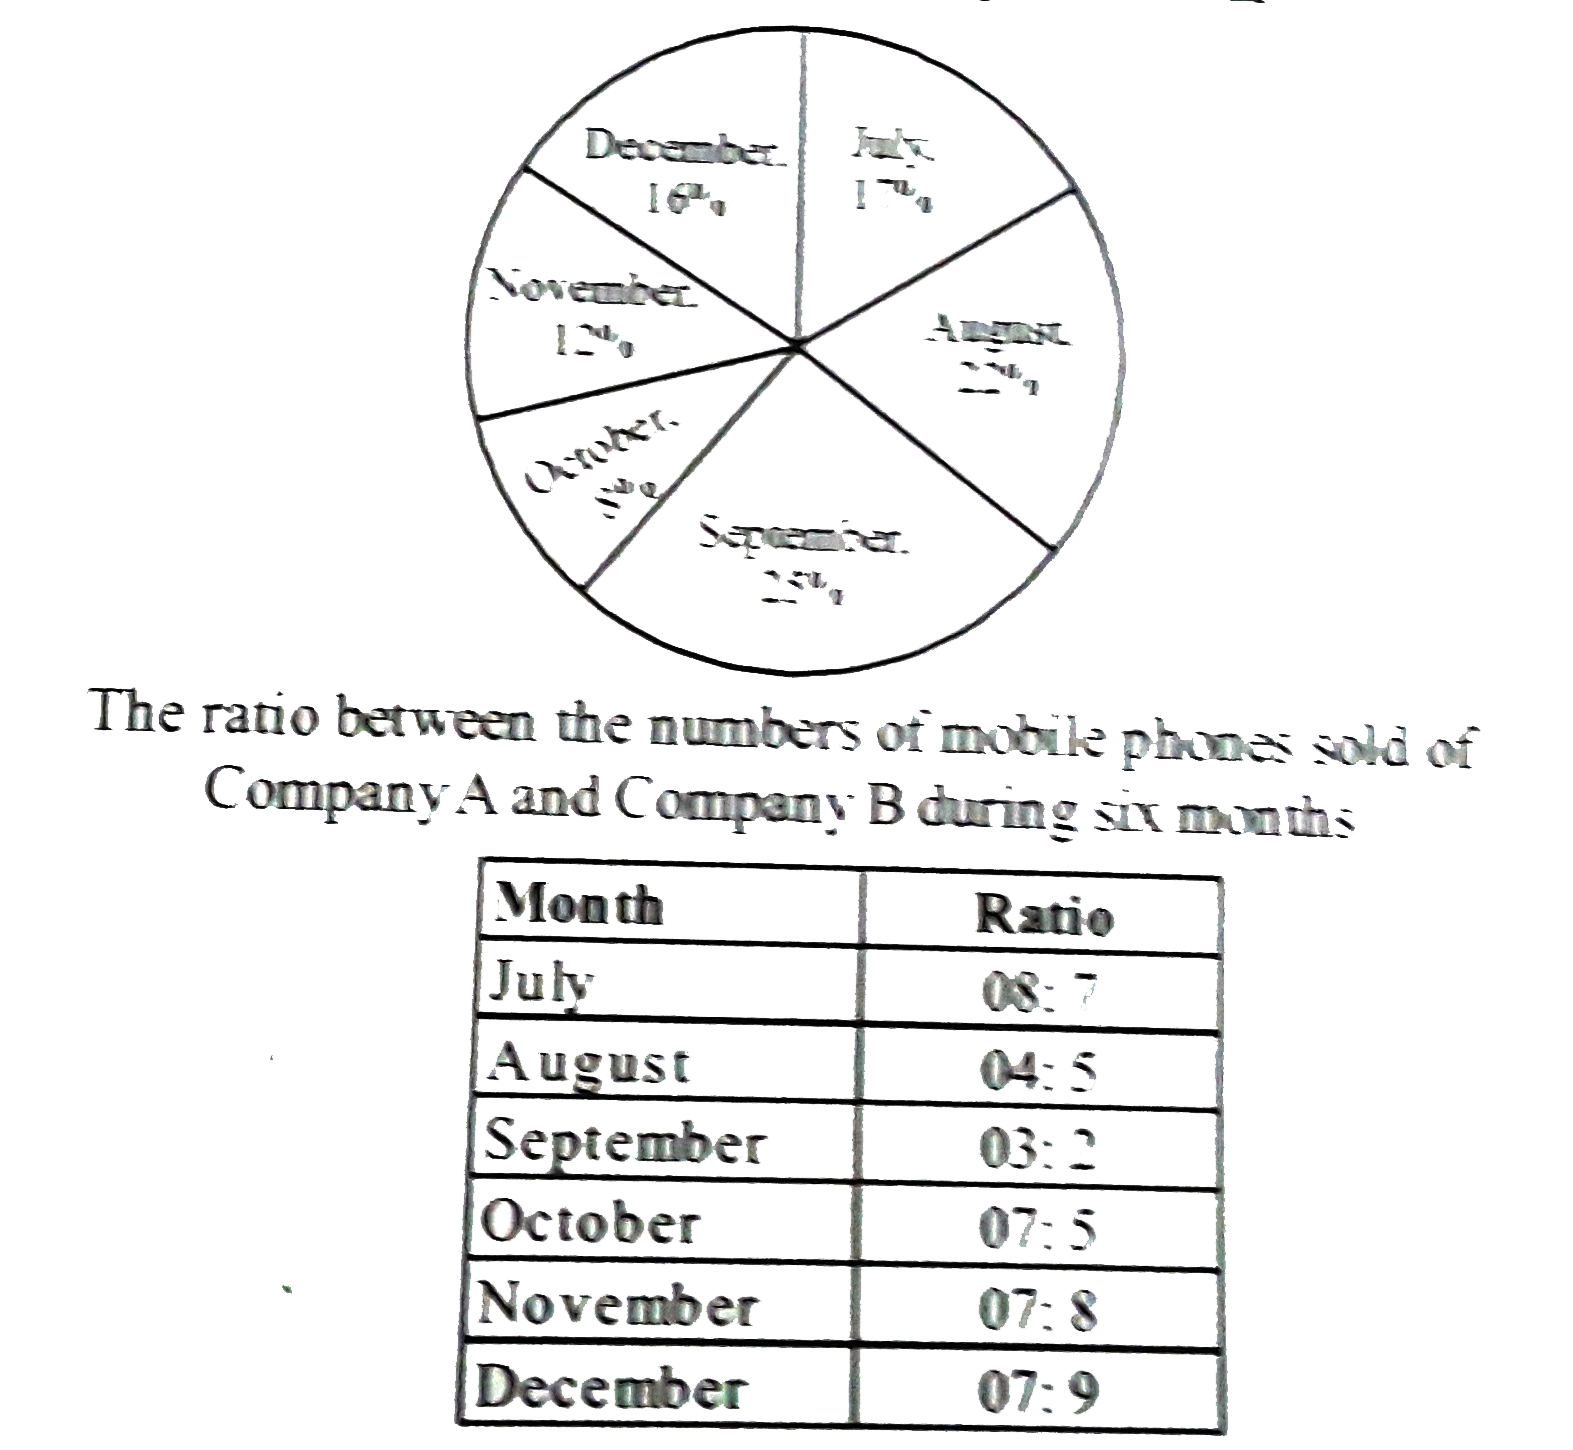
The number of mobile phones sold of Company A during July in approximately what percent of the number of mobile phones sold of Company A during of mobile phones sold Company A during Deceber ?
View SolutionWhat is the total number of mobile phones sold of Company B during August and September together? (a) 10000 (b) 15000 (c) 10500 (d) 9500 (e) None of these
View SolutionStudy the following graph carefully and answer the question given below.
The graph gives the three types of mobile phones manufactured by a company over the years.
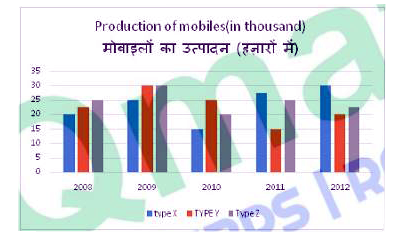
What is the percentage drop in the number of Z type mobiles manufactured from 2009 to 2010 ?
View Solution
