One end of a brass bar is maintained at 306∘C, while the other end is kept at a constant, but lower, temperature. The cross-sectional area of the bar is 2.6×10⁻⁴m2. Because of insulation, there is negligible heat loss through the sides of the bar . Heat flows through the bar, however, at the rate 3.6 J / s . What is the temperature of the bar at a point 0.15m from the hot end ?
301∘C
297∘C
287∘C
265∘C
The correct Answer is:C
To find the temperature of the brass bar at a point 0.15 m from the hot end, we can use the formula derived from Fourier's law of heat conduction:
Qt=k⋅A⋅(T1−T2)L
Where:
- Q/t is the rate of heat transfer (in Joules per second),
- k is the thermal conductivity of the material (for brass, k=110J/(s m °C)),
- A is the cross-sectional area,
- T1 is the temperature at the hot end,
- T2 is the temperature at the cold end,
- L is the length of the bar.
Step 1: Identify the known values
- Q/t=3.6J/s
- T1=306°C
- A=2.6×10⁻⁴m2
- L=0.15m
- k=110J/(s m °C)
Step 2: Rearranging the formula
We need to find T2 (the temperature at the cold end). Rearranging the formula gives:
T2=T1−Q/t⋅Lk⋅A
Step 3: Substitute the known values into the equation
Substituting the known values into the rearranged equation:
T2=306−3.6⋅0.15110⋅2.6×10−4
Step 4: Calculate the denominator
Calculating the denominator:
110⋅2.6×10−4=0.0286J/(s °C)
Step 5: Calculate the fraction
Now calculate the fraction:
3.6⋅0.150.0286=0.540.0286≈18.88
Step 6: Calculate T2
Now substitute this back into the equation for T2:
T2=306−18.88≈287.12°C
Final Answer
The temperature of the bar at a point 0.15 m from the hot end is approximately 287.12°C.
- Q/t is the rate of heat transfer (in Joules per second),
- k is the thermal conductivity of the material (for brass, k=110J/(s m °C)),
- A is the cross-sectional area,
- T1 is the temperature at the hot end,
- T2 is the temperature at the cold end,
- L is the length of the bar.
- Q/t=3.6J/s
- T1=306°C
- A=2.6×10⁻⁴m2
- L=0.15m
- k=110J/(s m °C)
We need to find T2 (the temperature at the cold end). Rearranging the formula gives:
Substituting the known values into the rearranged equation:
Calculating the denominator:
Now calculate the fraction:
Now substitute this back into the equation for T2:
The temperature of the bar at a point 0.15 m from the hot end is approximately 287.12°C.
Topper's Solved these Questions
- HEAT-MEASUREMENT AND TRANSFERBOOK - RESNICK AND HALLIDAYCHAPTER - HEAT-MEASUREMENT AND TRANSFEREXERCISE - PRACTICE QUESTIONS(MORE THAN ONE CORRECT CHOICE TYPE )
8 Videos
- HEAT-MEASUREMENT AND TRANSFERBOOK - RESNICK AND HALLIDAYCHAPTER - HEAT-MEASUREMENT AND TRANSFEREXERCISE - PRACTICE QUESTIONS( LINKED COMPREHENSION)
9 Videos
- HEAT-MEASUREMENT AND TRANSFERBOOK - RESNICK AND HALLIDAYCHAPTER - HEAT-MEASUREMENT AND TRANSFEREXERCISE - PROBLEMS
35 Videos
- GRAVITATIONBOOK - RESNICK AND HALLIDAYCHAPTER - GRAVITATIONEXERCISE - PRACTICE QUESTIONS (INTEGER TYPE)
4 Videos
- HYDROGEN ATOMBOOK - RESNICK AND HALLIDAYCHAPTER - HYDROGEN ATOMEXERCISE - PRACTICE QUESTIONS(Integer Type)
6 Videos
Similar Questions
In fig, two bars of the same metal are connected. The length of the first bar is half of that of the second, but the cross-sectional area is double. What is the temperature of the junction of the bars ?

View SolutionOne end of a 0.25 m long metal bar is in steam and the other is in contact with ice . If 12 g of ice melts per minute, what is the thermal conductivity of the metal? Given cross-section of the bar =5×10⁻⁴m2 and latent heat of ice is 80calg−1
View Solution
Knowledge Check
The rate of flow of heat through a metal bar of area of cross-section 1 m2 when temperature gradient is 1∘C/m under steady state is called
Athermal resistanceBthermal conductivityCdiffusibilityDresistivityThe ends of a thin bar are maintained at different temperatures. The temperature of the cooler end is 11∘C , while the temperature at a point 0.13m from the cooler end is 23∘C and the temperature of the warmer end is 48∘C. Assuming that heat flows only along the length of the bar ( the sides are insulated), find the length of the bar.
A0.50mB0.40mC0.23mD0.64mThe ends of a metal bar of constant cross-sectional area are maintained at temperatures T1andT2 which are both higher than the temperature of the surroundings. If the bar is unlagged, which one of the following sketches best represents the variation of temperature with distance along the bar ?
A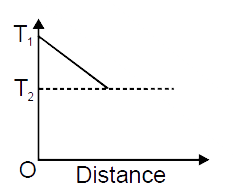 B
B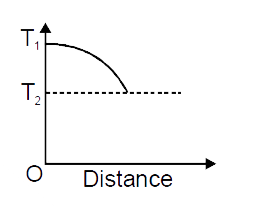 C
C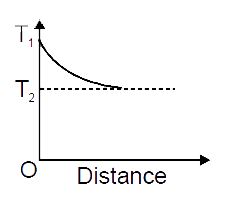 D
D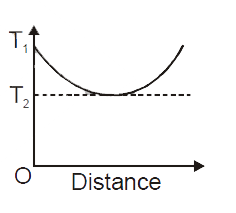
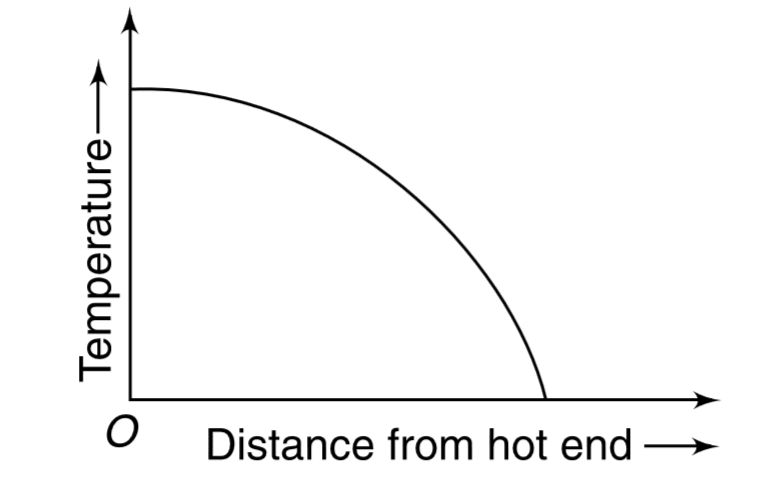
The ends of a metallic bar are maintained at different temperature and there is no loss/gain of heat from the sides of the bar due to conduction or radiation. In the steady state the temperature variation along the length of the bar is a shown in the figure what do you think about the cross sectional area of the bar?
View SolutionThree bars of aluminium, brass and copper are of equal length and cross section. The three pieces are joined together as shown in A, B and C and the ends are maintained at 100∘C and 0∘C. The thermal conductivities of aluminium, brass and copper are in ratio 2 : 1 : 4. Assume no heat loss through curved surface of the bar and that the system is in steady state.
(a) In which of the three cases (A, B or C) the temperature difference across aluminium bar will be maximum?
(b) Draw a graph showing variation of temperature from one end of the bar to another in case B.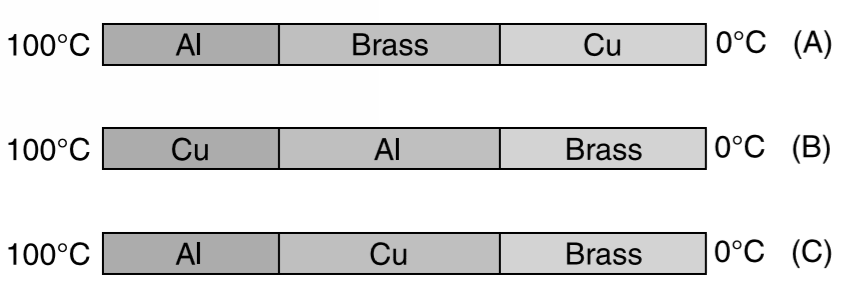
View SolutionA steel bar 10.0 cm long is welded end to end to a copper bar 20.0 cm long. Both bars are insulated perfectly on their sides. Each bar has a square cross-section, 20.00 cm on a side. The free end of the steel bar is maintained at 100∘C by placing it in contact with steam, and the free end of the copper bar is maintained at 0∘C by placing it in contact with ice. find the temperature at the junction of the two bars and the total rate of heat flow.
View SolutionDue to a spatial variation in purity, the thermal conductivity of a metal bar (cross sectional area 4×10⁻⁴m2, length 1m) decreases ineraly along its length from 400 Wm−1K−1 at one end, to 200 Wm−1K−1 at the other. Calculate the rate at which heat flows through the bar if the hot end is maintained at 200∘C and the cold end at 0∘C
View SolutionTwo bars of same length and same cross-sectional area but of different thermal conductivites K1 and K2 are joined end to end as shown in the figure. One end of the compound bar it is at temperature T1 and the opposite end at temperature T2 (whereT1>T2). The temperature of the junction is

View Solution
