Which of the following graphs shows the correct behaviour of electric flux through the surface S when it is rotated by an angle 90∘ clockwise in a uniform electric field ?

A

B

C

D

Text Solution
The correct Answer is:A
The flux through the surface S is givne by ϕ=EScosθ . When surface is rotated θ takes values 45∘→0∘→−45∘cosθ has maximum value at θ∘ therefore. The flux increases, attain a maximum value and then decreases .
|
Topper's Solved these Questions
- ELECTRIC CHARGES AND FIELDS BOOK - DISHA PUBLICATIONCHAPTER - ELECTRIC CHARGES AND FIELDS EXERCISE - Exercise - 1 Concept builder (Topicwise)
58 Videos
- DUAL NATURE OF RADIATION AND MATTERBOOK - DISHA PUBLICATIONCHAPTER - DUAL NATURE OF RADIATION AND MATTEREXERCISE - EXERCISE -2 : CONCEPT ALLPLICATOR
30 Videos
- ELECTROMAGNETIC INDUCTION BOOK - DISHA PUBLICATIONCHAPTER - ELECTROMAGNETIC INDUCTION EXERCISE - EXERCISE - 2 : Concept Applicator
29 Videos
Similar Questions
Knowledge Check
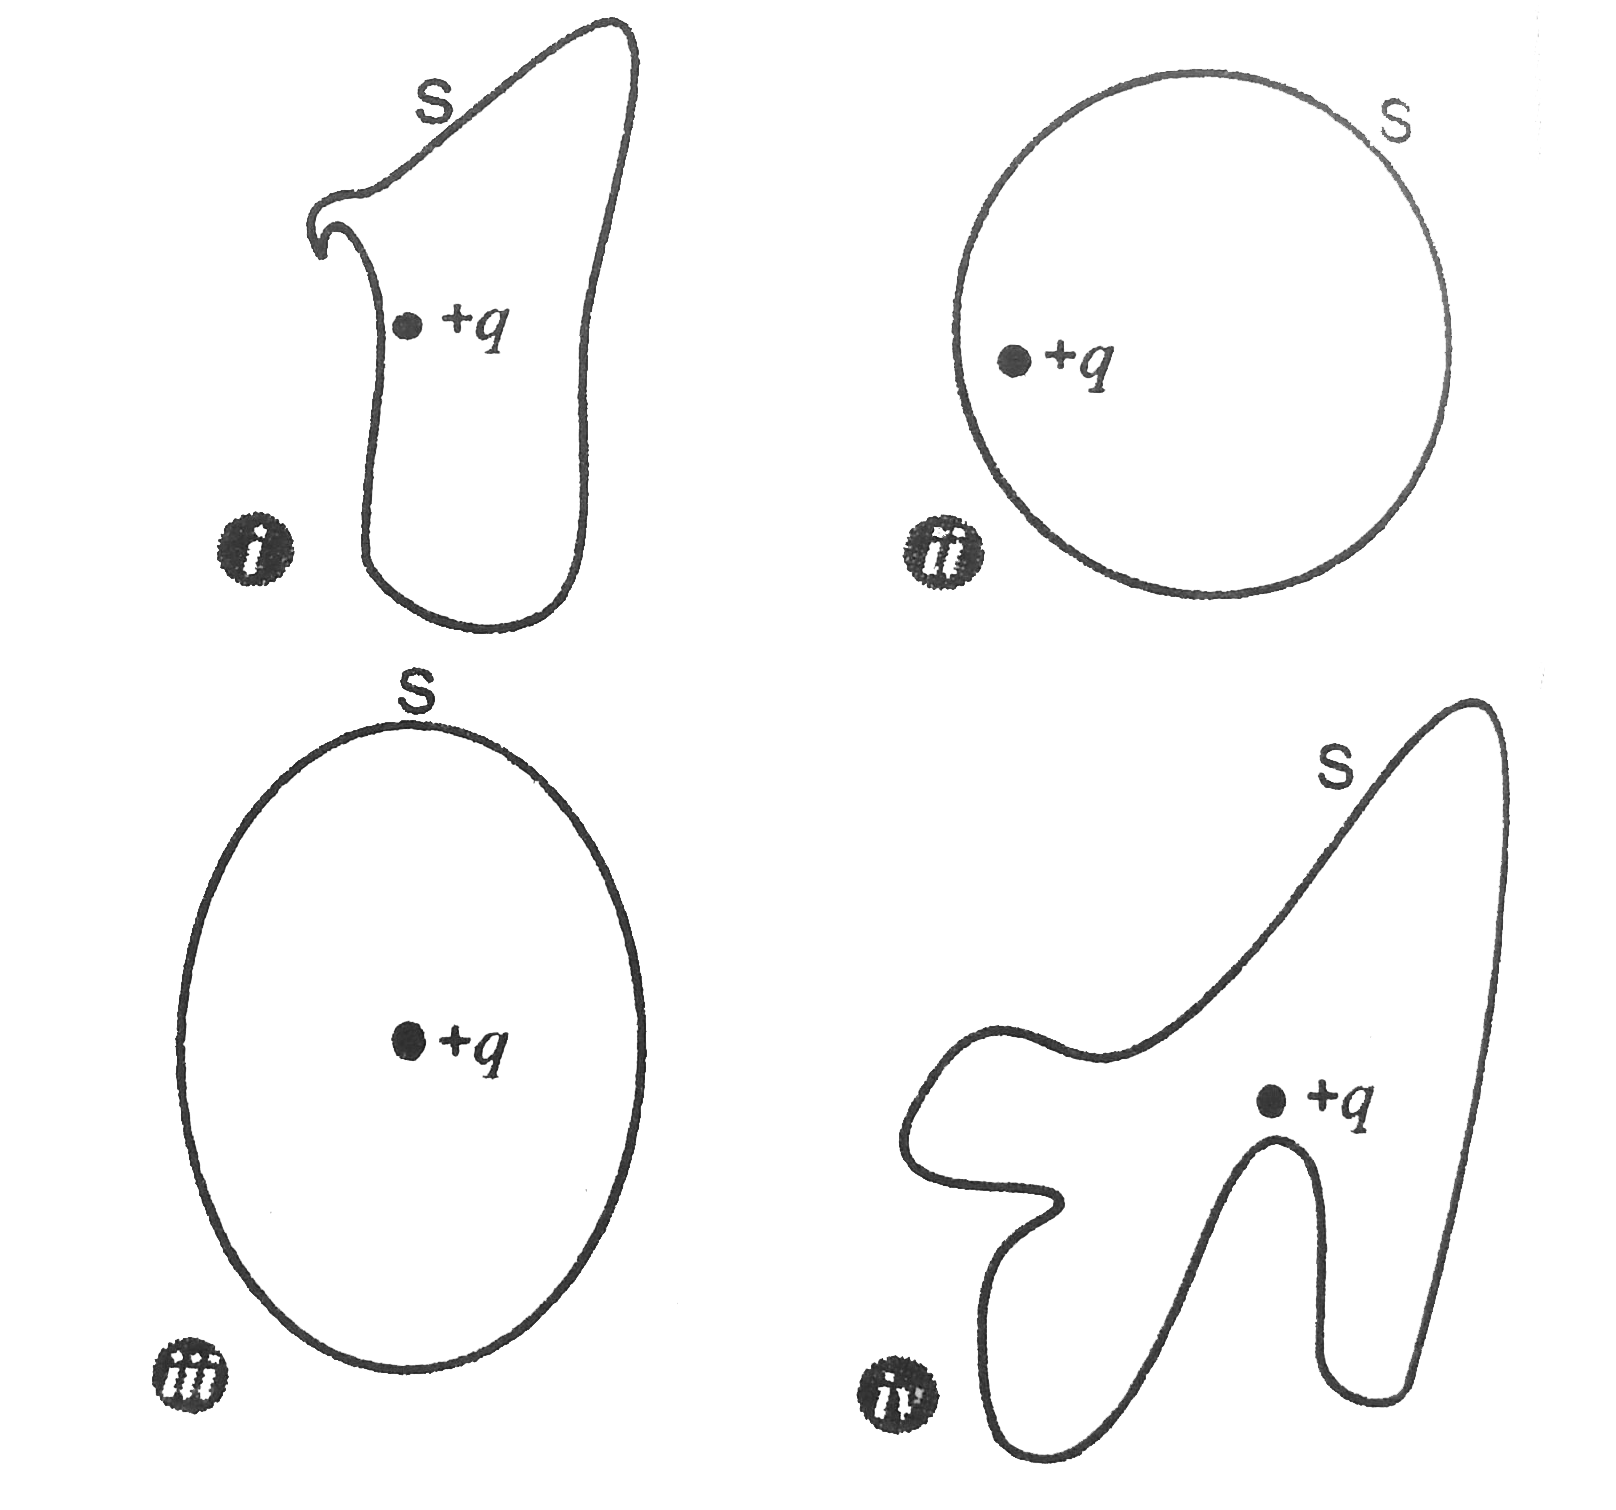
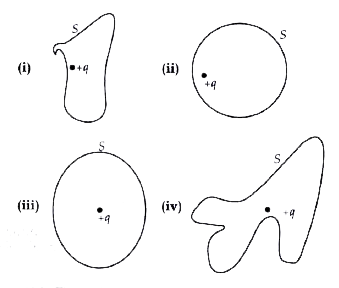
The electric flux through the surface
 Ain fig. (iv) is the largestBin fig. (iii) is the leastCin fig. (ii) is same as fig.(iii) but is smaller than fig.(iv)DIs the same for all the figures.
The electric flux through the surface
 Ain fig, (iv) is the largestBin fig, (iii) is the leastCin fig (ii) is same as a fig (iii) but is smaller than that in Fig (iv).Dis the same for all the figures.
The flux of electric field due to these charges through the surface S is
 A2qε0B3qε0C−5qε0Dqε0
The electric flux through the surface

View SolutionThe electric flux through the surface :

View SolutionA surface encloses an electric dipole. The electric flux through the surface is
View SolutionWhich of the following is true for electric flux through a Gaussian surface ?
View SolutionIf the flux of the electric field through a closed surface is zero,
View Solution
