The figure given below shows three velocity - substrate concentration curves for an enzyme reaction . What do the curves a , b and c depict respectively .
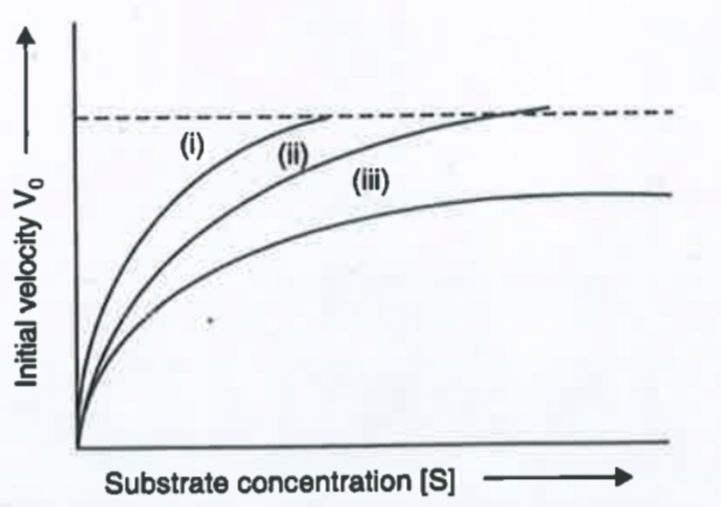
(i) normal enzyme reaction,
(ii) competitive inhibition ,
(iii) non-competitive inhibition
(i) enzyme with an allosteric modulator added .
(ii) normal enzymes activity ,
(iii) competitive inhibition
(i) enzyme with an allosteric stimulator ,
(ii) competitive inhibitor added,
(iii) normal enzyme reaction
(i) normal enzyme reaction ,
(ii) non-competitive inhibitor added ,
(iii) allosteric inhibitor added
The correct Answer is:D
Step by step video & image solution for The figure given below shows three velocity - substrate concentration curves for an enzyme reaction . What do the curves a , b and c depict respectively . by Biology experts to help you in doubts & scoring excellent marks in Class 11 exams.
Updated on:21/07/2023Topper's Solved these Questions
- BIOMOLECULES Book:MODERN PUBLICATIONChapter:BIOMOLECULES Exercise:COMPETITION FILE OBJECTIVE TYPE QUESTIONS (MULTIPLE CHOICE QUESTIONS)
Explore 1 Video
- BIOMOLECULES Book:MODERN PUBLICATIONChapter:BIOMOLECULES Exercise:CHAPTER PRACTICE TEST
Explore 16 Videos
- BIOMOLECULES Book:MODERN PUBLICATIONChapter:BIOMOLECULES Exercise:COMPETITION FILE (OBJECTIVE TYPE QUESTIONS) (ANALOGY TYPE QUESTIONS )
Explore 10 Videos
- BIOLOGICAL CLASSIFICATIONBook:MODERN PUBLICATIONChapter:BIOLOGICAL CLASSIFICATIONExercise:CHAPTER PRACTICE TEST
Explore 16 Videos
- BODY FLUIDS AND CIRCULATION Book:MODERN PUBLICATIONChapter:BODY FLUIDS AND CIRCULATION Exercise:Chapter Practice Test
Explore 15 Videos
Similar Questions
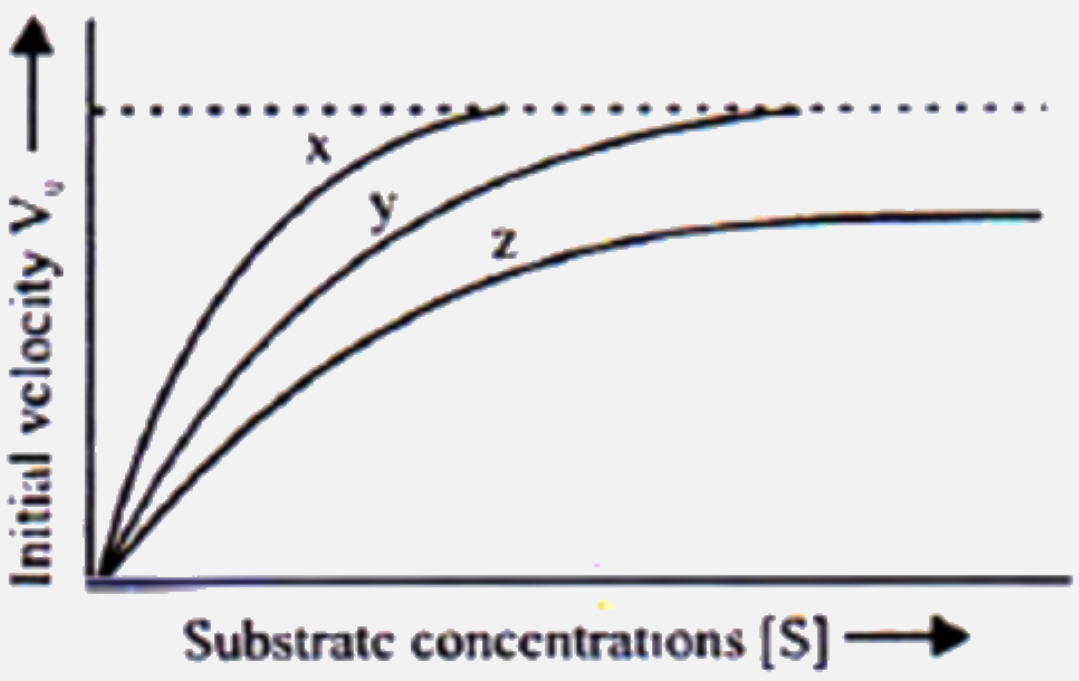
The Given figure shows three velocity-substrate concentration curves of an enzyme reaction. What do the curves X Y and Z depict respectively ?
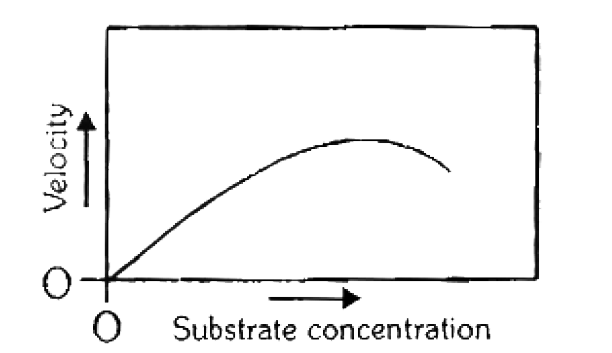
View SolutionThe graph given below shows the effect of substrate concentration on the rate of reaction of the enzyme green-gram-phosphatase What does the graph indicates?
View Solution
Knowledge Check
The given figure shows three velocity-substrate concentration curves for an enzyme reaction. What do the curves x, y and z depict respectively?
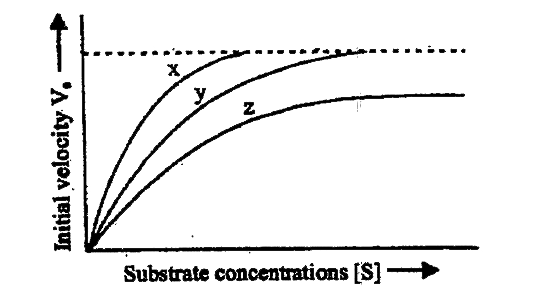 Ax-normal enzyme reaction, y-competitive inhibition, z-non-competitive inhibitionBx-enzyme with an allosteric modulator added, y-normal enzyme activity, 2-competitive inhibitionCX-enzyme with an allosteric stimulator, y-competitive inhibition added z-normal enzyme reactionDx-normal enzyme reaction, y-non-competitive inhibitor added z-allosteric inhibitor added
Figure given below shows three velocity-substrate concentration curves for an enzyme reaxtion. What do the curves for an enzyme reaction. What do the curves depict
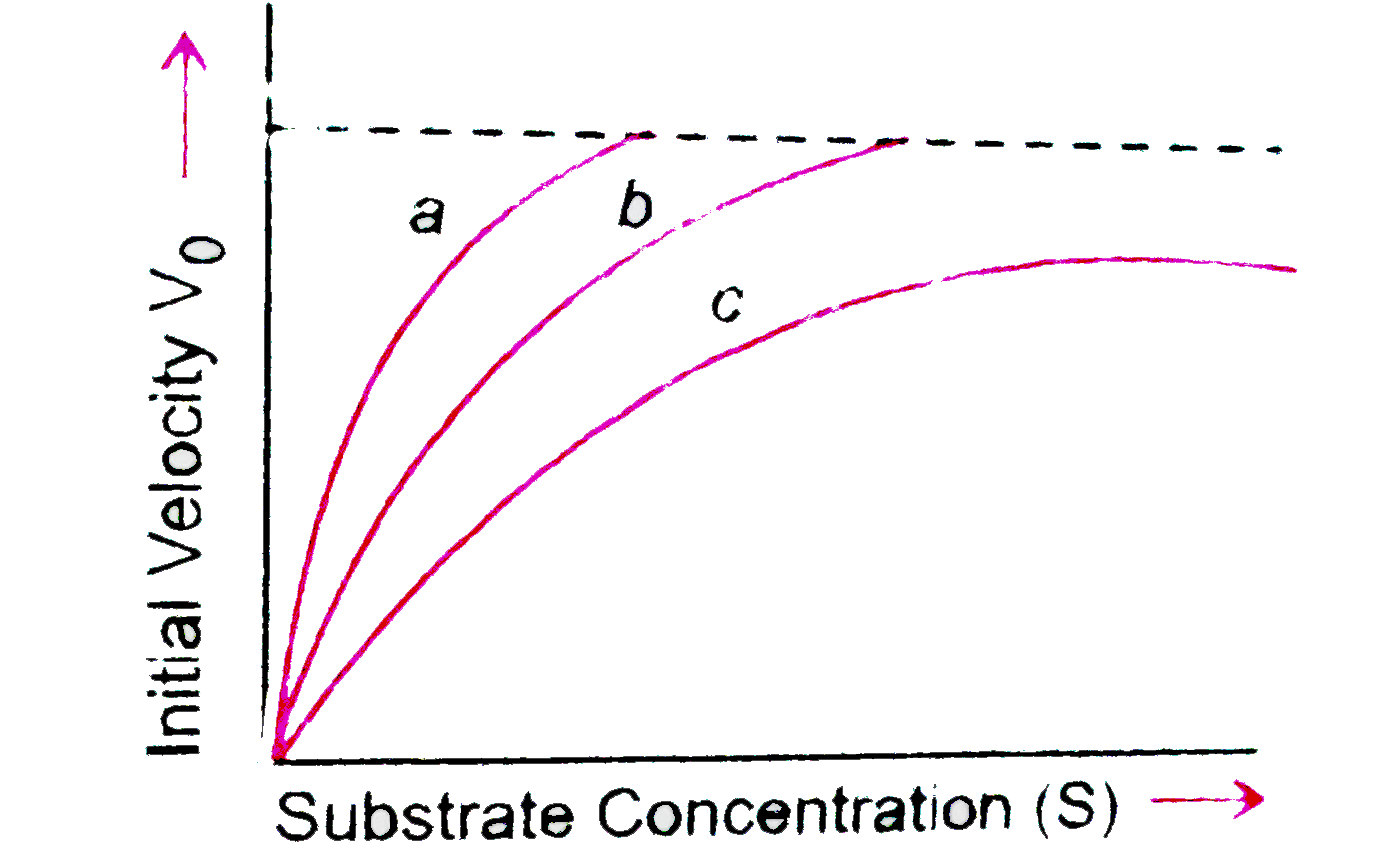 Aa-normal enzymes action, b-competitive inhibition,c-noncompetitive inhibitionBa-enzyme with an allosteric modulator added, b-normal enzyme activity, c-competitive inhibitionCa-enzyme with an allosteric stimulator,b-competitive inhibition added, c-normal enzyme reactionDa-normal enzyme reaction, b-non-competitive enhibition added c-allosteric inhibitor add.
The figure given below shows three resistors:

Their combined resistane is:A157ΩB14ΩC623ΩD712Ω
In the given reaction :

What are A, B and C respectively ?
View SolutionThe given graph shows the effect of substrate concentration on the rate of reaction of the enzyme green-gram-phosphatase What does the graph indicate?
View SolutionThe given graph shows the effect of substrate concentration on the rate of reaction of the enzymes green gram-phosphatase. What does the graph indicate ?
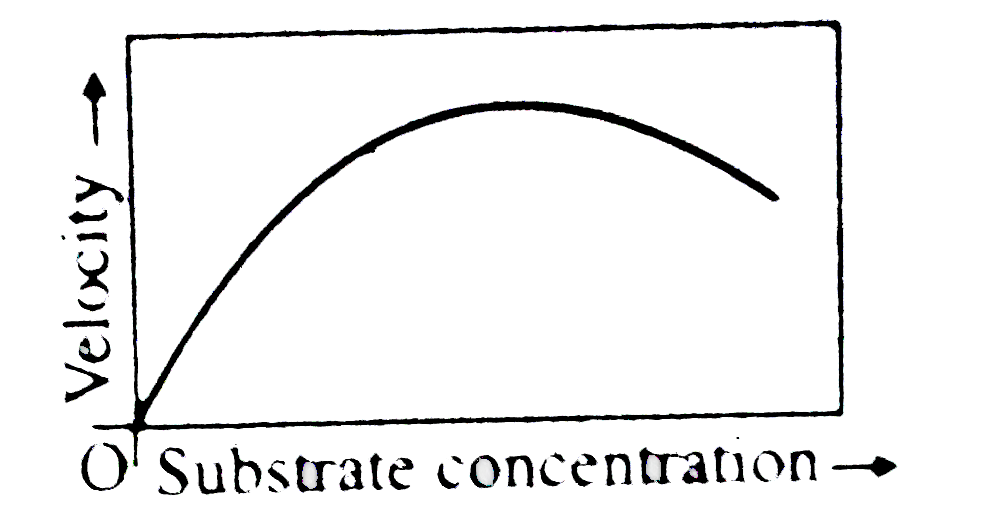
View SolutionThe given graph shows the effect of substrate concentration on the rate of reaction of the enzyme green gram-phosphatase

What dose the graph indicate
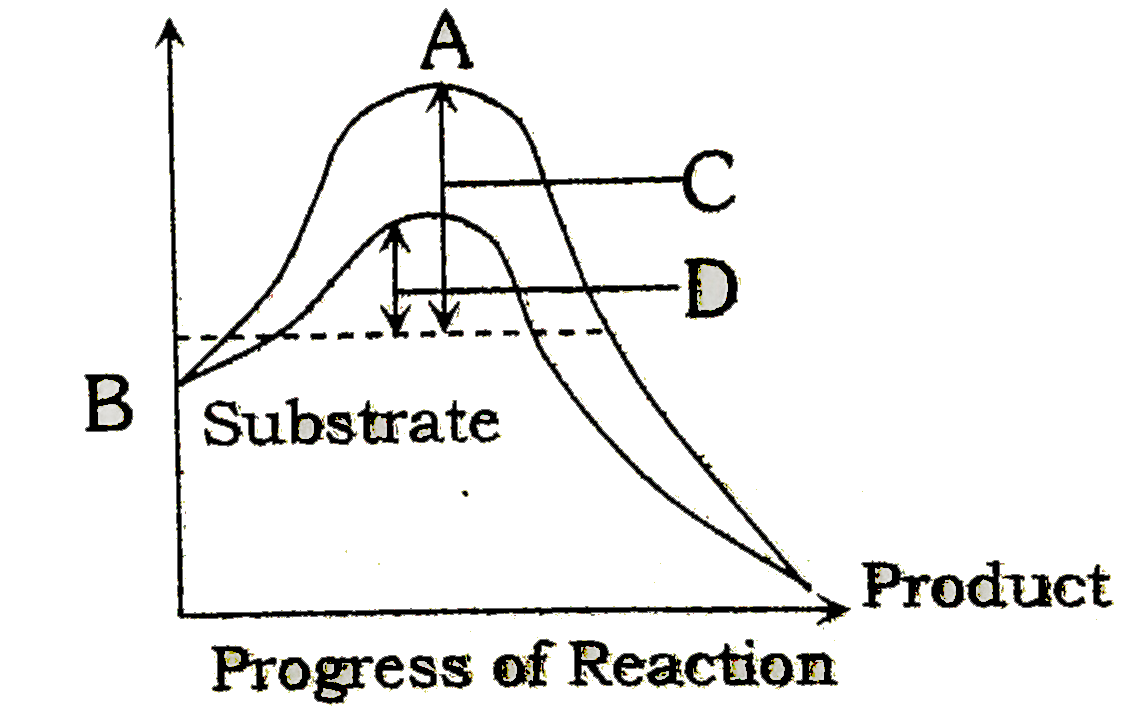
View SolutionThe figure given below shows the conversion of a substrate into product by an enzyme. In which one of the four options (a-d) the components of reaction labelled as A, B, C and D are identified correctly
View Solution