A graph of x verus t is shown in the figure given below. Choose correct alternatives from below.
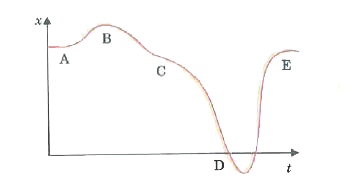
The particle was released from rest at t = 0 .
At B, the acceleration a>0 .
At C, the velocity and the acceleration vanish .
Average velocity for the motion between A and D is positive .
The correct Answer is:(a,c,e)
At point A, slope of graph is zero , so v = 0 .
At B , x - t graph is parallel to time axis , so v= 0 and a = 0 .
At C there is change in slope, so v and a vanish.
Between A and D , average velocity is negative .
Also , slope at D> slope at E .
So , speed at D will be more than at E.
So , speed at D will be more than at E .
The correct options are (a) , (c) and (e).
Topper's Solved these Questions
- MOTION IN A STRAIGHT LINE Book:MODERN PUBLICATIONChapter:MOTION IN A STRAIGHT LINE Exercise:HIGHER ORDER THINKING SKILL AND ADVANCED LEVEL QUESTION WITH ANSWER
Explore 5 Videos
- MOTION IN A STRAIGHT LINE Book:MODERN PUBLICATIONChapter:MOTION IN A STRAIGHT LINE Exercise:REVISION EXERCISE (VERY SHORT ANSWER QUESTION)
Explore 40 Videos
- MOTION IN A STRAIGHT LINE Book:MODERN PUBLICATIONChapter:MOTION IN A STRAIGHT LINE Exercise:NCERT (MULTIPLE CHOICE QUESTION (TYPE-I))
Explore 6 Videos
- MOTION IN A PLANE Book:MODERN PUBLICATIONChapter:MOTION IN A PLANE Exercise:Chapter Practice Test
Explore 15 Videos
- OSCILLATIONS Book:MODERN PUBLICATIONChapter:OSCILLATIONS Exercise:Practice Test (For Board Examination)
Explore 12 Videos
Similar Questions
Knowledge Check
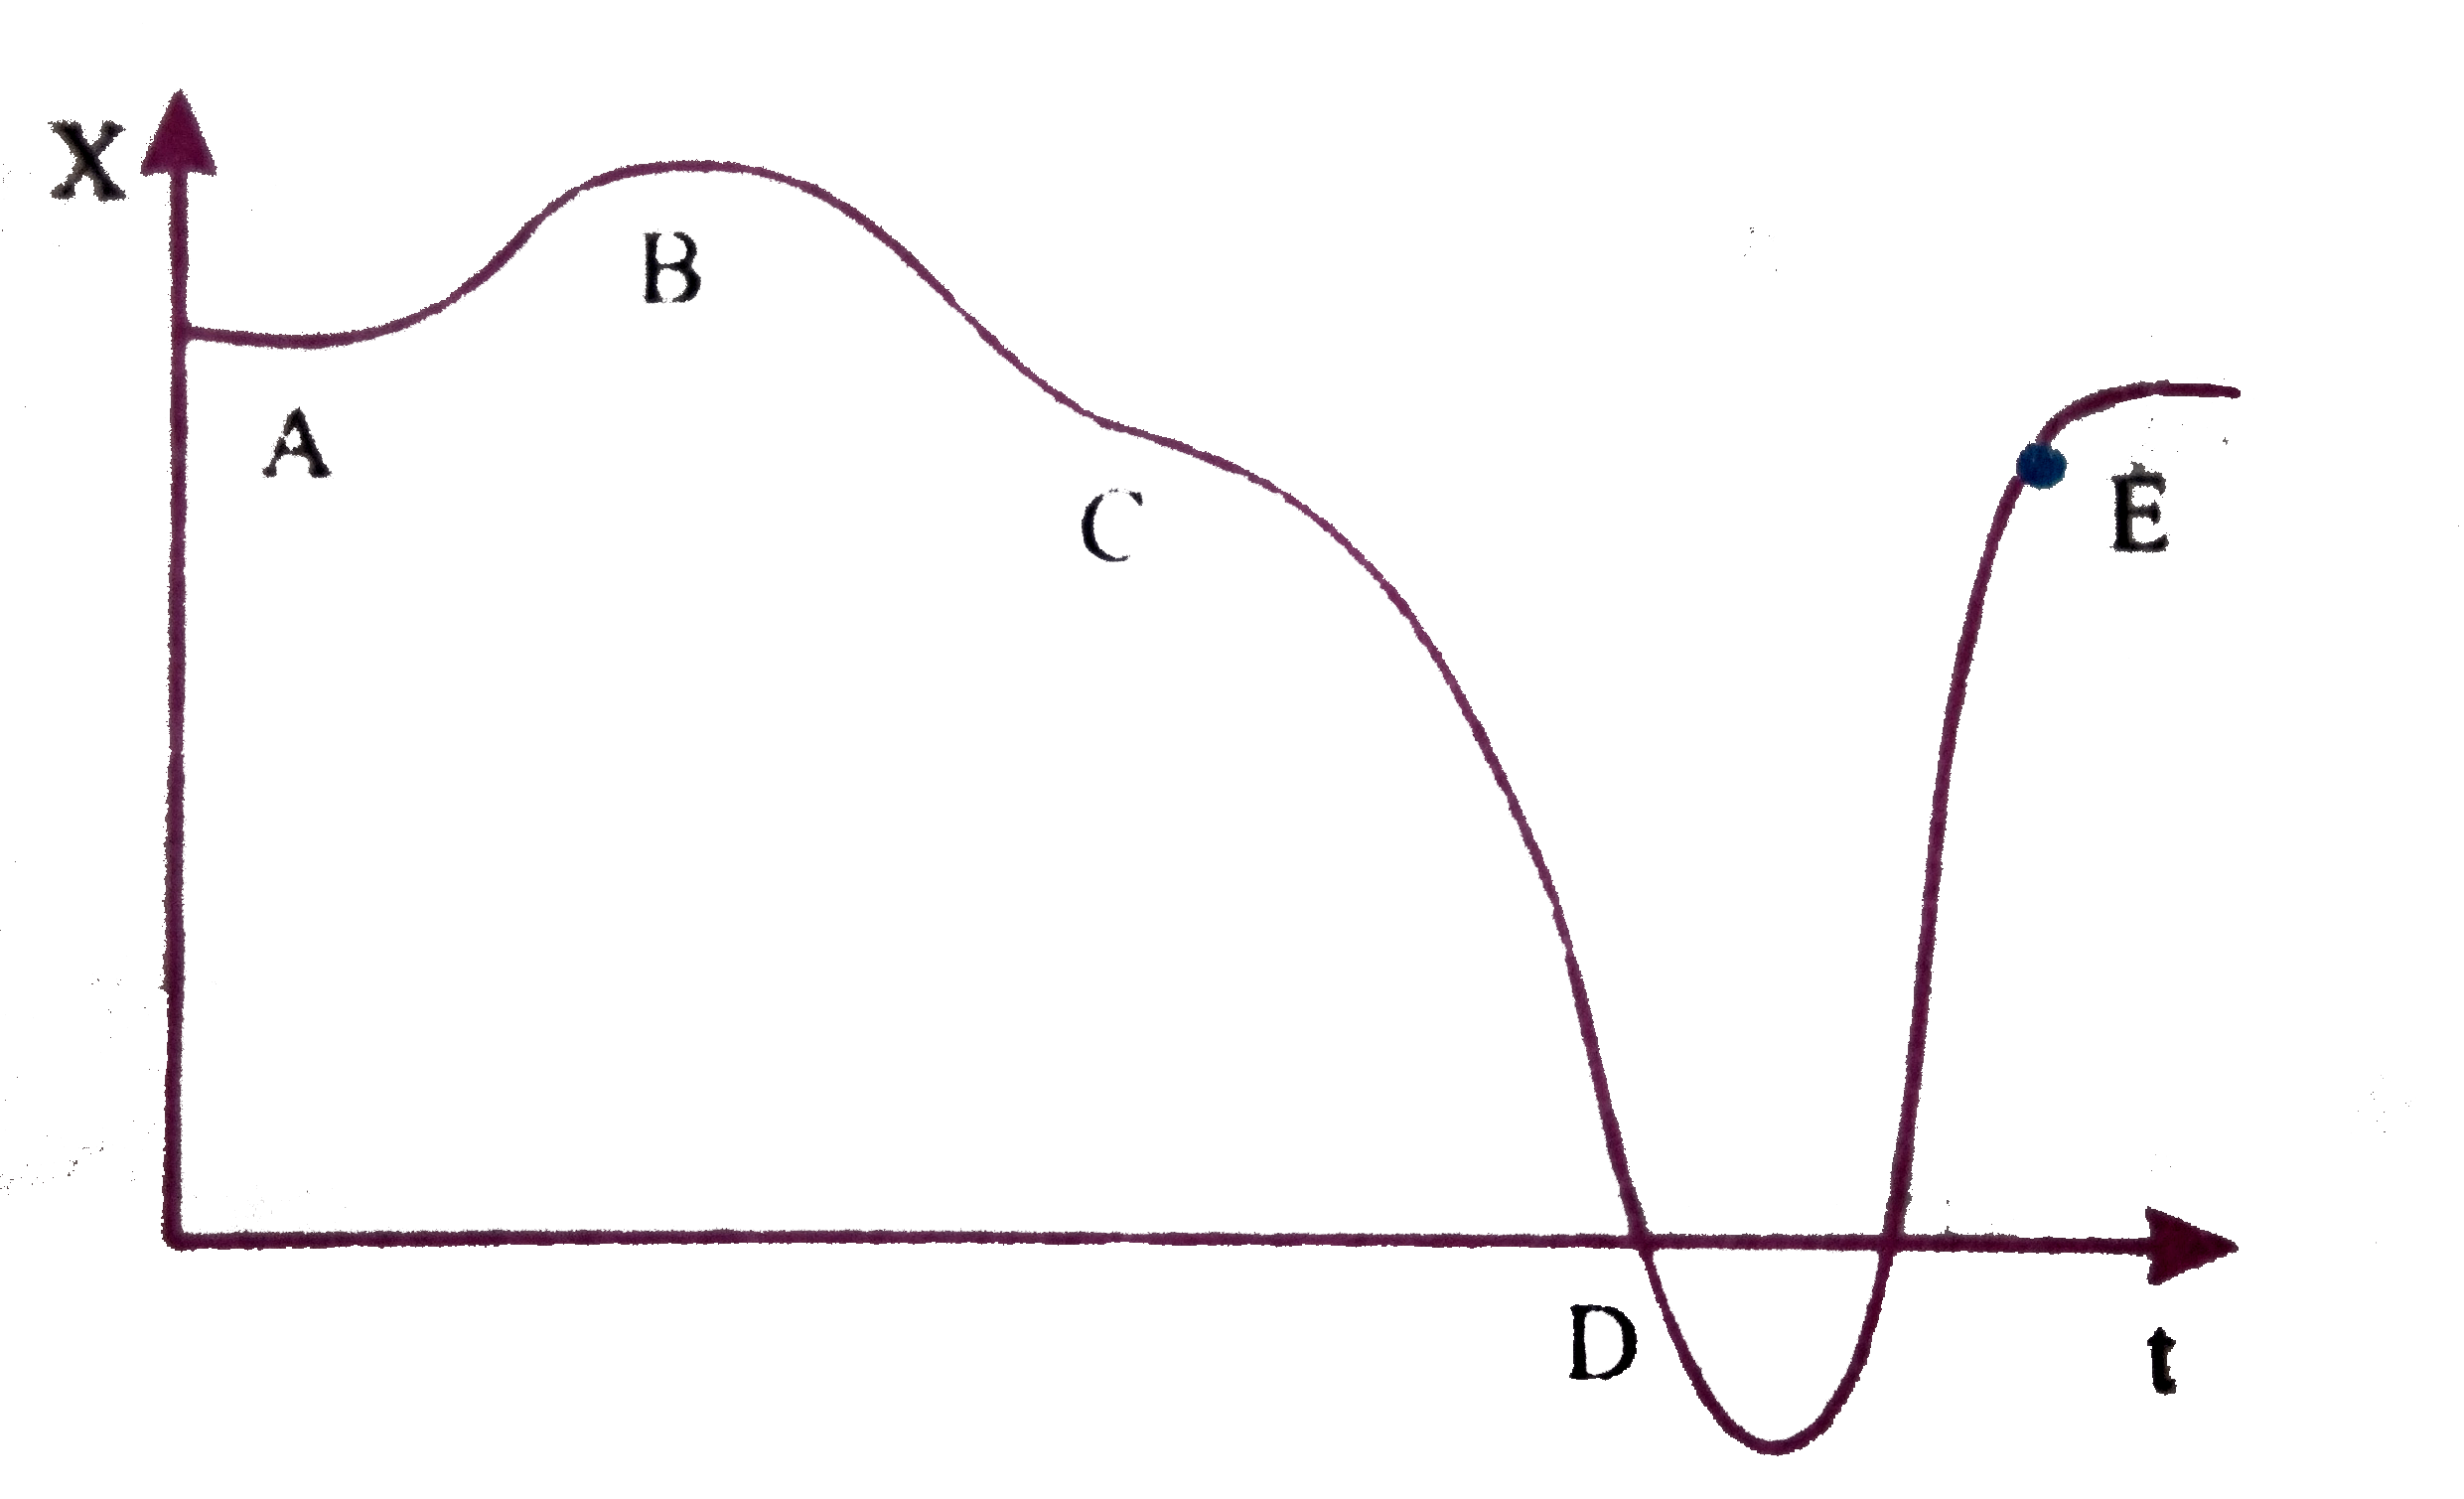
A graph of x versus t is shown in figure. Choose correct alternative from below.AThe particle was released from rest at t=0BAt B, the accleration a>0CAverage velocity for the motion between A and D is positive.DThe speed at D exceeds that at E.Circuit as shown in figure below, choose the correct statement
 A(A) current in resistance R and current in inductor L.a.c. source will be in 90^(@ phase differenceBotential drop across R and potential drop across L will be in same phaseCcurrent through C and current through L will be in 90∘ phase differenceDcurrent in R and current in L will be in same phase
The heating curve of a paritcular substance in solid state is as shown in the figure .choose the correct alternative
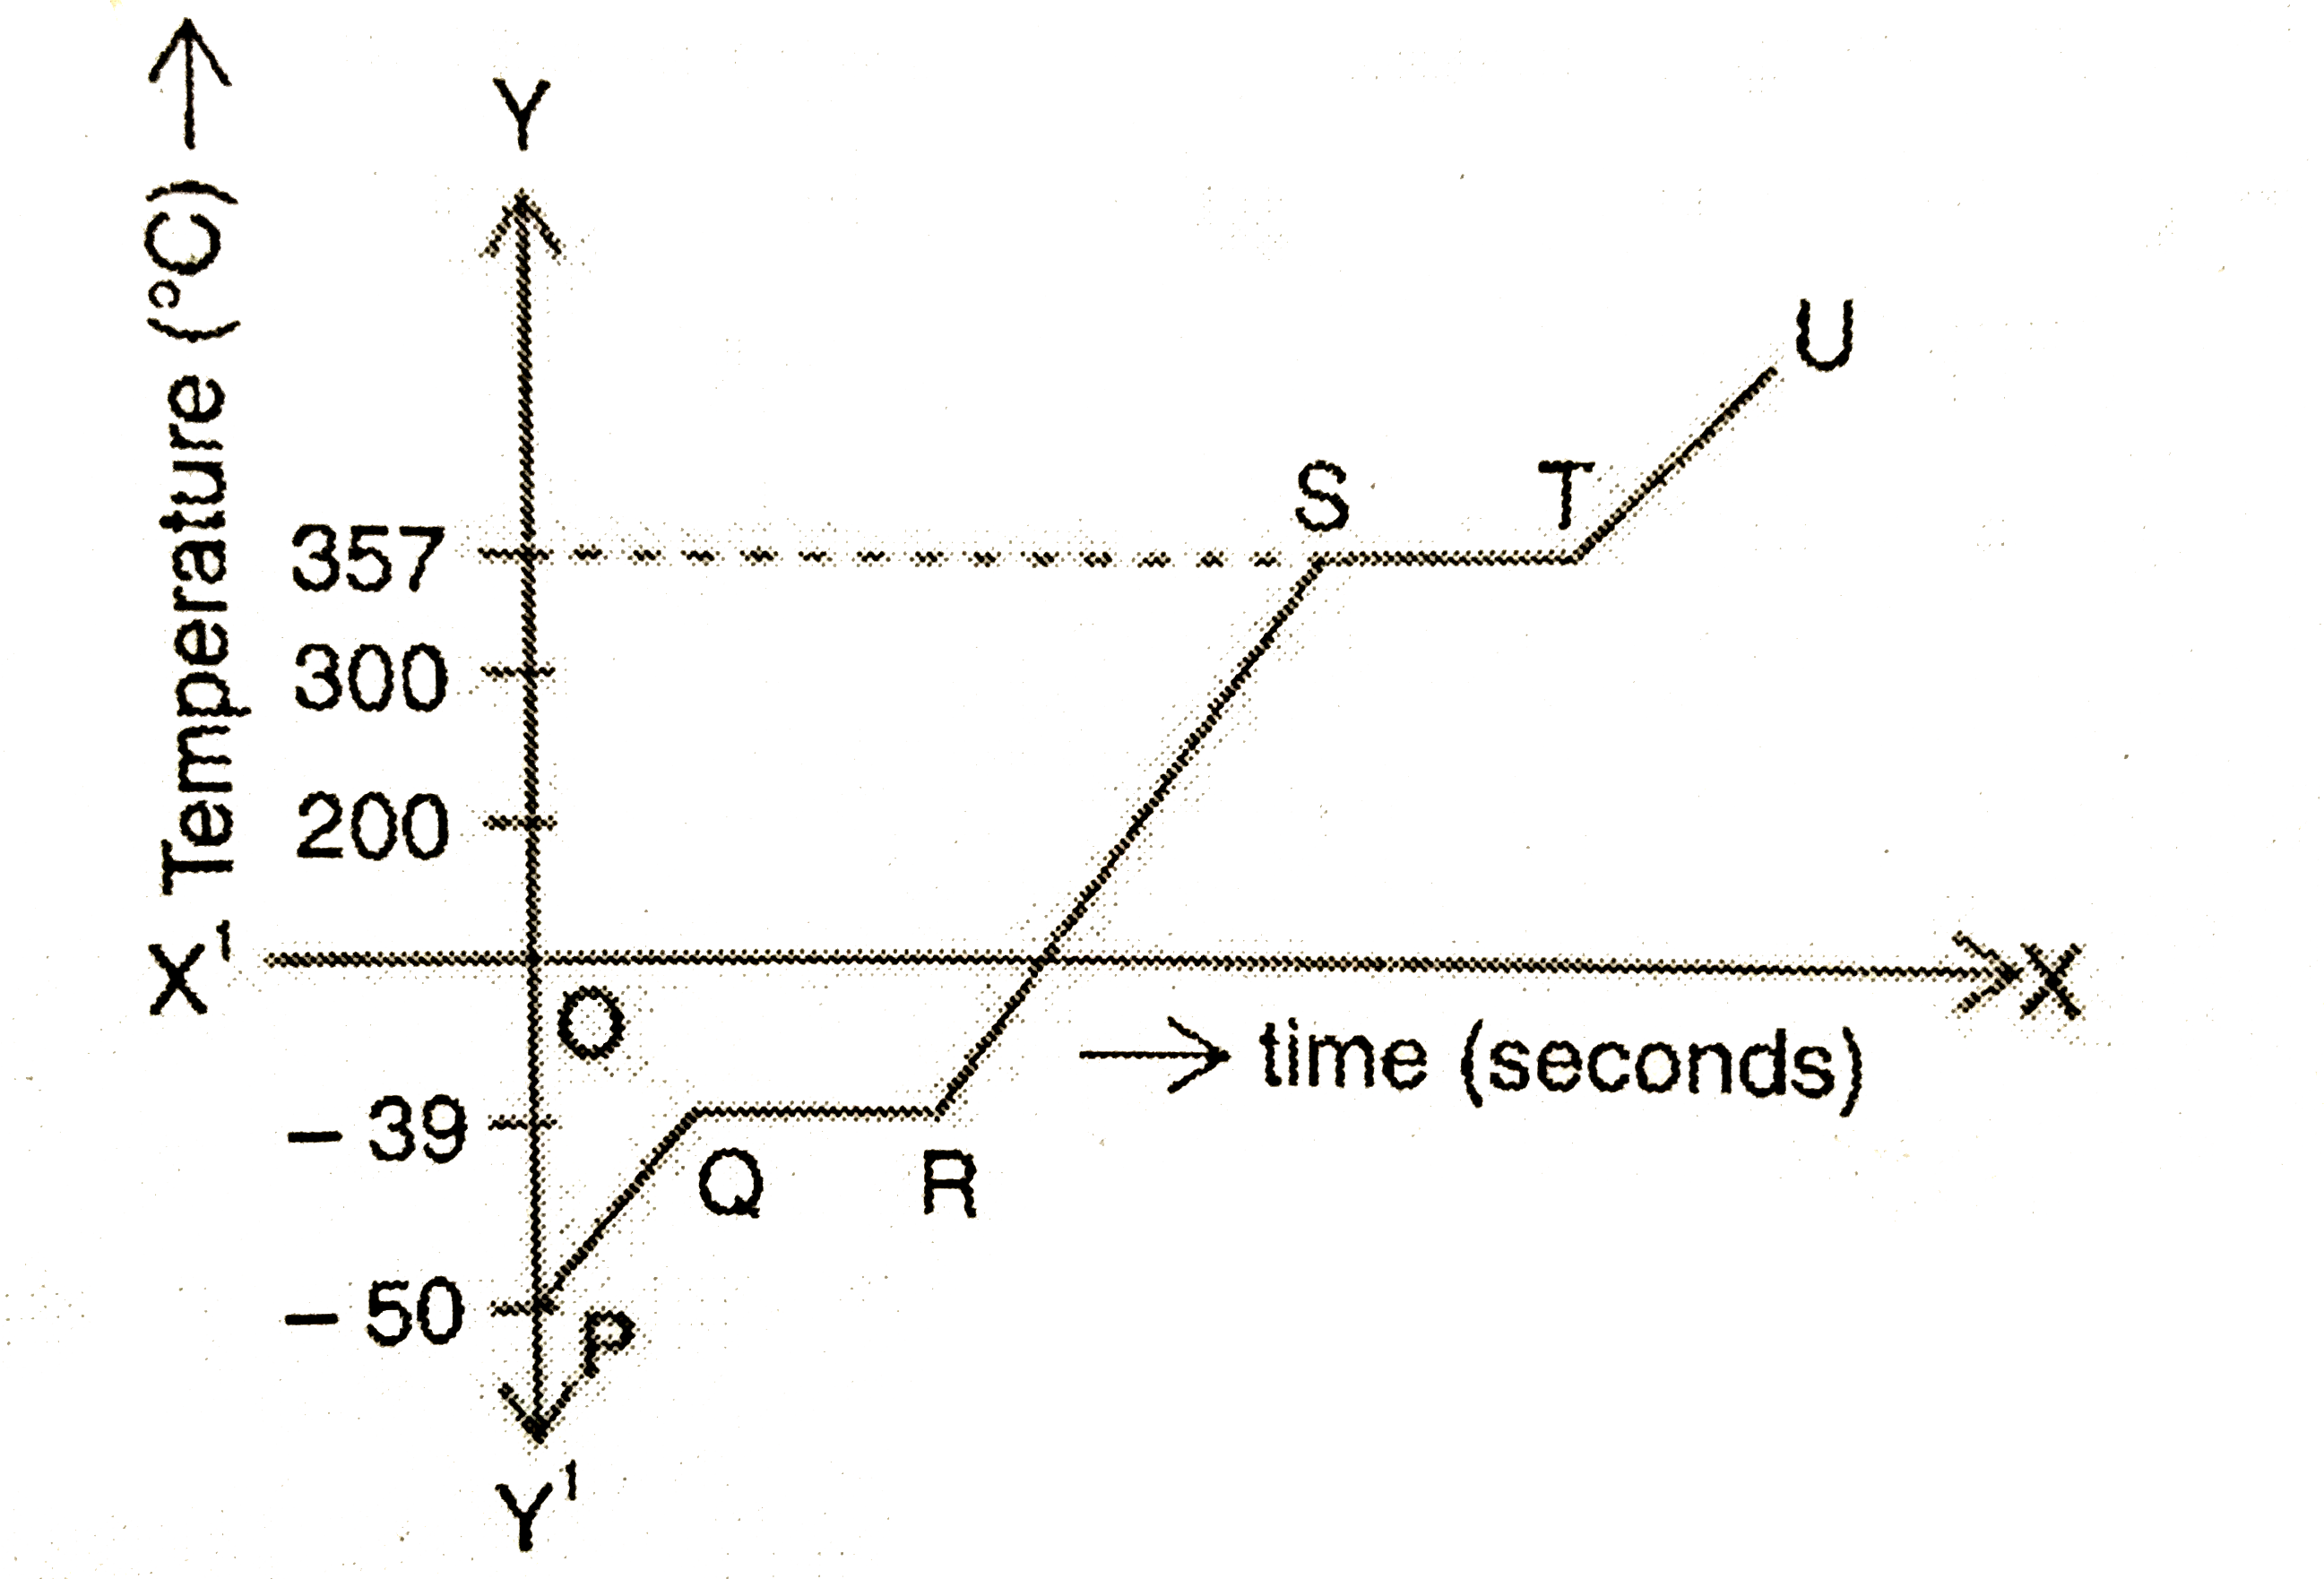
The porition QR of the graph indicatesAno change in heat energy.Bchange in temperature.Cchange of state.DBoth (b) and (c).
The heating curve of a paritcular substance in solid state is as shown in the figure .choose the correct alternative

The porition QR of the graph indicates
View SolutionThe heating curve of a particular substance in solid state is as shows in the figure.Choose the correct alternative
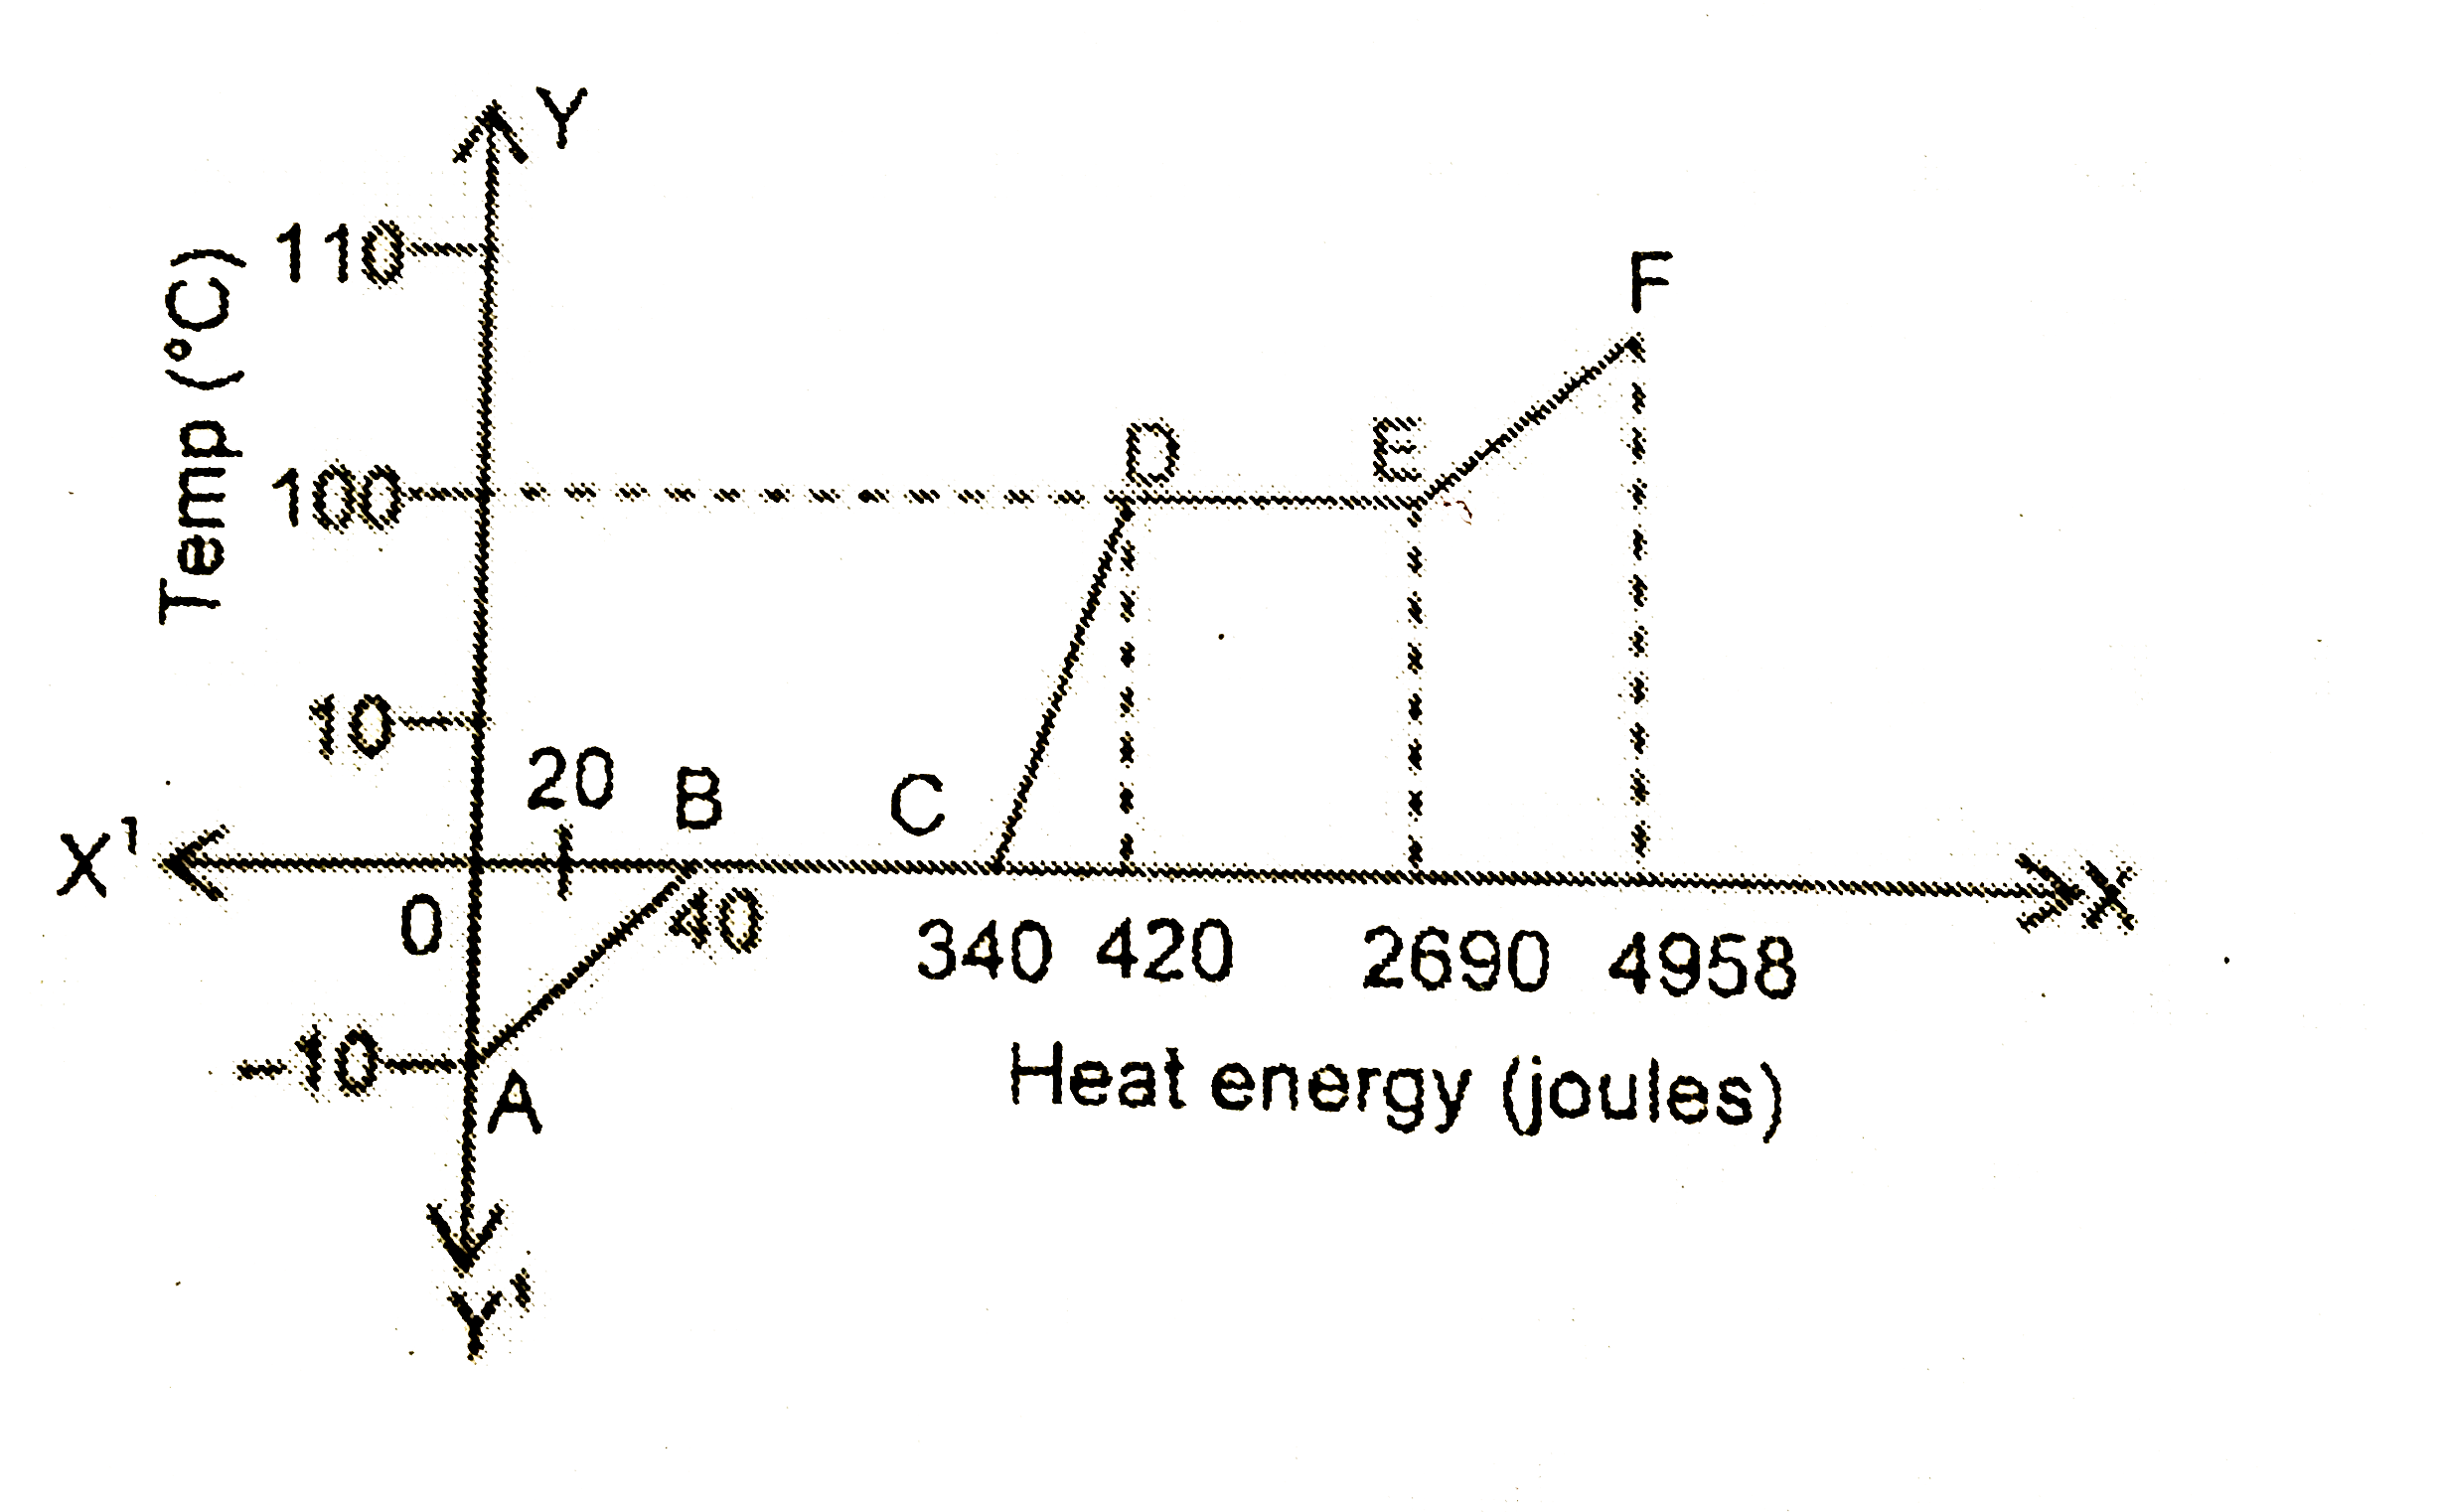
The change of state in the graph is represented by ________part.
View SolutionThe heating curve of a particular substance in solid state is as shows in the figure.Choose the correct alternative

The change of state in the graph is represented by ________part.
View SolutionThe heating curve of a particular substance in solid state is as shown in the figure .choose the correct alternative
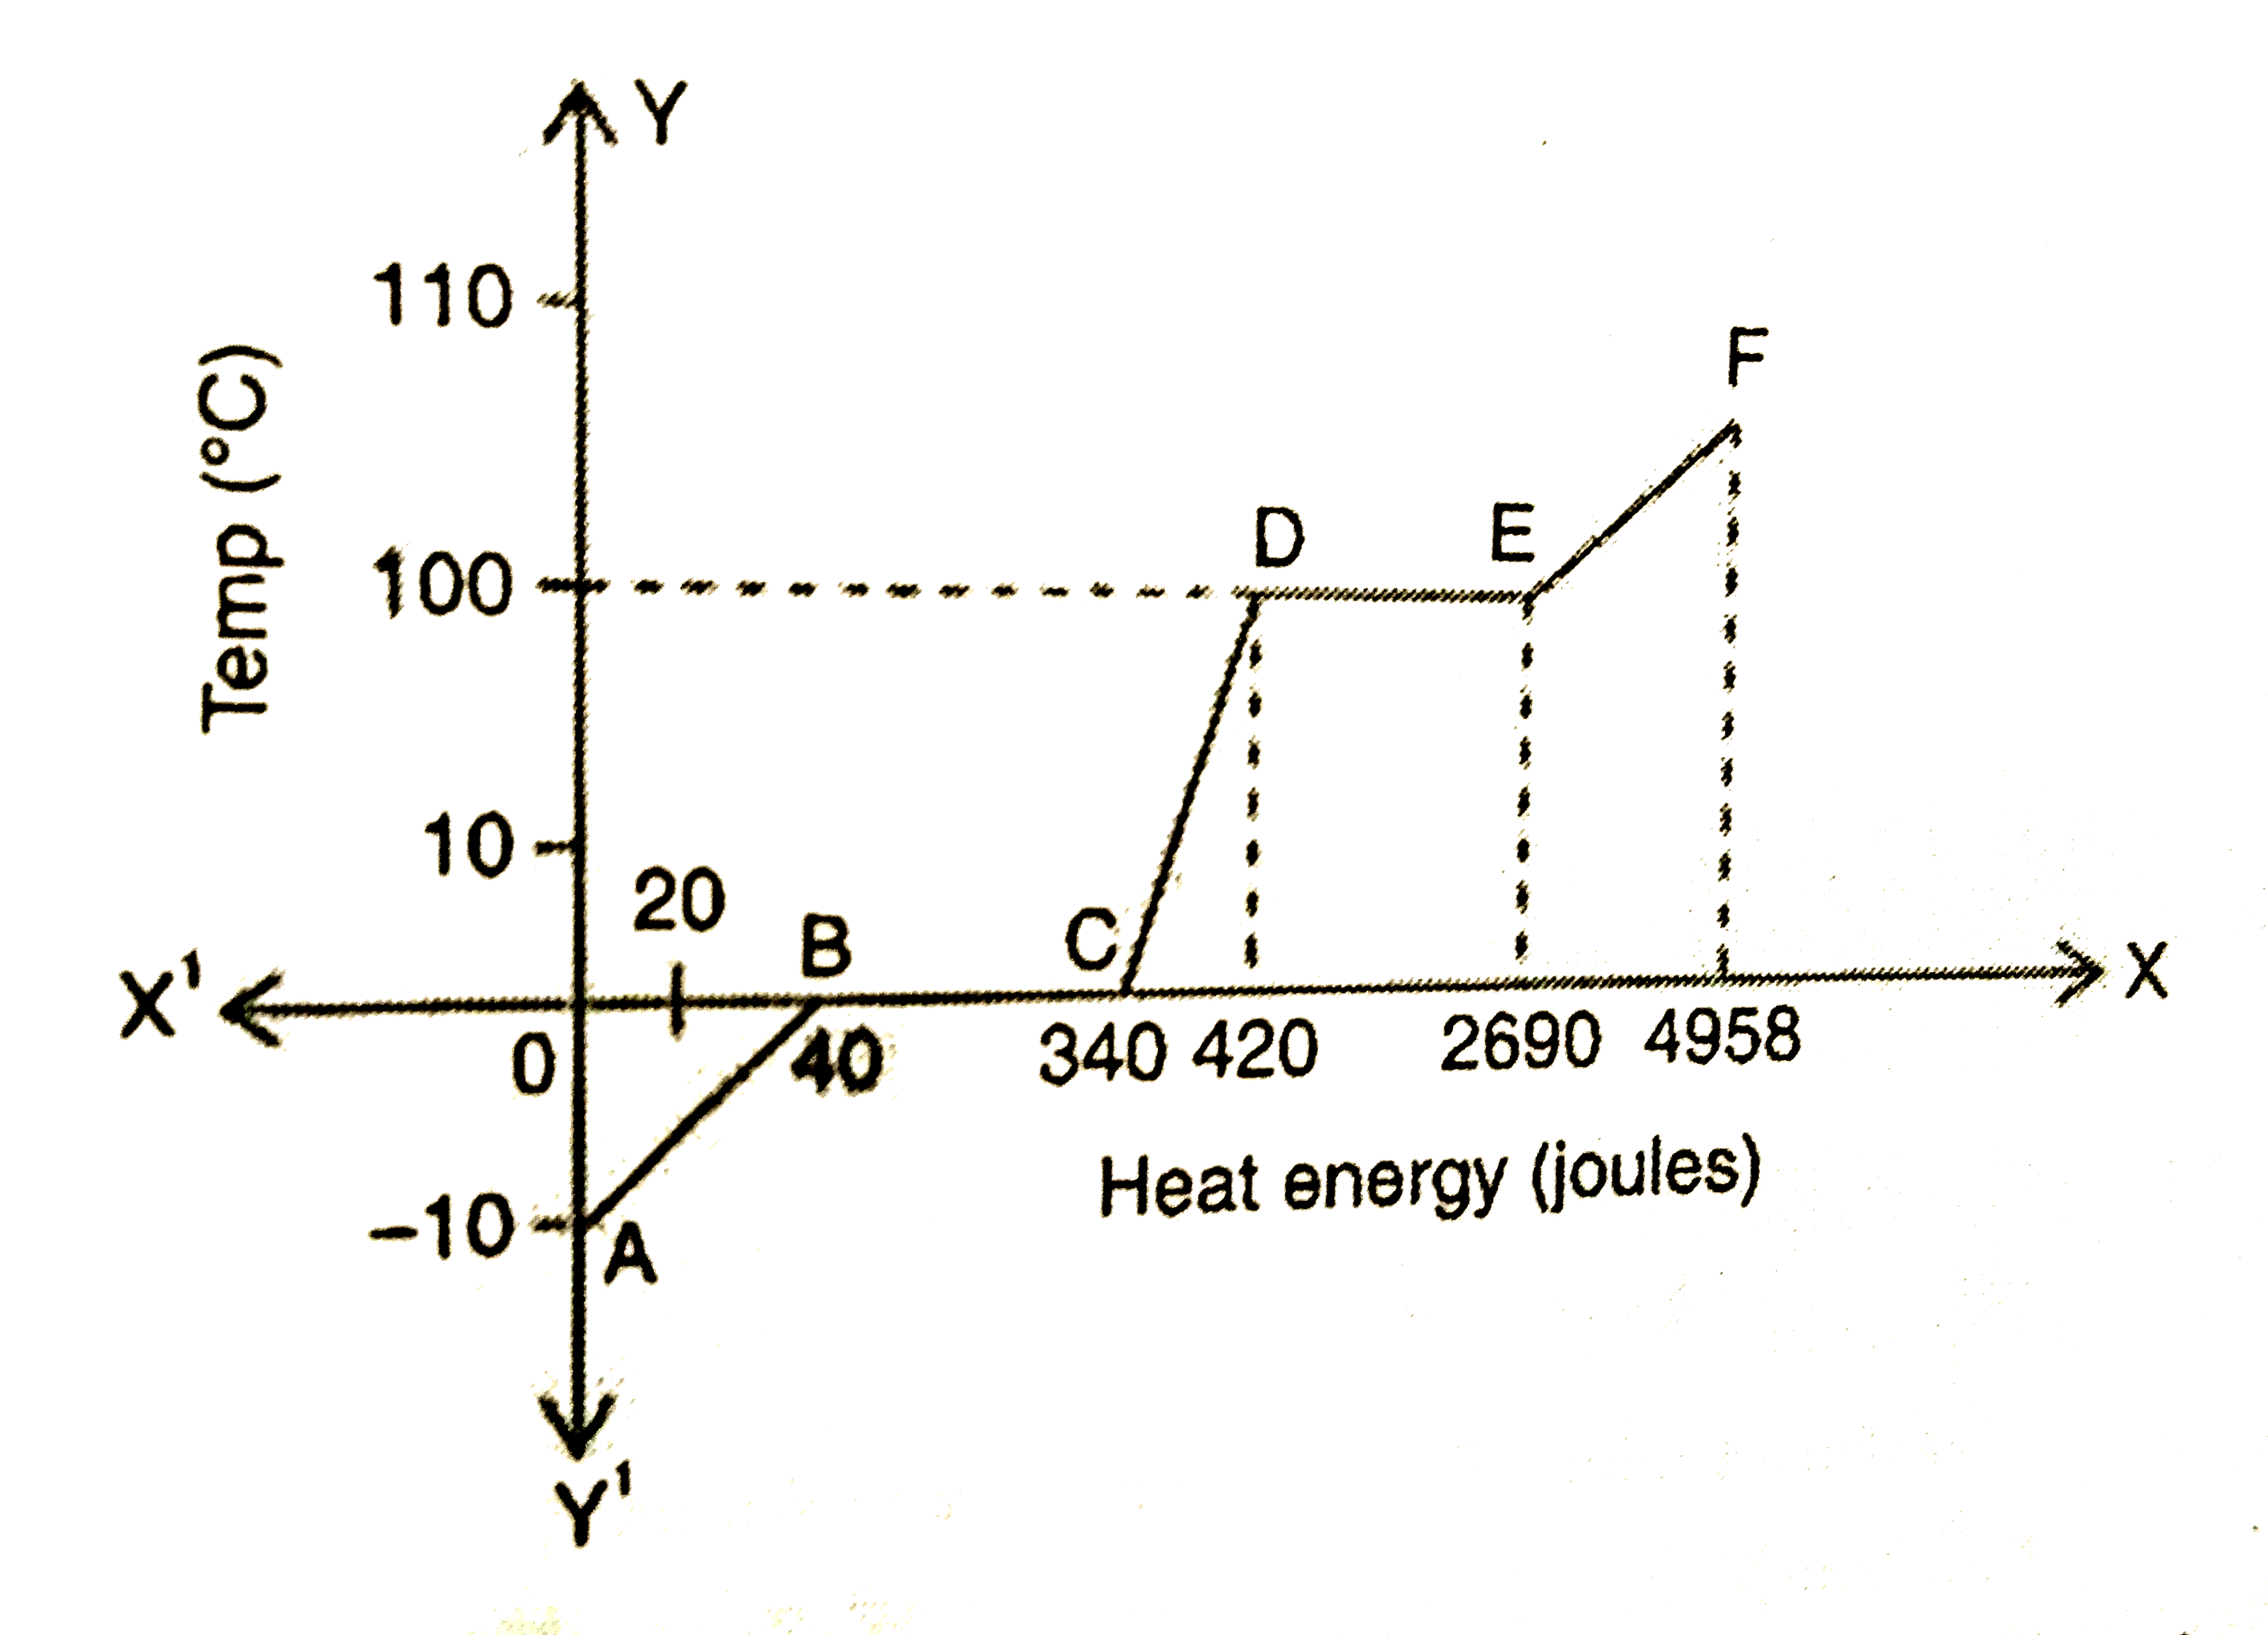
The change of state in the graph is represented by ________part.
View SolutionThe heating curve of a paritcular substance in solid state is as shown in the figure .choose the correct alternative

The porition QR of the graph indicates
View Solution

