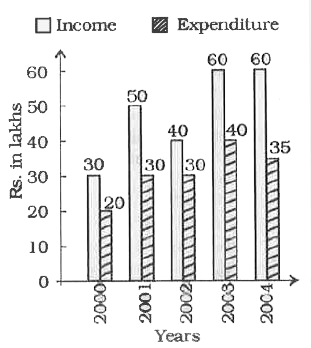
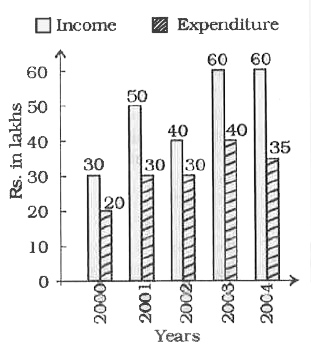
The graph shows Income and Expenditure of a company. Study the graph and answer the questions.
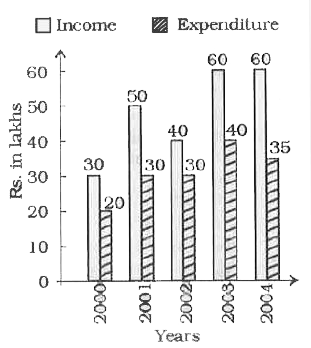
The difference in profit between 2001 and 2002 is
Rs. 25 lakhs
No difference
Rs. 10 lakhs
Rs. 20 lakhs
The correct Answer is:C
Step by step video & image solution for The graph shows Income and Expenditure of a company. Study the graph and answer the questions. The difference in profit between 2001 and 2002 is by Maths experts to help you in doubts & scoring excellent marks in Class 14 exams.
Updated on:21/07/2023Similar Questions
Knowledge Check
Study the following graph which shows income and expenditure of a company over the years 2005 - 2009 and answer the questions.
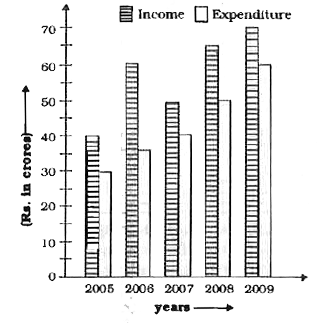
The differnce in profit (Rs. In crores) of the company during 2006 and 2007 isA10B15C20D25The bar diagram shows the monthly expenditure of a company. Study the graph and answer the questions.
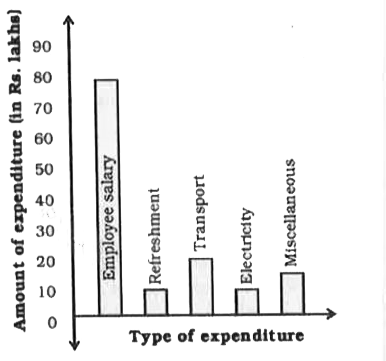
The fraction of money spent on refreshment is:A1312B227C110D10The bar diagram shows the monthly expenditure of a company. Study the graph and answer the questions.
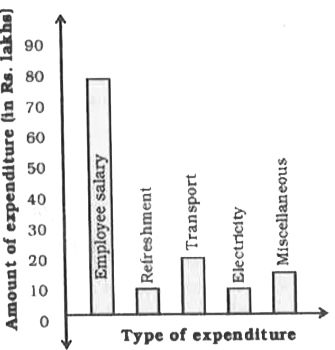
The percentage of money spent on miscellaneous isA7217B1727C1119D9111
The graph shows Income and Expenditure of a company. Study the graph and answer the questions.
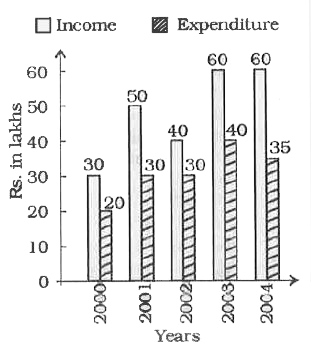
The income in 2002 was equal to the expenditure in the year
View SolutionThe graph shows Income and Expenditure of a company. Study the graph and answer the questions.
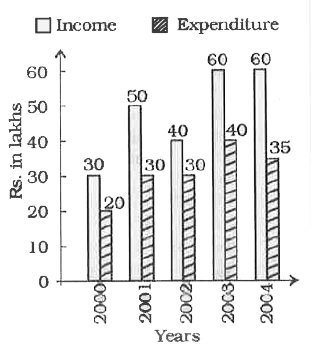
The number of years in which the income exceeds the average income is
View SolutionThe bar diagram shows the monthly expenditure of a company. Study the graph and answer the questions.
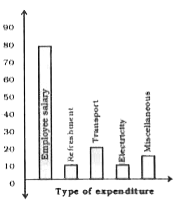
The percentage of money spent on miscellaneous is
View SolutionThe bar diagram shows the monthly expenditure of a company. Study the graph and answer the questions.
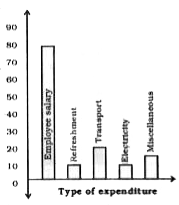
The fraction of money spent on refreshment is :
View SolutionThe bar diagram shows the monthly expenditure of a company. Study the graph and answer the questions.
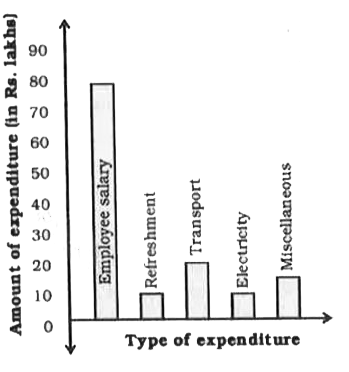
The ratio between expenditure on transport and employee salary on monthly basis is :
View Solution

