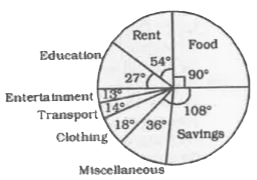
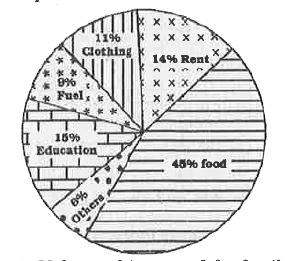
The pie chart given below shows the expenditure on various items and savings of a family during the year 2009. Study the pie chart and answer these questions.
 The percentage of the income which was spent on clothing, education of children and transport together is-
17%
20%
22%
27%
Step by step video & image solution for The pie chart given below shows the expenditure on various items and savings of a family during the year 2009. Study the pie chart and answer these questions. The percentage of the income which was spent on clothing, education of children and transport together is- by Maths experts to help you in doubts & scoring excellent marks in Class 14 exams.
Updated on:21/07/2023Topper's Solved these Questions
Similar Questions
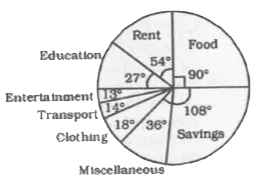
The pie chart, given here shows monthly expenses on various heads and savings of the family of Mr. Rao. Study the chart and answer the questions based on it.
What per cent of his income does Mr. Rao save?
View SolutionThe pie chart, given here shows monthly expenses on various heads and savings of the family of Mr. Rao. Study the chart and answer the questions based on it.
What per cent of his income does Mr. Rao spend on clothing, transport and entertainment combined together?
View Solution
Knowledge Check
The pie chart, given here shows monthly expenses on various heads and savings of the family of Mr. Rao. Study the chart and answer the querstions based on it.

What per cent of his income does Mr. Rao save?A25%B30%C3313%D36%The pie chart, given here shows monthly expenses on various heads and savings of the family of Mr. Rao. Study the chart and answer the questions based on it.
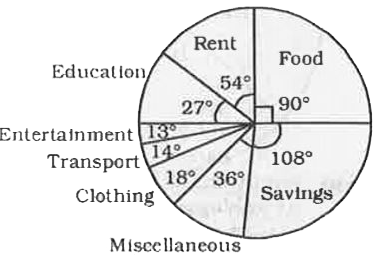
What per cent of his income, does Mr. Rao spend on clothing, transport and entertainment combined together ?A3312%B27%C25%D1212%The pie chart given here shows the spendings of a country on various sports during a particular year. Study the chart carefully and answer the questions given below:
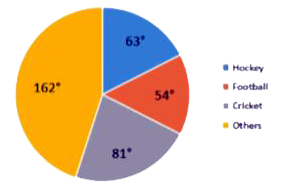
What percent of the total spendings is spent on others?A12.5%B45%C25%D22.5%
The pie chart, given here shows monthly expenses on various heads and savings of the family of Mr. Rao. Study the chart and answer the questions based on it.
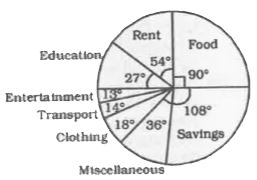
The amount spent on food exceeds the total amount spent on education and clothing by
View SolutionThe pie chart, given here shows monthly expenses on various heads and savings of the family of Mr. Rao. Study the chart and answer the questions based on it.
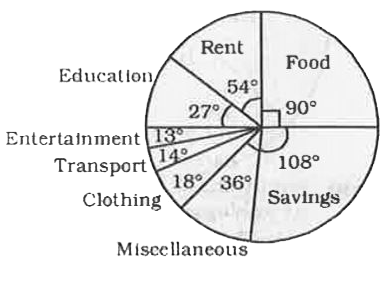
The amount spent on food exceeds the total amount spent on education and clothing by
View SolutionThe pie chart drawn below shows the spendings of a country on various sports during a particular year. Study the pie chart and answer the questions.
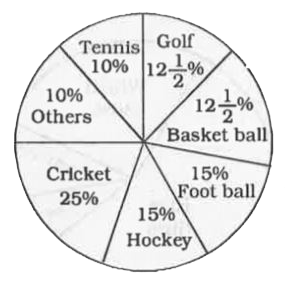
Total central angle showing the money spent on hockey, football and other during the year was
View SolutionThe pie chart shows the breakup of expenditure of a manufacturing company for the year 2017. Study the diagram and answer the following questions.
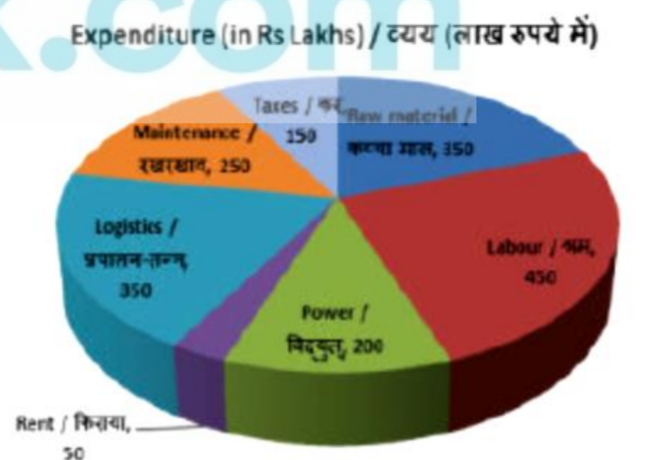
The second highest expenditure is for which item?
View SolutionThe pie chart given below shows the spendings of a family on various heads during a month. Study the graph and answer the questions
Expenditure on Rent is what percent of expenditure on Fuel?
View Solution
