During the period 1989−94, which type of cars had a continuous increase in production?
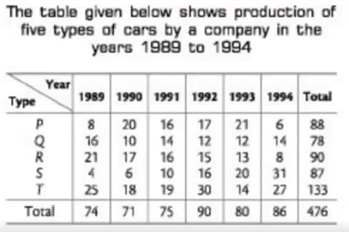
P
Q
R
S
The correct Answer is:D
Step by step video, text & image solution for During the period 1989 - 94, which type of cars had a continuous increase in production? by Maths experts to help you in doubts & scoring excellent marks in Class 14 exams.
Topper's Solved these Questions
- BOOK - ARIHANT SSCCHAPTER - DATA TABLE EXERCISE - HIGHER SKILL LEVEL QUESTIONS25videos
DATA TABLE
- BOOK - ARIHANT SSCCHAPTER - DATA TABLE EXERCISE - HIGHER SKILL LEVEL QUESTIONS25videos
DATA TABLE
- BOOK - ARIHANT SSCCHAPTER - DATA SUFFICIENCYEXERCISE - FAST TRACK PRACTICE30videos
DATA SUFFICIENCY
- BOOK - ARIHANT SSCCHAPTER - DISCOUNTEXERCISE - FAST TRACK PRACTICE47videos
DISCOUNT
Similar Questions
Knowledge Check
- Question 1 - Select One
The table given here shows production of five types of cars by a company in the year 1989 to 1994. Study the table and answer questions
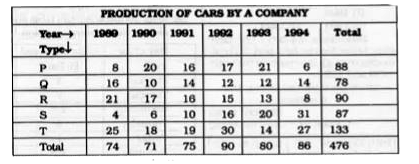
During the period 1989-94, in which type of cars was a continuous increase in production?APBQCRDS - Question 2 - Select One
Which cost increases continuously with increase in production ?
AAverage costBMarginal costCVariable costDFixed cost - Question 3 - Select One
Which cost increases continuously with the increase in production?
AAverage cost.BMarginal cost.CFixed cost.DVariable cost
Examine the following graph carefully and answer the questions given below it :
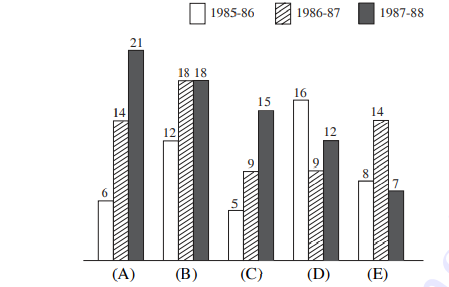
In which states is there a steady increase in the production of cotton during the given period ?View SolutionDuring the period 1960 to 2000 , rice production increased from
View SolutionDuring the period 1960 to 2000, wheat production increased from
View SolutionThe table given here shows production of five types of cars by a company in the year 1989 to 1994. Study the table and answer questions
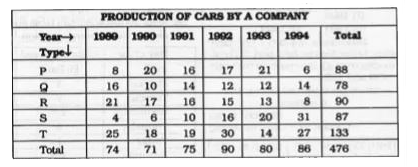
The production of which type of car was 25% of the total production of all types of cars during 1993?View SolutionThe table shows in the production of different types of cars
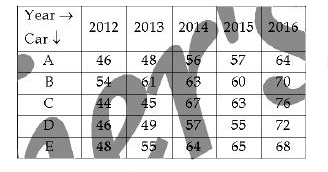
IF the data related to the production of type E cars is represented by a pie chart, then the central angle of the sector representing production of cars in 2013 will be:View Solution

