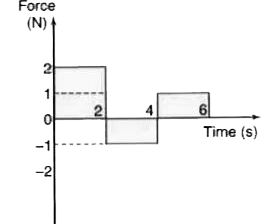
A force time graph for the motion of a body is shown in Fig. Change in linear momentum between 0 and 8s is

A
zero
B
4 N-s
C
8 Ns
D
None of these
Text Solution
The correct Answer is:A
Change in momentum = Force × time=Area which of the force- time curve encloses with time axis.
|
Topper's Solved these Questions
- LAWS OF MOTIONBOOK - DISHA PUBLICATIONCHAPTER - LAWS OF MOTIONEXERCISE - Exercise-1: Concept Builder (Topicwise) (Topic 3: Equilibrium of Forces, Motion of Connected Bodies and Pulley )
12 Videos
- LAWS OF MOTIONBOOK - DISHA PUBLICATIONCHAPTER - LAWS OF MOTIONEXERCISE - Exercise-1: Concept Builder (Topicwise) (Topic 4: Friction )
10 Videos
- LAWS OF MOTIONBOOK - DISHA PUBLICATIONCHAPTER - LAWS OF MOTIONEXERCISE - Exercise-1: Concept Builder (Topicwise) (Topic 1: I, Il & illrd Laws of Motion)
14 Videos
- JEE MAINS- 2019 (HELD ON :9TH APRIL 2019 (SHIFT-I))BOOK - DISHA PUBLICATIONCHAPTER - JEE MAINS- 2019 (HELD ON :9TH APRIL 2019 (SHIFT-I))EXERCISE - QUESTIONS
30 Videos
- MAGNETISM AND MATTERBOOK - DISHA PUBLICATIONCHAPTER - MAGNETISM AND MATTEREXERCISE - EXERCISE-2:CONCEPT APPLICATOR
31 Videos
Similar Questions
Knowledge Check
A force-time graph for the motion of a body is shown in fig. change in linear momentum between 0 and 8 s is:-
 AZeroB4N-sC8NsDNone
A force-time graph for the motion of a body is shown in figure. Change in linear momentum between 0 and 8 s is:
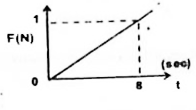 AZeroB4 N-sC8 NsDNone of these
A force time graph for the motion of a body is as shown in Change in linear momentum between 0 and 6s is
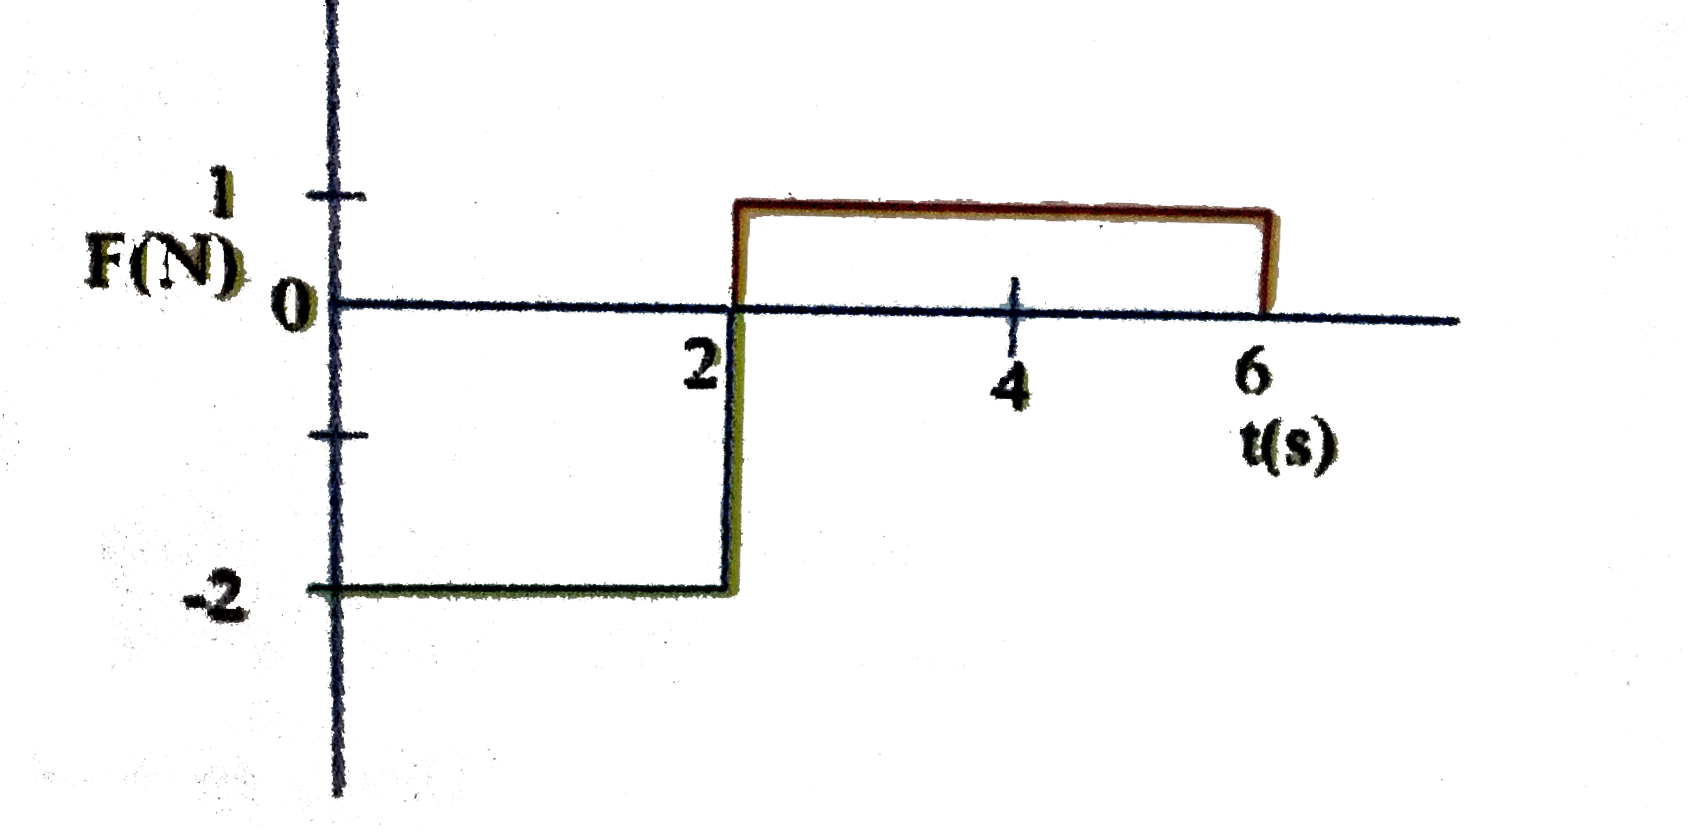 .AzeroB8NsC4NsD2Ns
A force lime graph for the motion of a body is as shown in figure. Change in linear momentum between 0 and 6s is:

View SolutionForce-time graph of a particle of mass 6 kg is shown in figure, then change in linear momentum during t = 0 to t = 10 s is
View SolutionA force time graph for the motion of a body is as shown in figure. Change in linear momentum between 0 and 6s is
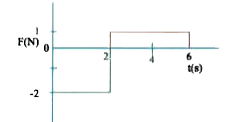
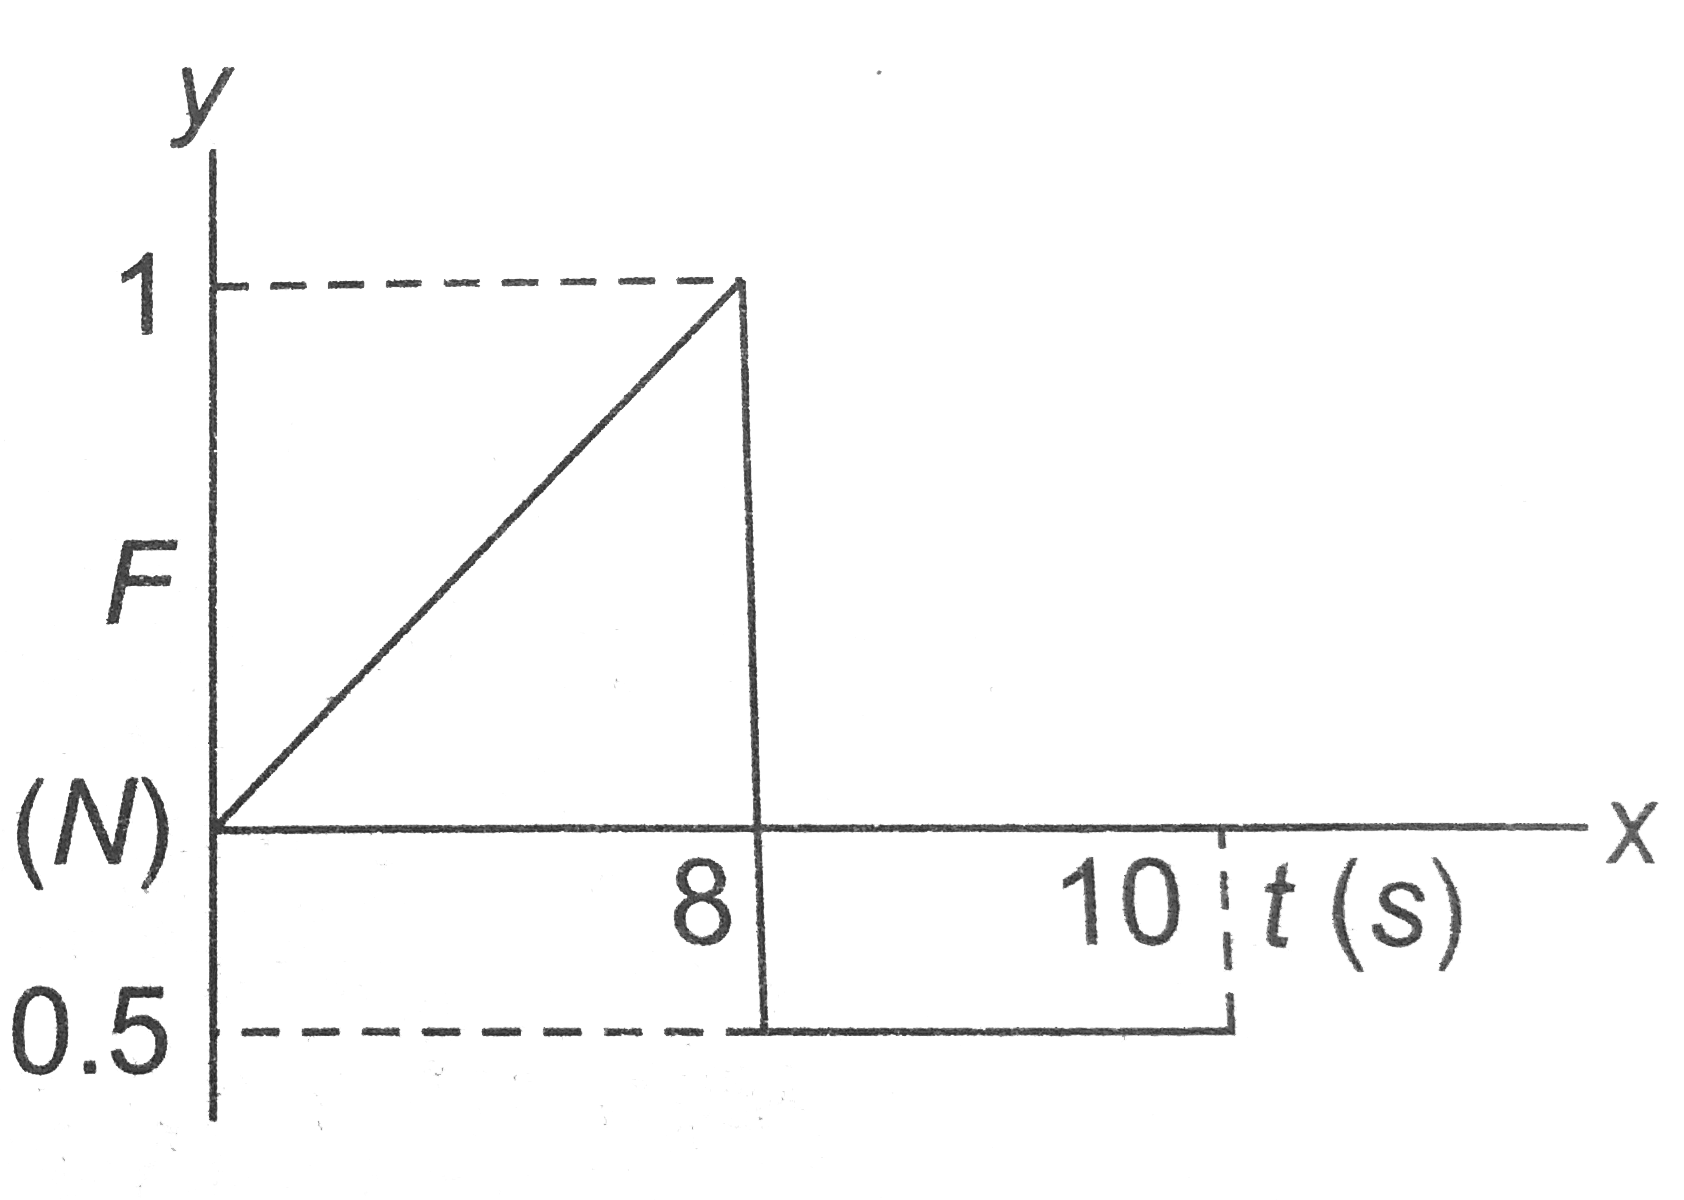
View SolutionA force-time graph for the motion of a body is shown in the figure. The change in the momentum of the body between zero and 10sec is
View SolutionA force-time graph for a linear motion is shown in figure. The linear momentum gained between 0 and 6 second is
View Solution
