Force-time graph of a particle of mass 6 kg is shown in figure, then change in linear momentum during t = 0 to t = 10 s is
25 N s
75 N s
15 N s
−75Ns
Step by step video & image solution for Force-time graph of a particle of mass 6 kg is shown in figure, then change in linear momentum during t = 0 to t = 10 s is by Physics experts to help you in doubts & scoring excellent marks in Class 12 exams.
Updated on:21/07/2023Topper's Solved these Questions
Similar Questions
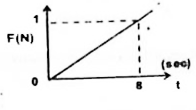
A force-time graph for the motion of a body is shown in figure. Change in linear momentum between 0 and 8 s is:
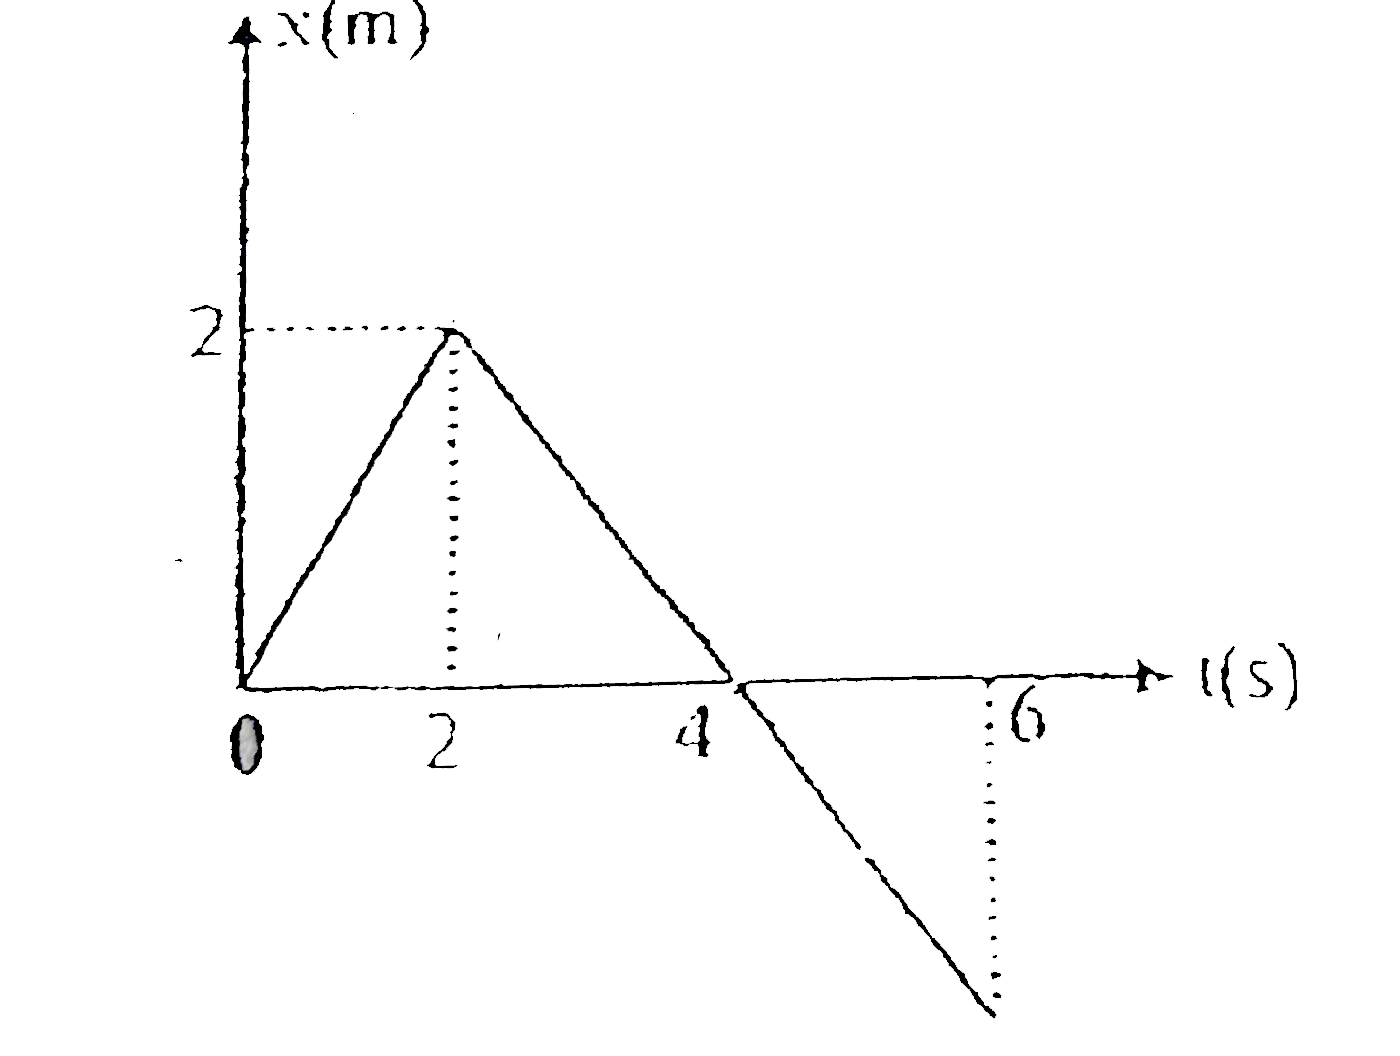
View SolutionPosition time graph of a particle of mass 2 kg is shown in figrure. Total work done on the particle from t=0 to t=4s is
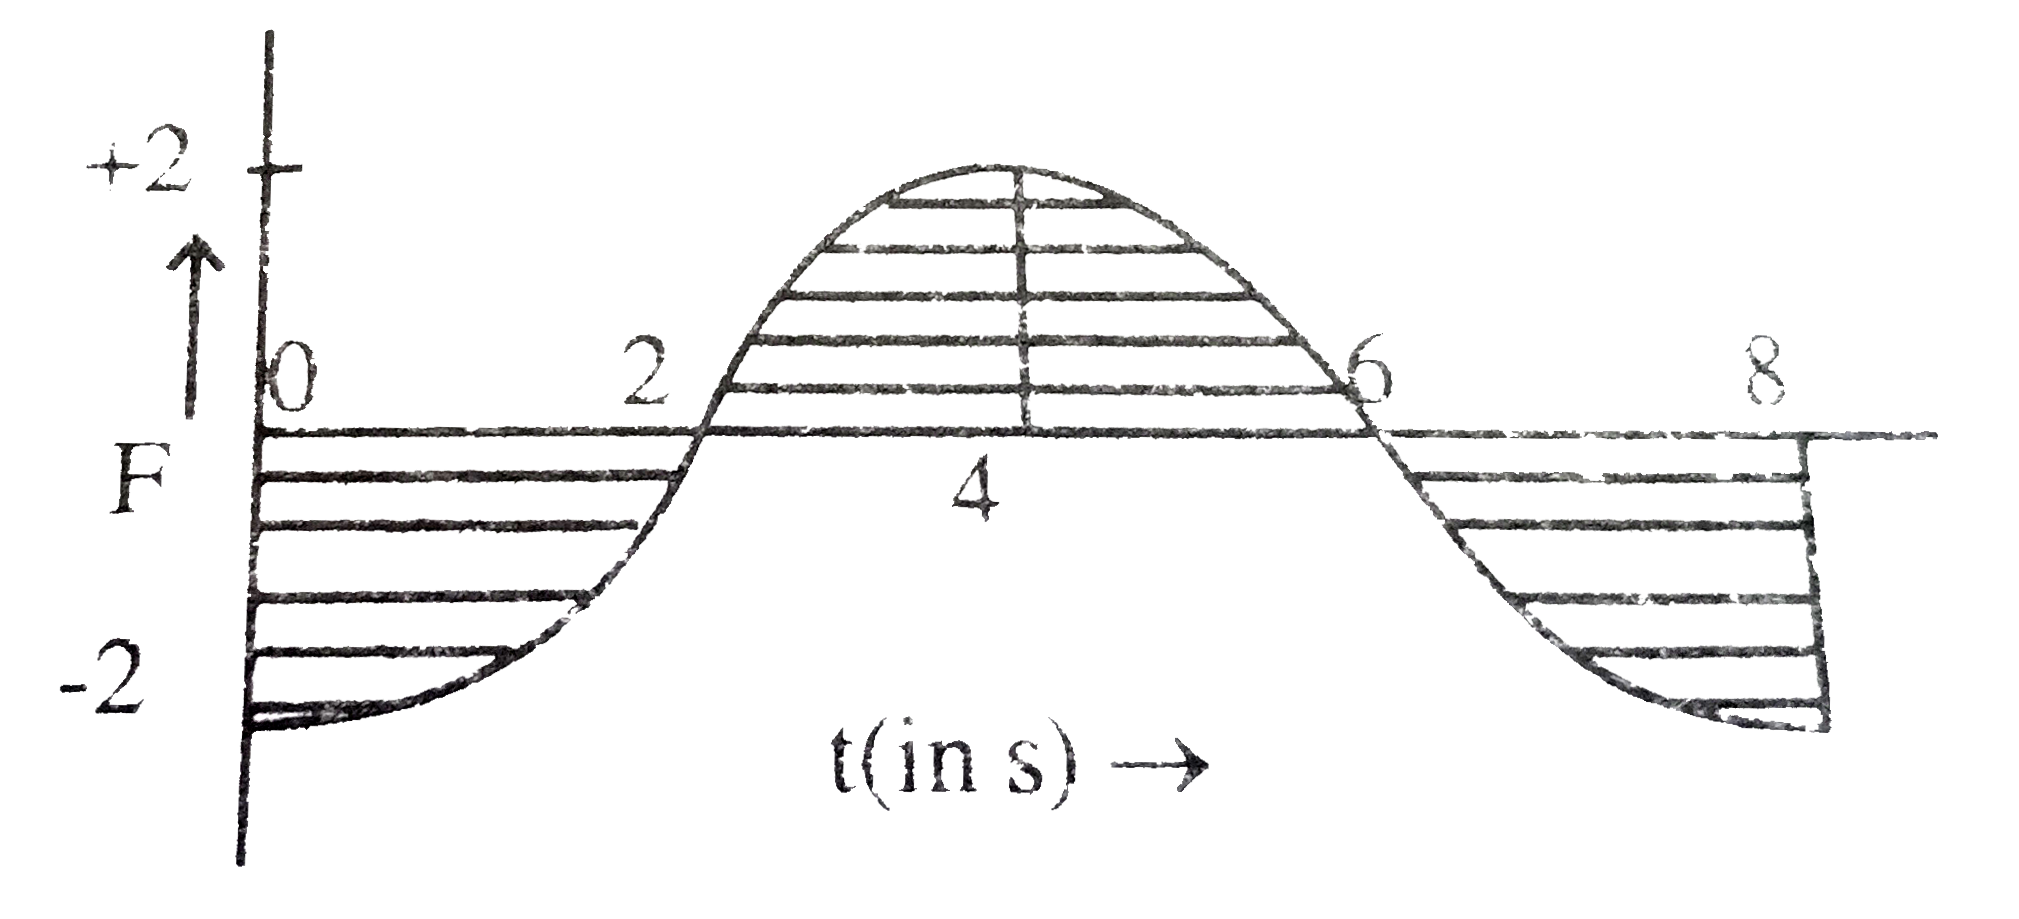
View SolutionA force-time graph for the motion of a body is shown in fig. change in linear momentum between 0 and 8 s is:-
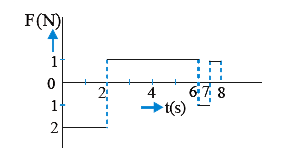
View SolutionA force-time graph for the motion of a body is shown in fig. Change in linear momentum between 0 and 8s is :
View SolutionVelocity-time graph of a particle moving in a straight line is shown in figure. In the time interval from t=0 to t=14s, find
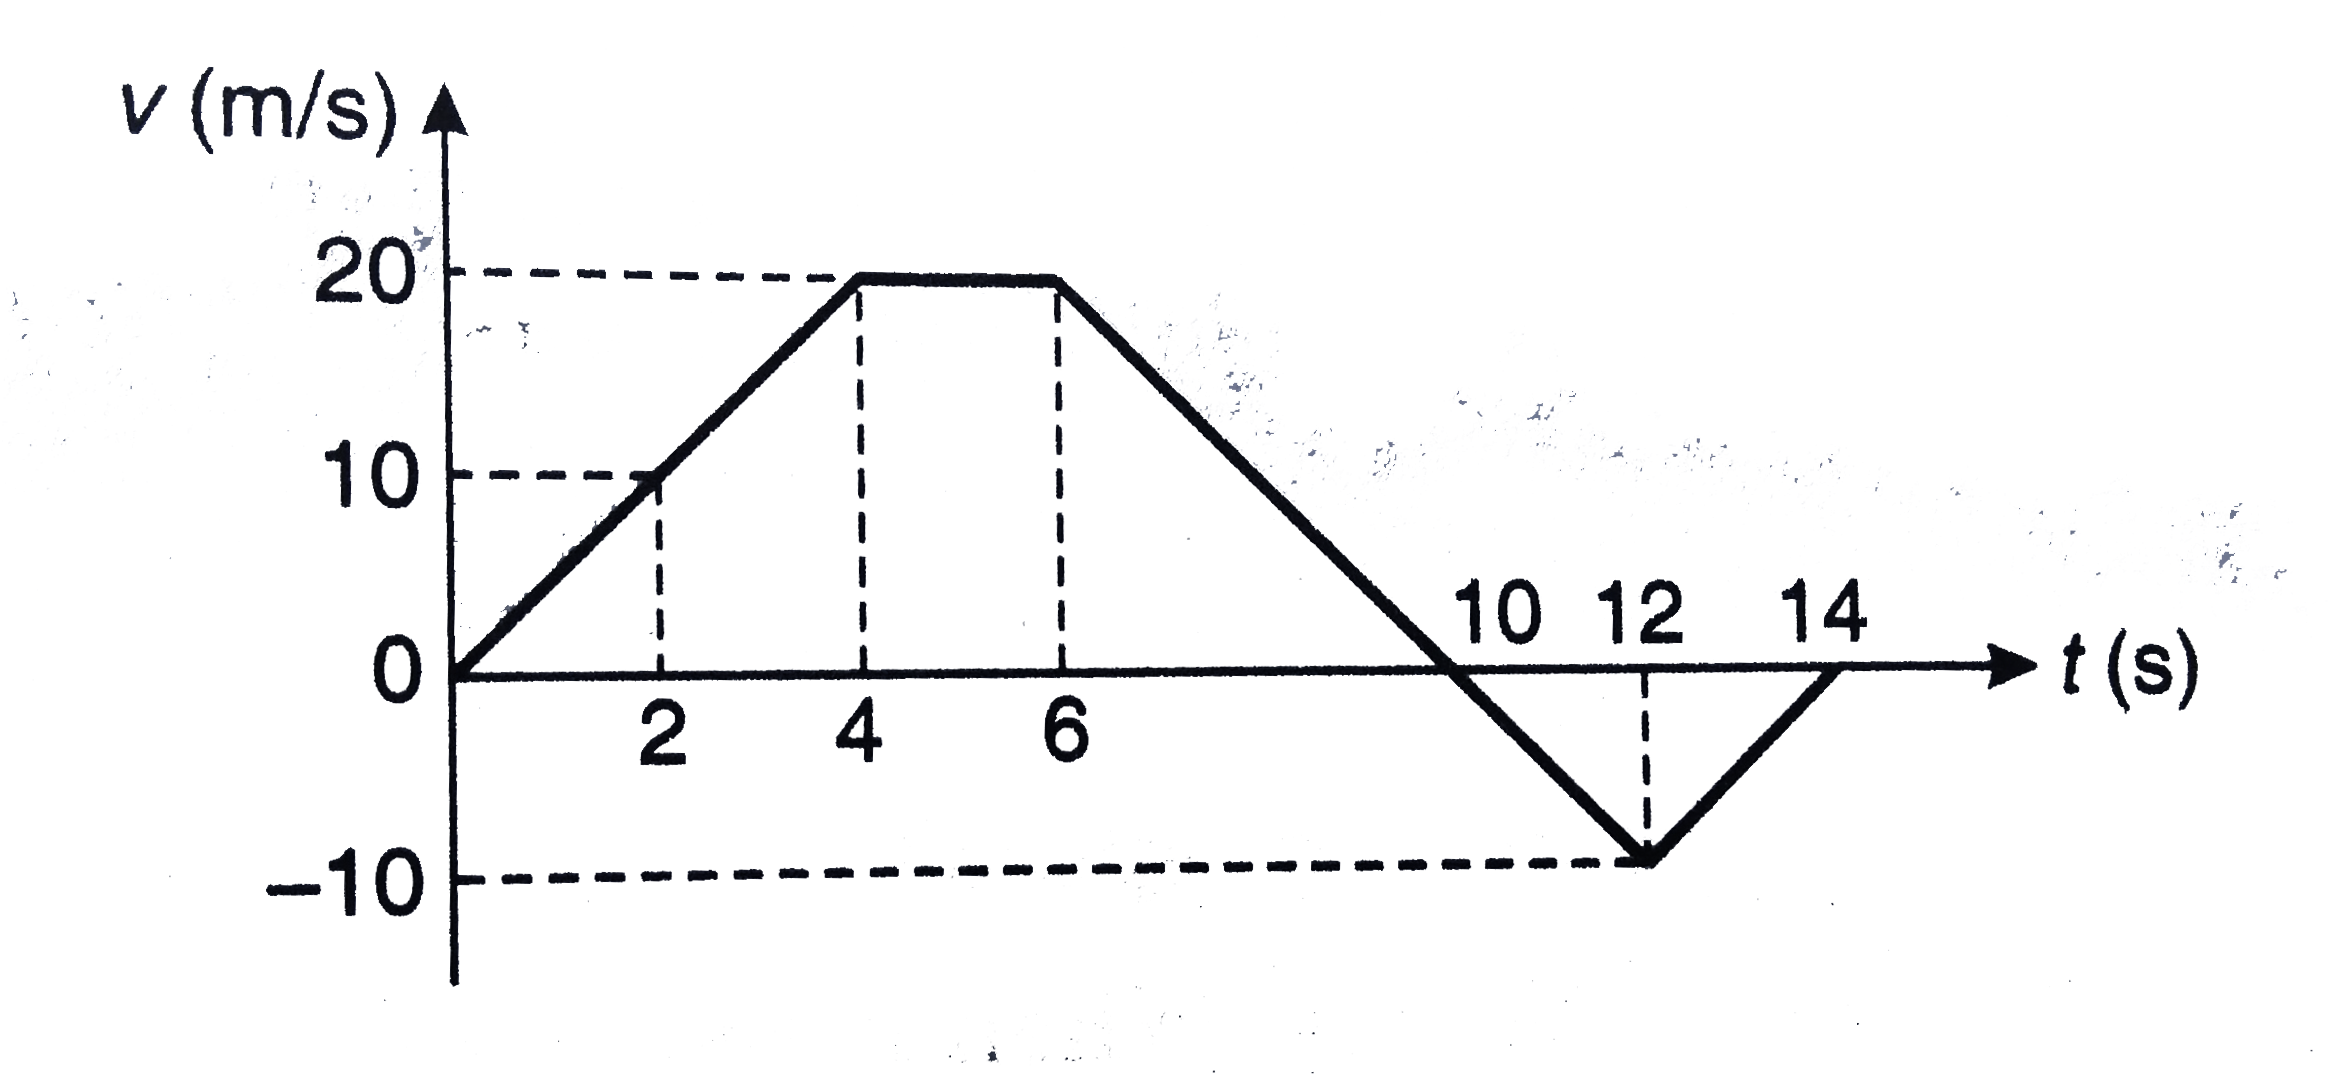
(a) average velocity and
(b) average speed of the particle.
View SolutionA force lime graph for the motion of a body is as shown in figure. Change in linear momentum between 0 and 6s is:

View SolutionThe force acting on a particle of mass 20 kg is indicated by force - time graph as shown in figure. The magnitude of change in linear momentum of particle during time interval 0 to 6 second is
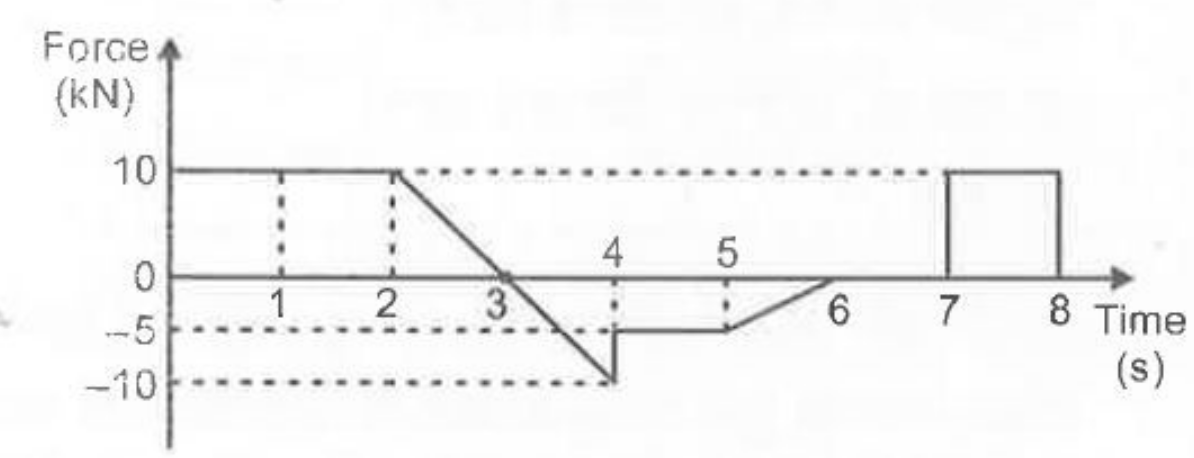
View SolutionThe force(F) acting on a particle of mass m changing with time(t) is as shown in (F−t) graph. The change in linear momentum from t=0 to t=6 s (in kN s) is

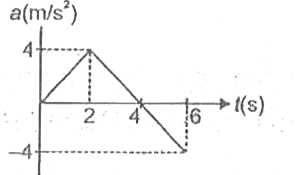
View SolutionFor the acceleration - time (a - t) graph shown in figure, the change in velocity of particle from t = 0 to t = 6 s is
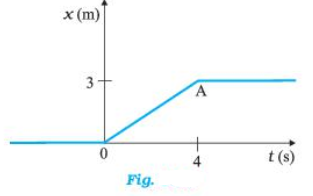
View SolutionFig. shows the position-time graph of a particle of mass 4 kg. What is the (i) force acting on the particle for t<0,t<4s,0<t<4s? (ii) impulse at t = 0 and t = 4 s? Assume that the motion is one dimensional.
View Solution
