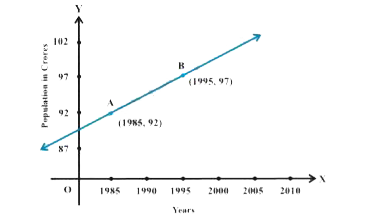
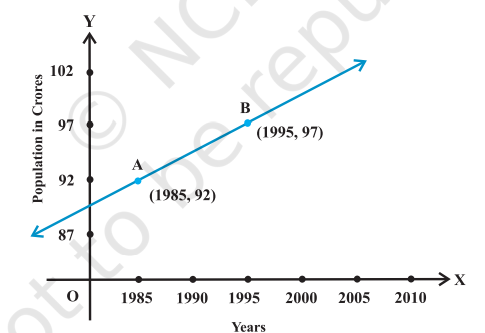
Consider the following population and year graph (Fig 10.10), find the slope of the line AB and using it, find what will be the population in the year 2010?
 Solution in Telugu
The correct Answer is:12,104.5 Crores
Step by step video, text & image solution for Consider the following population and year graph (Fig 10.10), find the slope of the line AB and using it, find what will be the population in the year 2010? by Maths experts to help you in doubts & scoring excellent marks in Class 11 exams.
Updated on:21/07/2023Topper's Solved these Questions
- STRAIGHT LINESBOOK - NCERT TELUGUCHAPTER - STRAIGHT LINESEXERCISE - EXERCISE 10.2
20 Videos
- STRAIGHT LINESBOOK - NCERT TELUGUCHAPTER - STRAIGHT LINESEXERCISE - EXERCISE 10.3
18 Videos
- STRAIGHT LINESBOOK - NCERT TELUGUCHAPTER - STRAIGHT LINESEXERCISE - Miscellaneous Exercise on Chapter 10
24 Videos
- STATISTICSBOOK - NCERT TELUGUCHAPTER - STATISTICSEXERCISE - Miscellaneous Exercise On Chapter 15
7 Videos
- TRIGONOMETRIC FUNCTIONS BOOK - NCERT TELUGUCHAPTER - TRIGONOMETRIC FUNCTIONS EXERCISE - MISCELLANEOUS EXAMPLES
10 Videos
Similar Questions
Write the equations for the x-and y-axes.
View SolutionWrite the following in the standard notation
100×6+10×5+3
View SolutionWrite the place of numbers underlined?
12–37–2–
View SolutionExpress each of the following decimals in the pq form
62.2
View SolutionProve that
2cosπ13cos9π13+cos3π13+cos5π13=0
View SolutionConsider the following population and year graph, find the slope of the line AB and using it, find what will be the population in the year 2010?

View SolutionConsider the following population and year graph: find the slope of the line AB and using it find what will be the population in the year 2010.
View SolutionDetermine the point of symmetry of a regular hexagon.
View SolutionMatch the following Column A to Column B

View SolutionMatch the following Column A to Column B

View SolutionThe inequation represented by the graph given below is :
View SolutionThe inequation that best describes the graph given below is _________
View SolutionThe inequation that best describes the following graph is _________
View SolutionIn Fig, find the value of x.
ltimg src="https://d10lpgp6xz60nq.cloudfront.net/physics_images/PS_MATH_IX_C12_S01_032_Q01.png" width="80%"gt
View SolutionConsider the following population and year graph. Find the slope of the line AB and using it, find what will be the population in the year 2010?
View Solution
