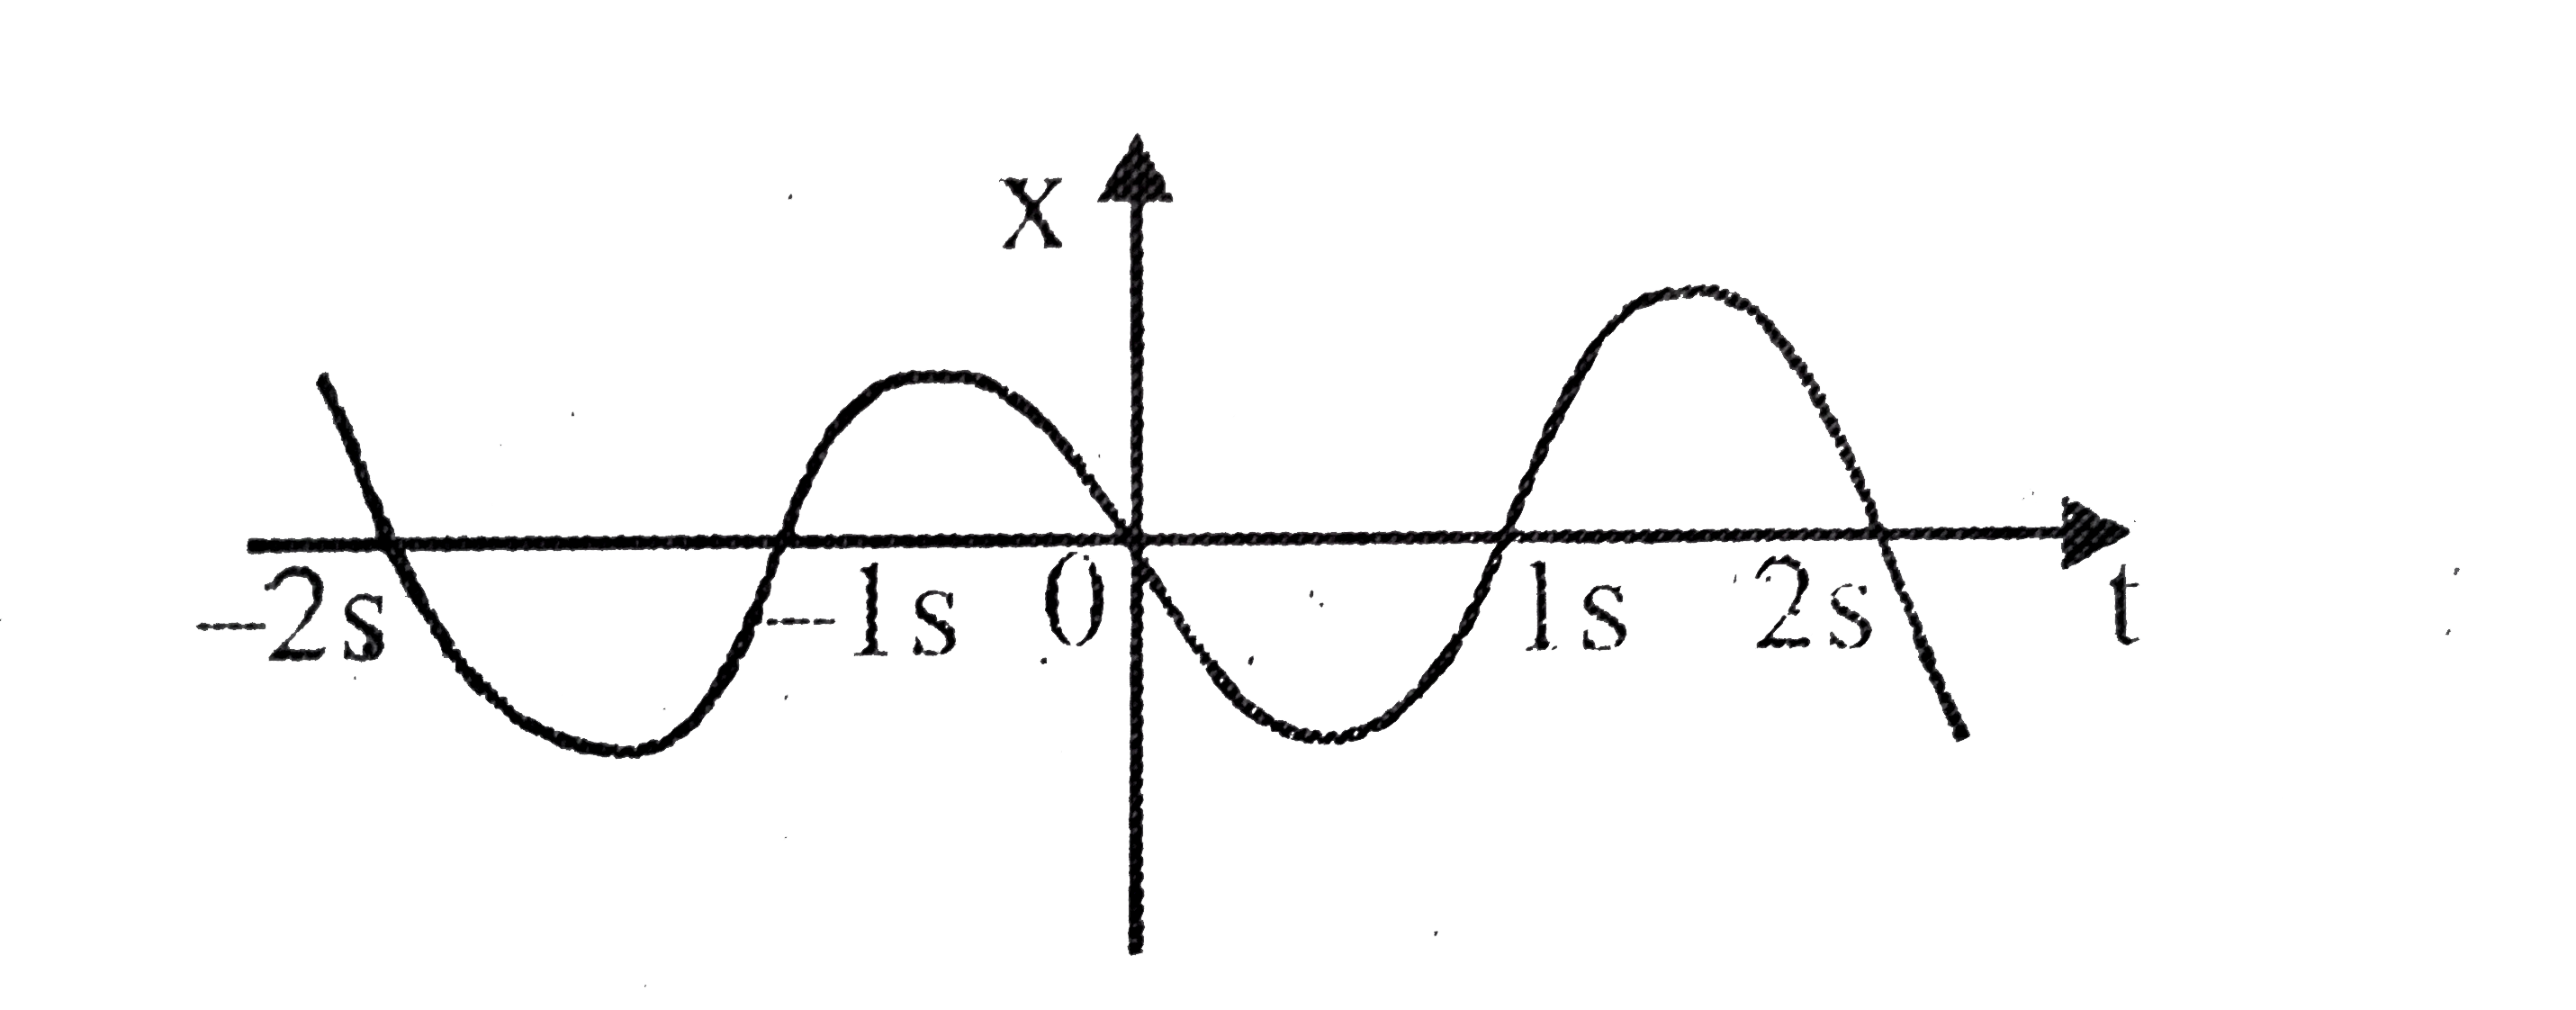
Figure. gives the x-t plot of a particle in one-dimensional motion. Three different equal intervals of time are shown. In which interval is the average speed greatest, and in which is it the least ? Give the sign of average velocity for each interval.
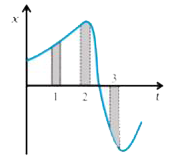
Greatest in 3, least in 2, υ>0 in 1 and 2, υ<0 in 3.
Topper's Solved these Questions
- MOTION IN A STRAIGHT LINEBOOK - NCERT BANGLISHCHAPTER - MOTION IN A STRAIGHT LINEEXERCISE - ADDITIONAL EXERCISES
5 Videos
- MOTION IN A STRAIGHT LINEBOOK - NCERT BANGLISHCHAPTER - MOTION IN A STRAIGHT LINEEXERCISE - ADDITIONAL EXERCISES
5 Videos
- MOTION IN A PLANEBOOK - NCERT BANGLISHCHAPTER - MOTION IN A PLANEEXERCISE - EXCERCISES
30 Videos
- OSCILLATIONSBOOK - NCERT BANGLISHCHAPTER - OSCILLATIONSEXERCISE - Additional Exercises
6 Videos
Similar Questions
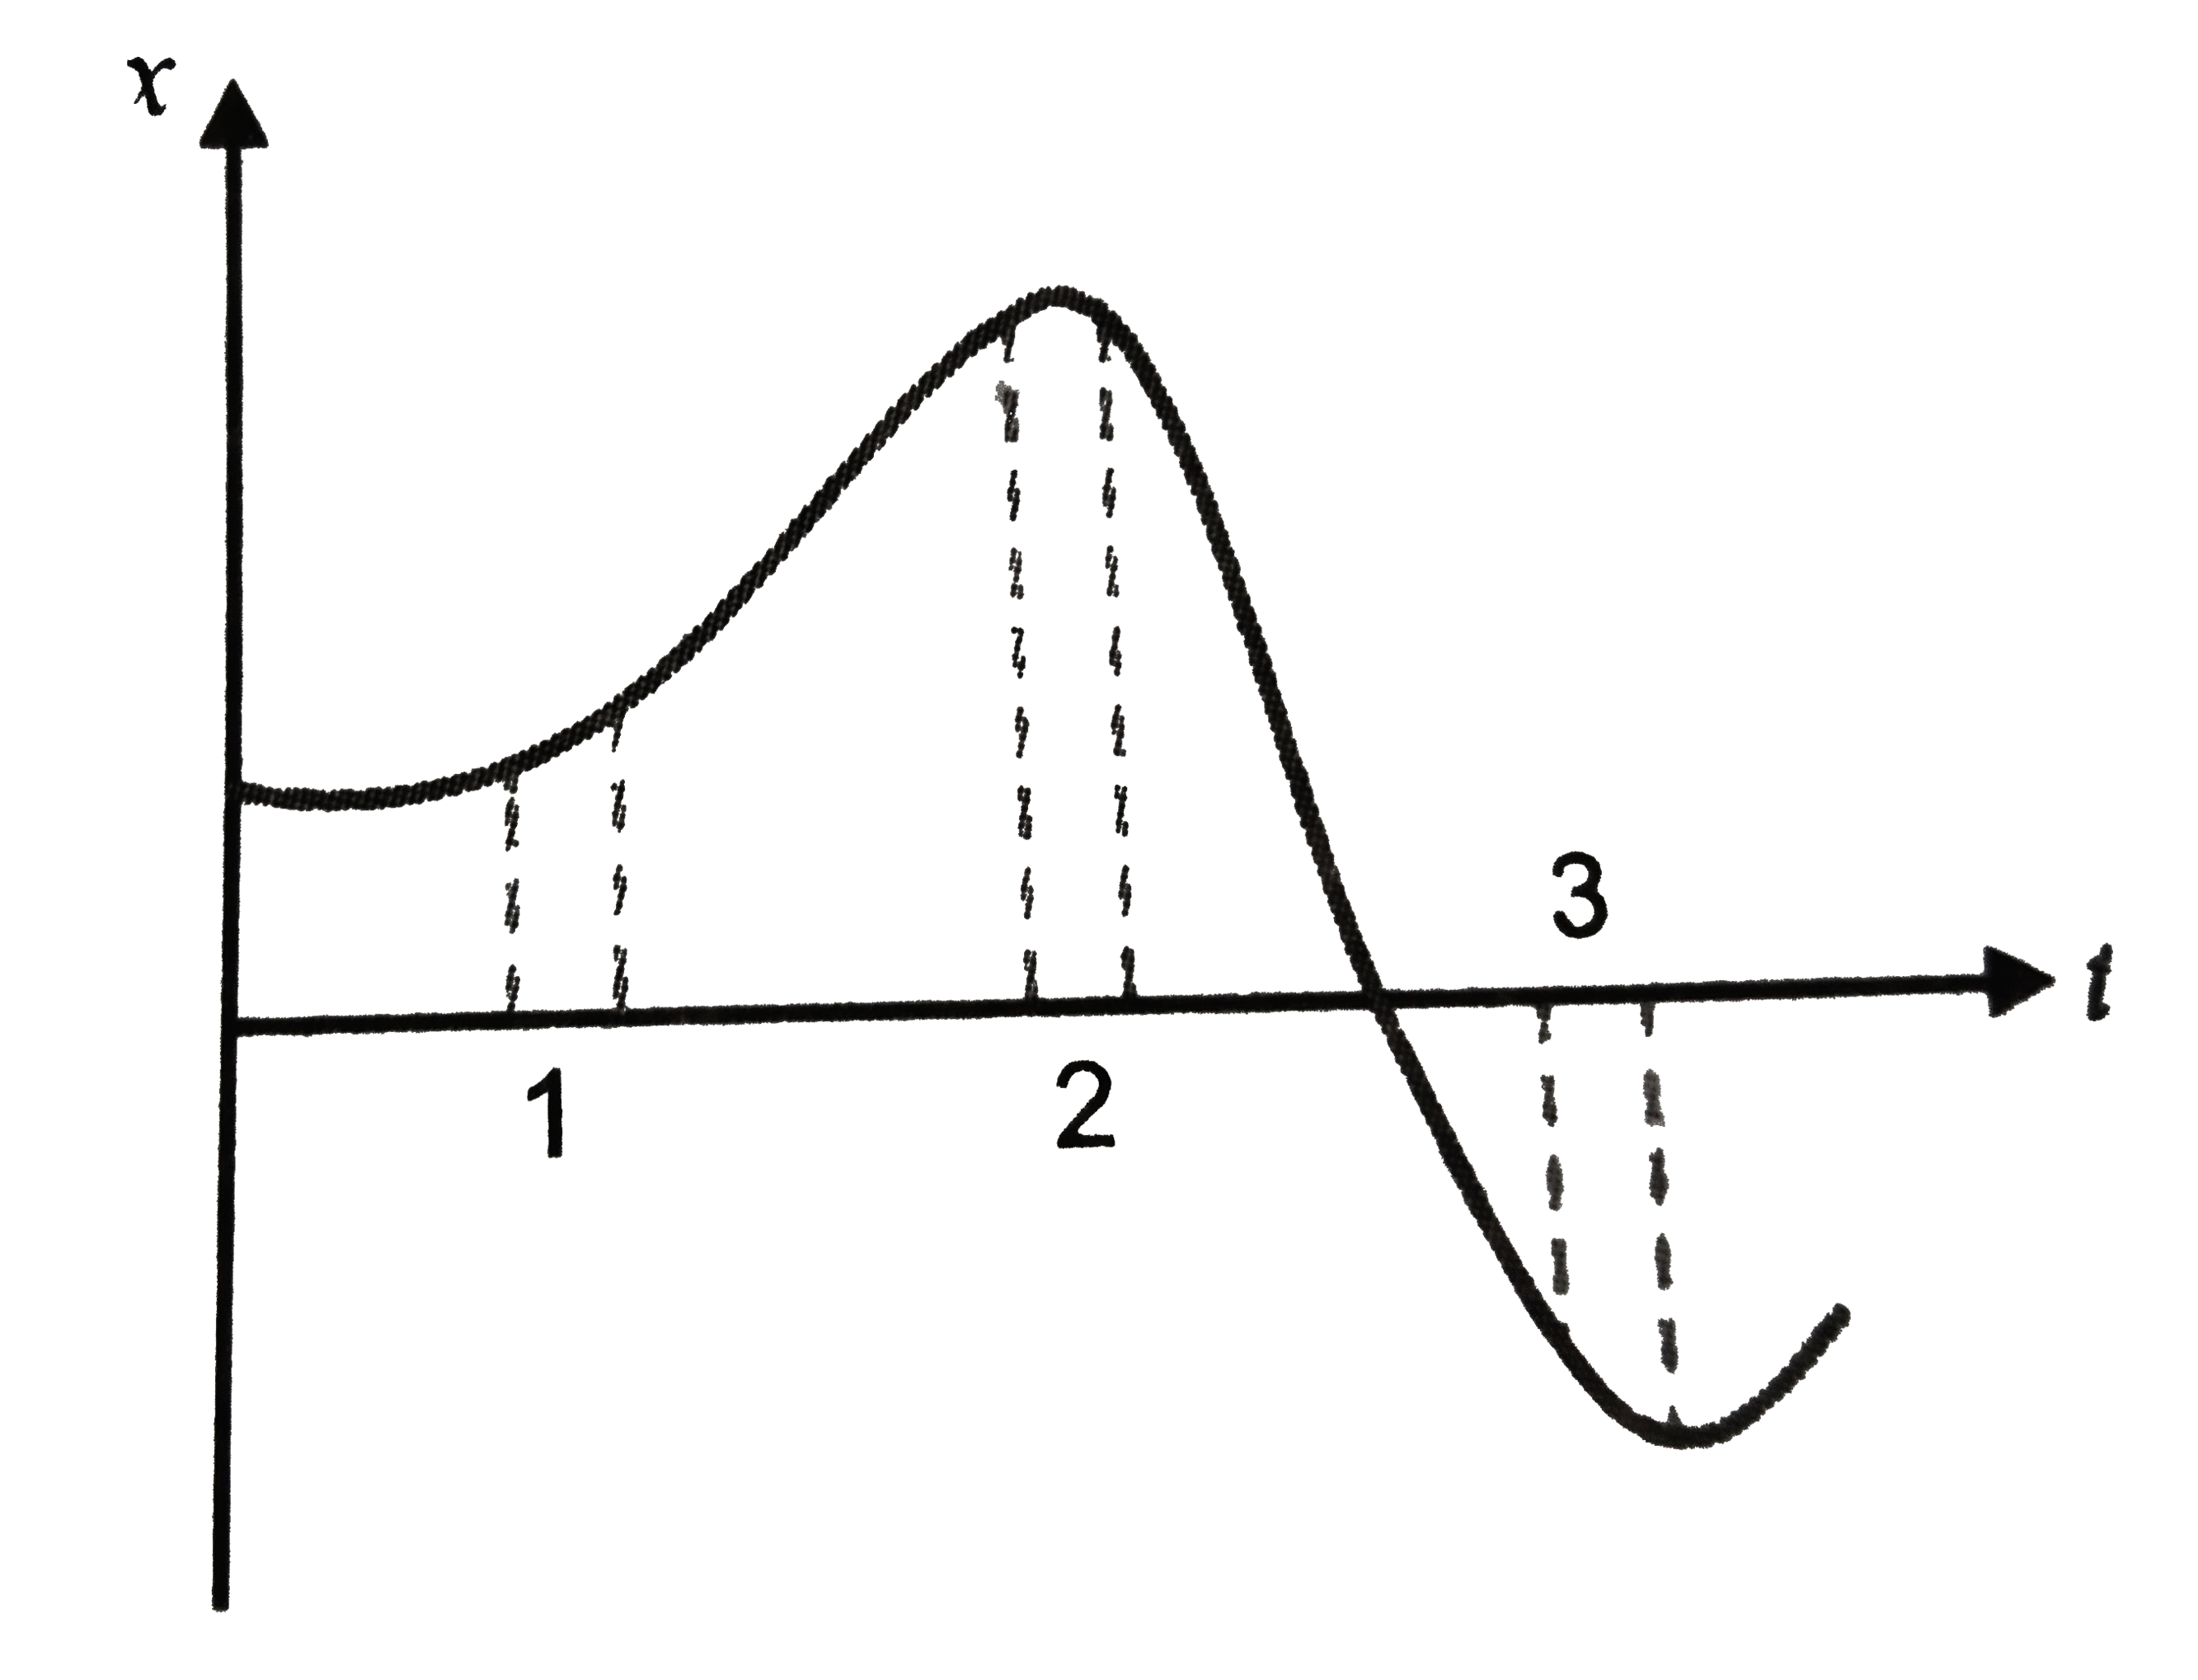
Fig. show the x−t plot of a particle in one dimensional motion. Three different equal intervals of time are shown. In which interval the average speed is greatest and in which it is the least? Give the sign of average speed for each interval.
 .
.
View SolutionFig. 2 (NCT).9 show the x−t plot of a particle in one dimensional motion. Three different equal intervals of time are shown. In which interval the average speed is greatest and in which it is the least ? Give the sign of average speed for each interval.
 .
.
View Solution
Knowledge Check
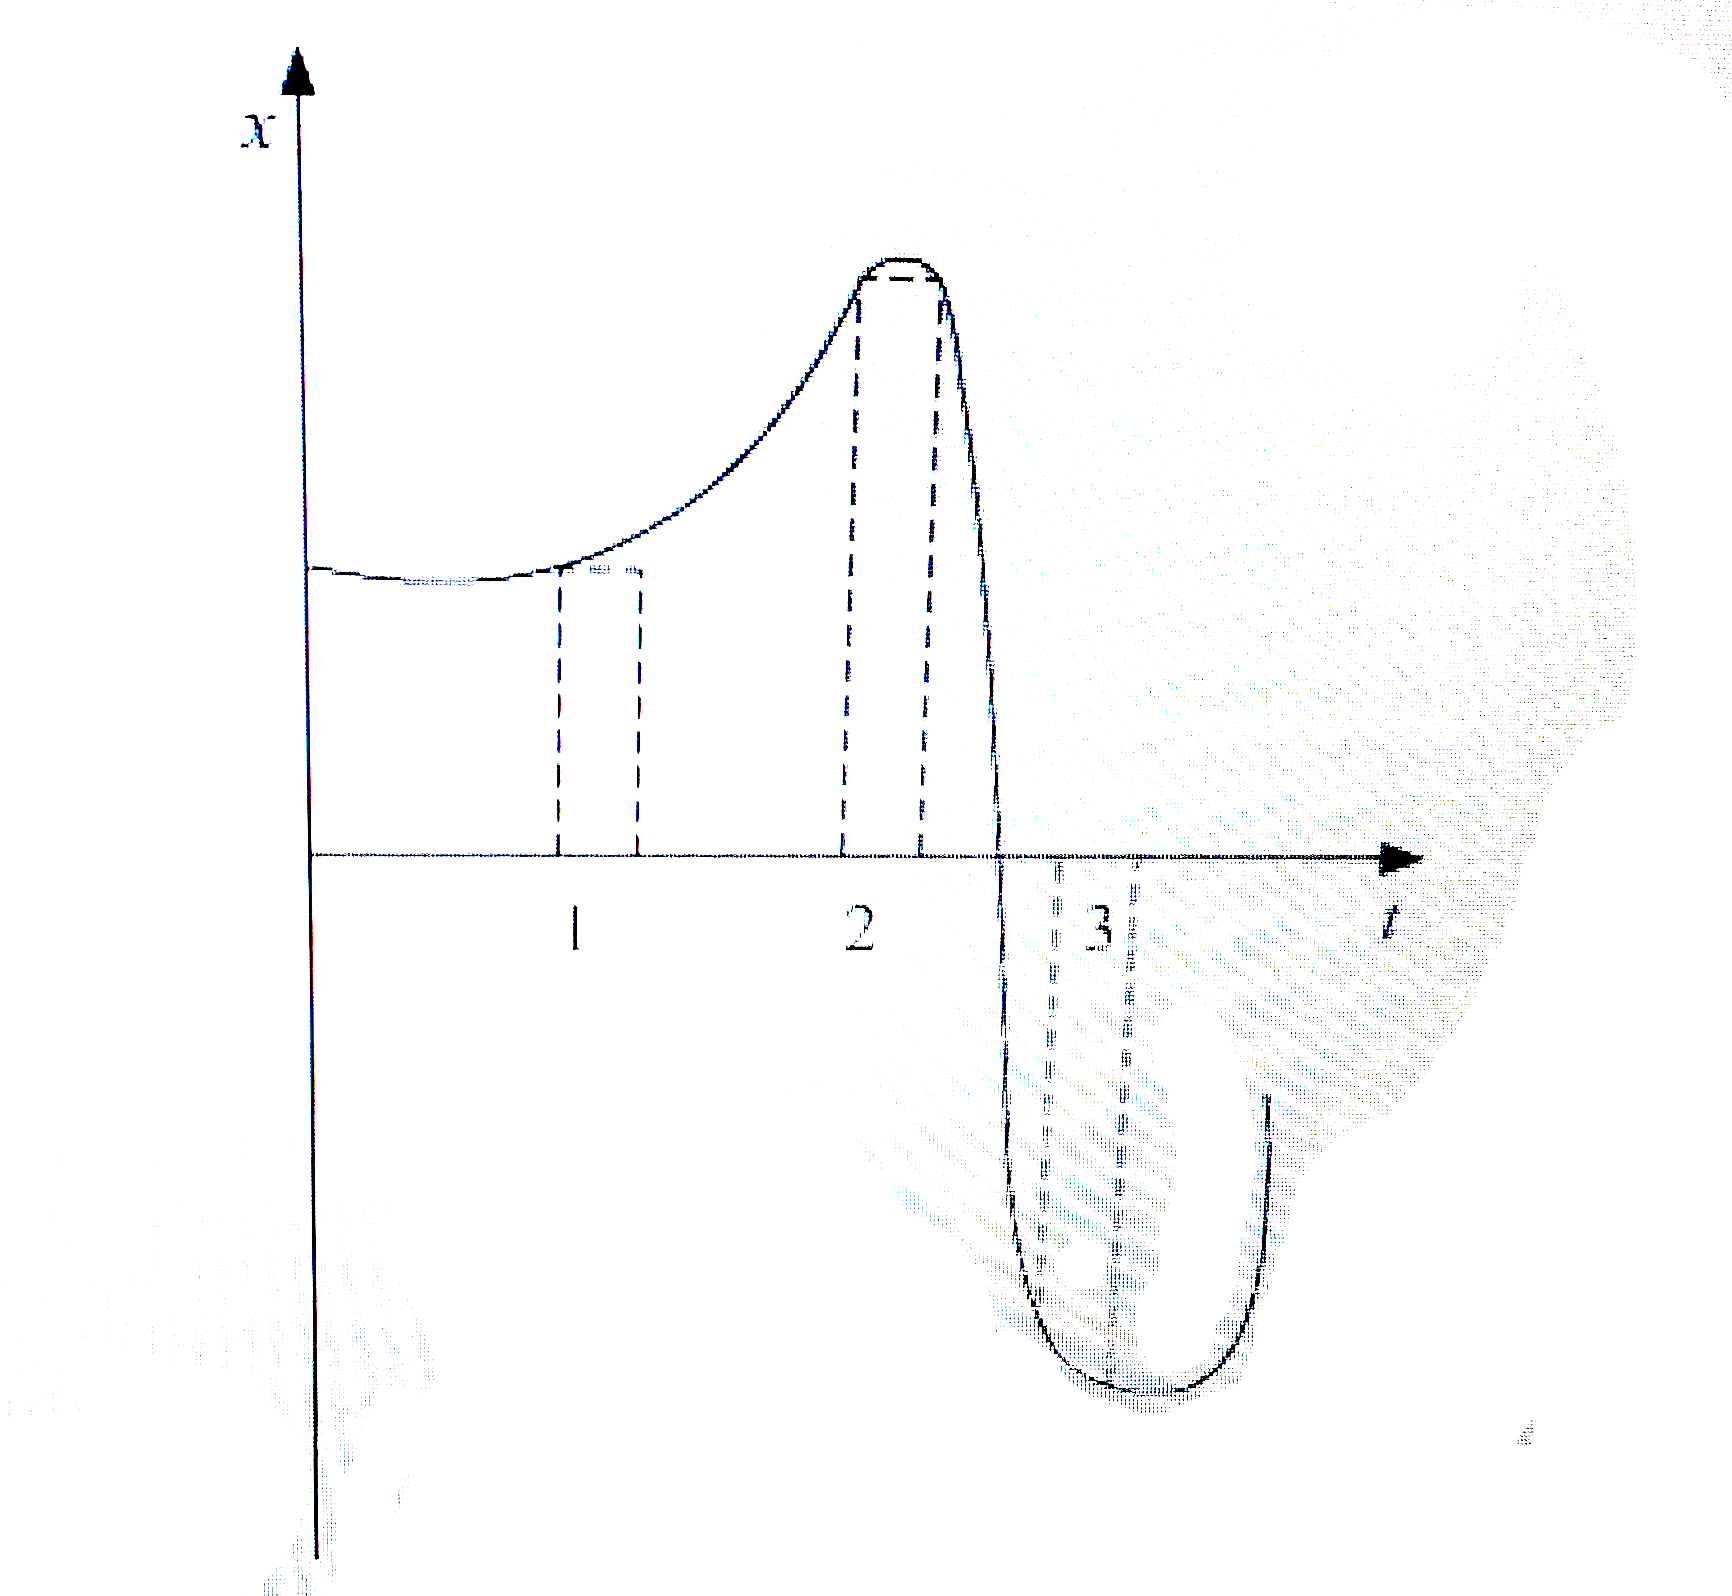
Figure 3.24 gives the x−t plot of a particle in one-dimensional motion. Three different equal intervals of time are shown. In which interval is the average speed greatest, and in which is it the least ? Give the sign of average velocity for each interval.
 Aν1 gt ν2Bν2>ν1Cν1=ν2Ddata is insufficient
It magnitude of average speed and average velocity over an interval of time are same, then
AParticle must move with zero accelerationBParticle must move with uniform accelerationCParticle must be at restDParticle must move in a straight line without turning backIf magnitude of average speed and average velocity over a time interval are same, then
AThe particle must move with zero accelerationBThe particle must move with non-zero accelerationCThe particle must be at restDThe particle must move in a straight line without turning back
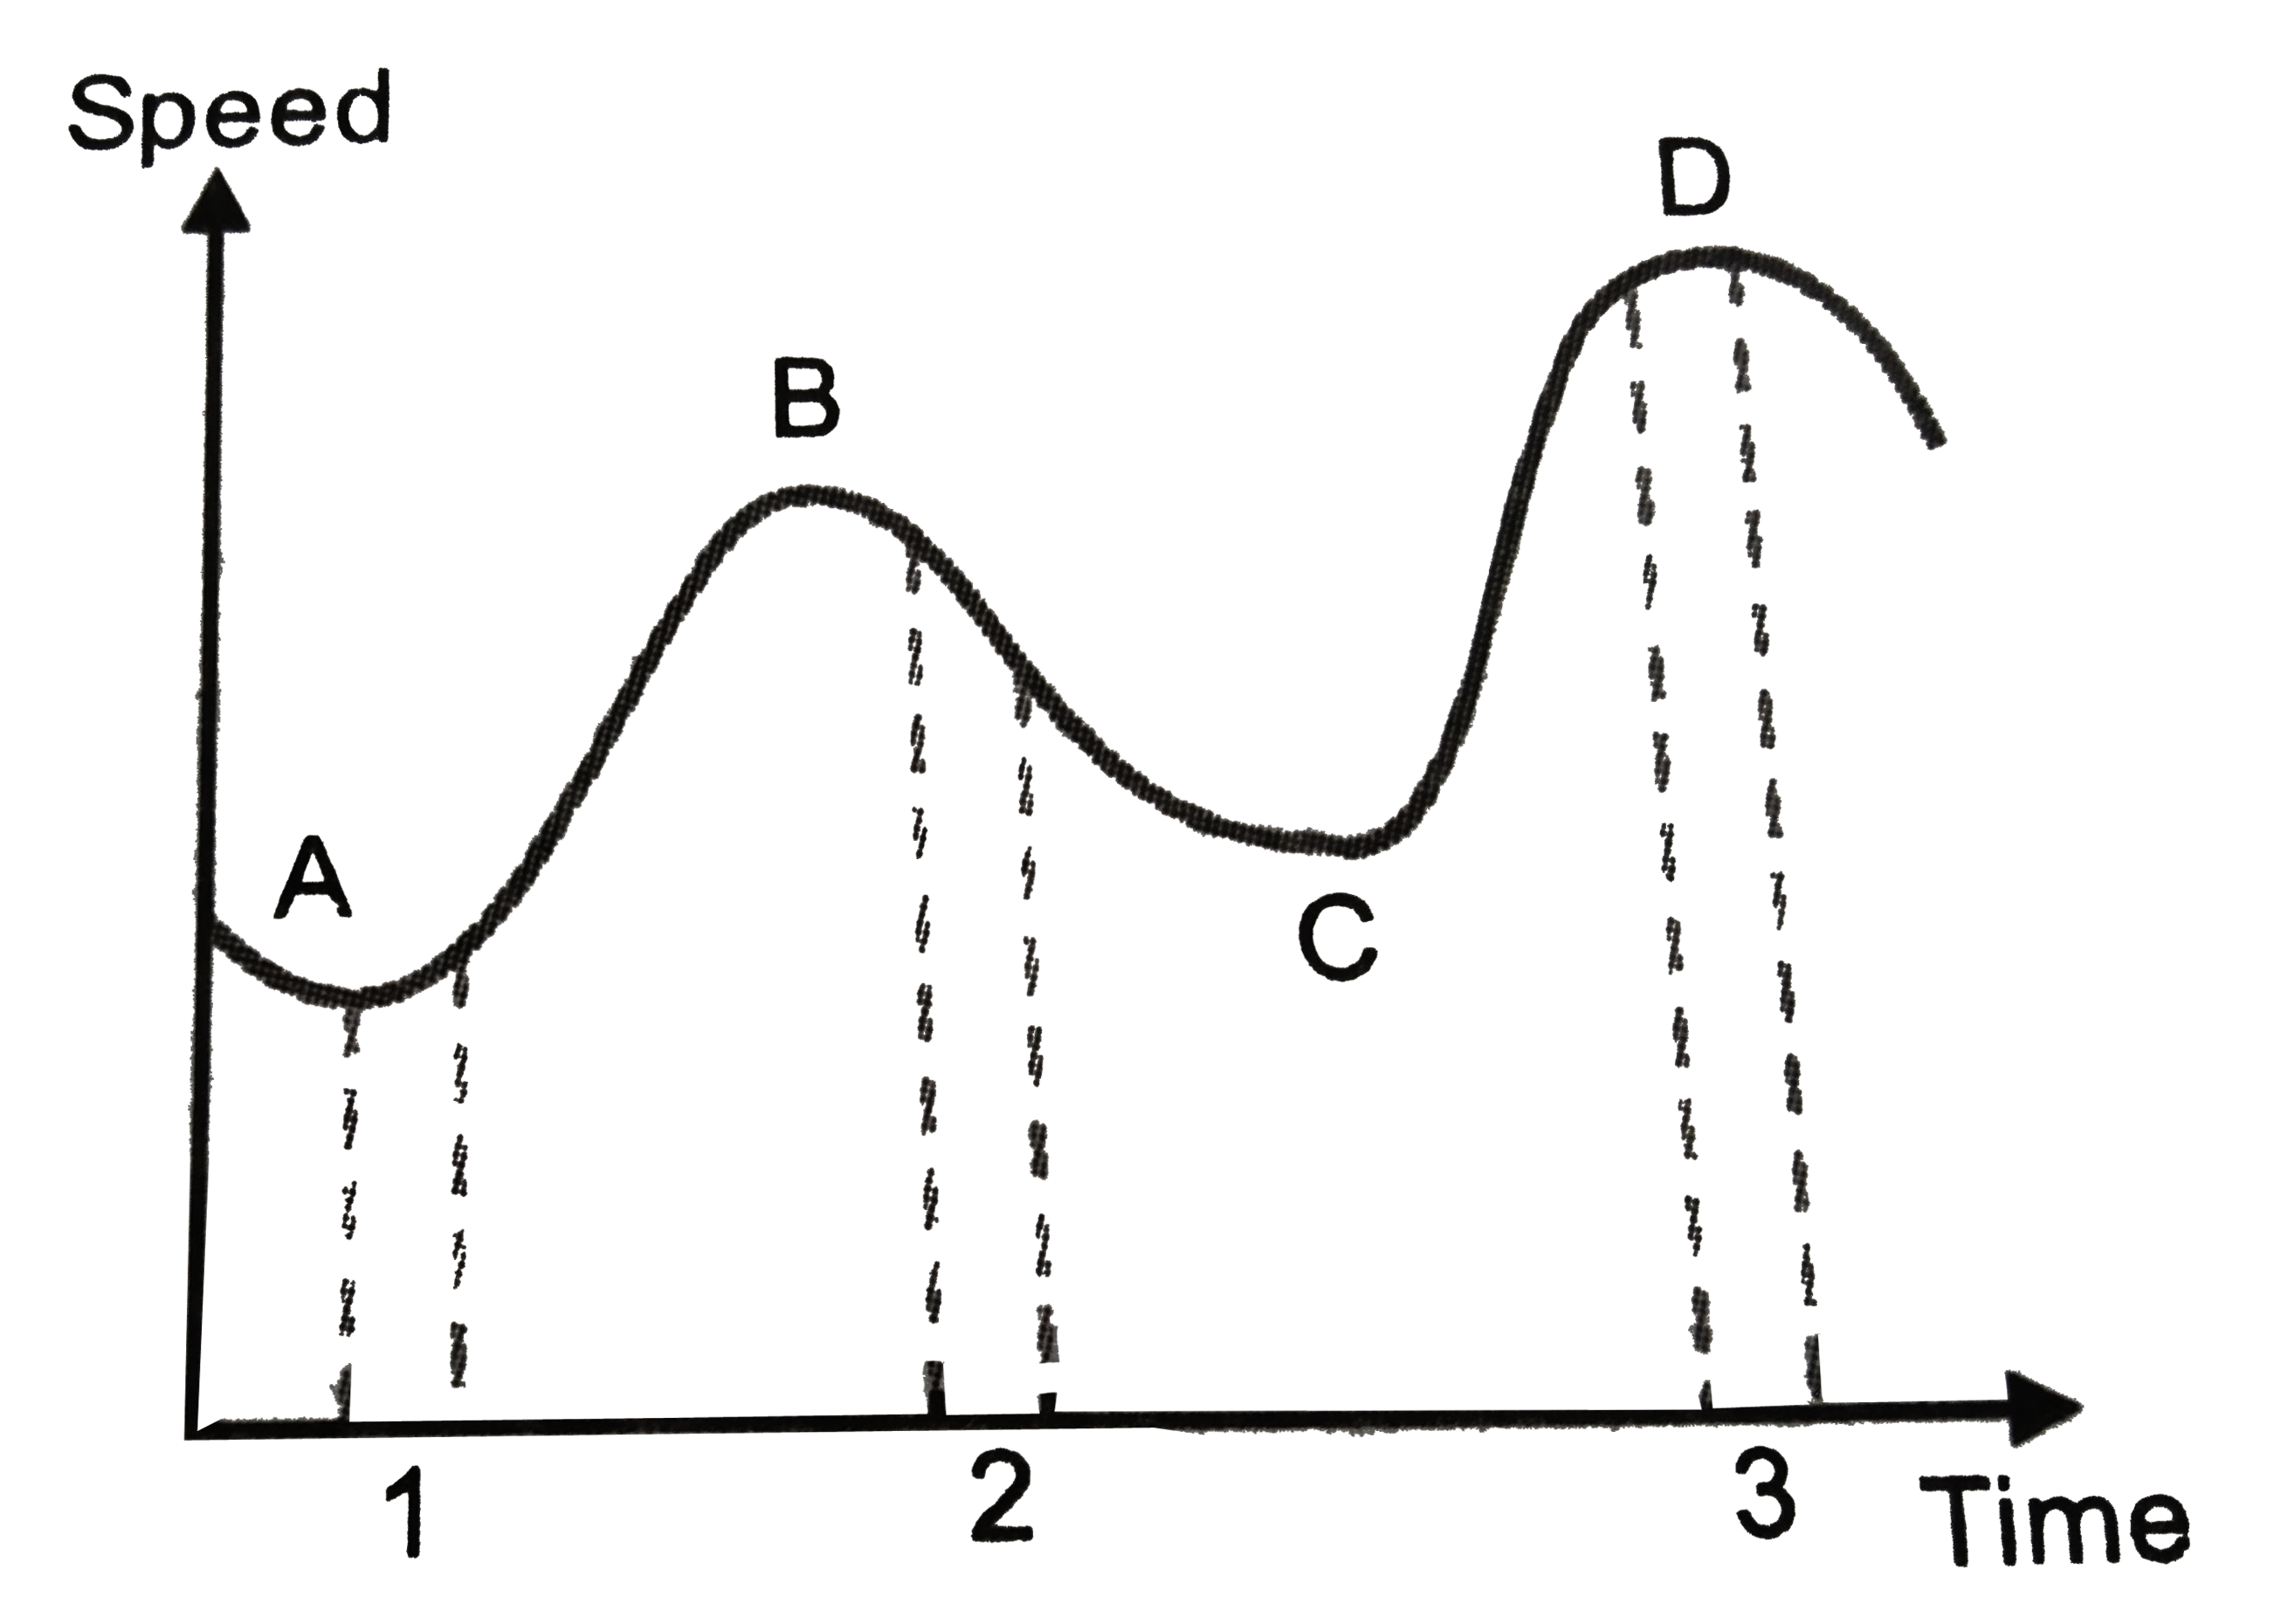
Fig. 2 (NCT). 10 . Give a speed-tiem graph of a particle in one dimenstional motion. Three different equal intervals of time are shwon. In which interval is the average acceleration graeatest in magnitude ? In which interval is the average speed greatest ? Choosing the positive direction as the constant direction of motion, give the signs of u and a in the three intervals. What are the acclerations at teh points A,B,C and D ?
 .
.
View SolutionGiven a speed-time graph of a particle in motion along a constant direction. Three equal intervals of time are shown. In which interval is the average acceleration greatest in magnitude? In which interval is the average speed greatest? Choosing the positive direction as the constant direction of motion, give the signs of v and a in the three intervals. What are the accelerations at the points A,B,C and D ?
 .
.
View SolutionFigure gives the x-t plot of a particle is one dimensional motion. Give the signs of position, velocity and acceleration of the particle at t = 0.3s
View SolutionFind average speed in time interval t= 2 to t=10s
View SolutionIf magnitude of average speed and average velocity over a time interval are same, then
View Solution
