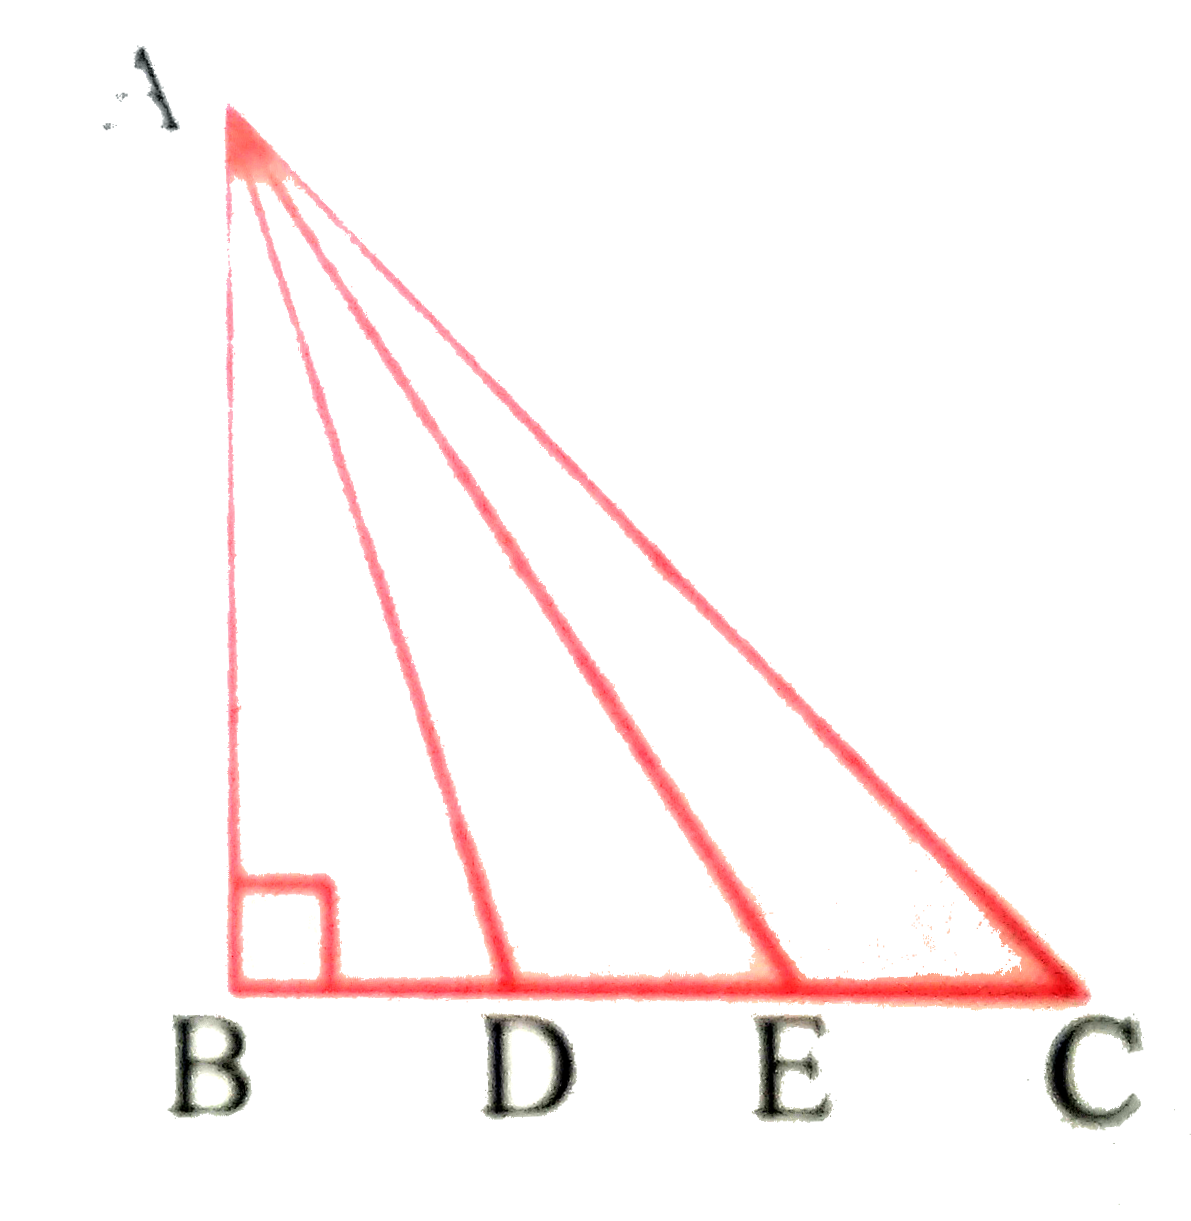
In the adjacent figure, ABC is a right angled triangle with right angle at B and points D, E trisect BC. Prove that 8AE2=3AC2+5AD2.
 Solution in Tamil
Step by step video & image solution for In the adjacent figure, ABC is a right angled triangle with right angle at B and points D, E trisect BC. Prove that 8AE^(2)=3AC^(2)+5AD^(2). by Maths experts to help you in doubts & scoring excellent marks in Class 10 exams.
Updated on:21/07/2023Topper's Solved these Questions
- SIMILAR TRIANGLES BOOK - NCERT TAMILCHAPTER - SIMILAR TRIANGLES EXERCISE - OPTIONAL EXERCISE
6 Videos
- SIMILAR TRIANGLES BOOK - NCERT TAMILCHAPTER - SIMILAR TRIANGLES EXERCISE - TRY THIS
5 Videos
- SIMILAR TRIANGLES BOOK - NCERT TAMILCHAPTER - SIMILAR TRIANGLES EXERCISE - EXERCISE - 8.3
6 Videos
- SETSBOOK - NCERT TAMILCHAPTER - SETSEXERCISE - Try This
9 Videos
- STATISTICSBOOK - NCERT TAMILCHAPTER - STATISTICSEXERCISE - THINK AND DISCUSS
8 Videos
Similar Questions
In the given figure,
QTPR=QRQSand∠1=∠2
Prove that ΔPQS~ΔTQR.

View SolutionIn triangle ΔPQR, E and F are points on the sides PQ and PR respectively. State whether EF ||QR or not?
(i) PE = 3.9 cm EQ = 3 cm PF = 3.6 cm and FR = 2.4 cm
View SolutionIn trigle ABC, the points D, E, F are the midpoints of the sides BC,CA, and AB respee. Tively. Using vector methed ,show that the area of Δ DEF is equal to 14 (area of ABC).
View SolutionWrite some sets of your choice, involving algebraic and geometrical ideas.
View SolutionThe mean value can be calculated from both ungrouped and grouped data. Which one do you think is more accurate? Why?
View SolutionIn Figure, ABC is a right triangle right angled at B and points DandE trisect BC . Prove that 8AE2=3AC2+5AD2.
View SolutionDetermine the point of symmetry of a regular hexagon.
View SolutionDtermine the images of the following figure about the given line :
View SolutionIn the following figure, AB and BC are equidistant from the centre 'O' of the Show that
(a) ABC is an isosceles triangle.
(b) OB bisects angle ABC.
ltimg src="https://d10lpgp6xz60nq.cloudfront.net/physics_images/PS_MATH_X_C13_E02_006_Q01.png" width="80%"gt
View SolutionMatch the following Column A to Column B

View SolutionMatch the following Column A to Column B

View SolutionMatch the following Column A to Column B

View SolutionThe inequation represented by the graph given below is :
View SolutionThe inequation that best describes the graph given below is _________
View SolutionThe inequation that best describes the following graph is _________
View SolutionWhich inequations represent the shaded region in the given figure
View Solution
