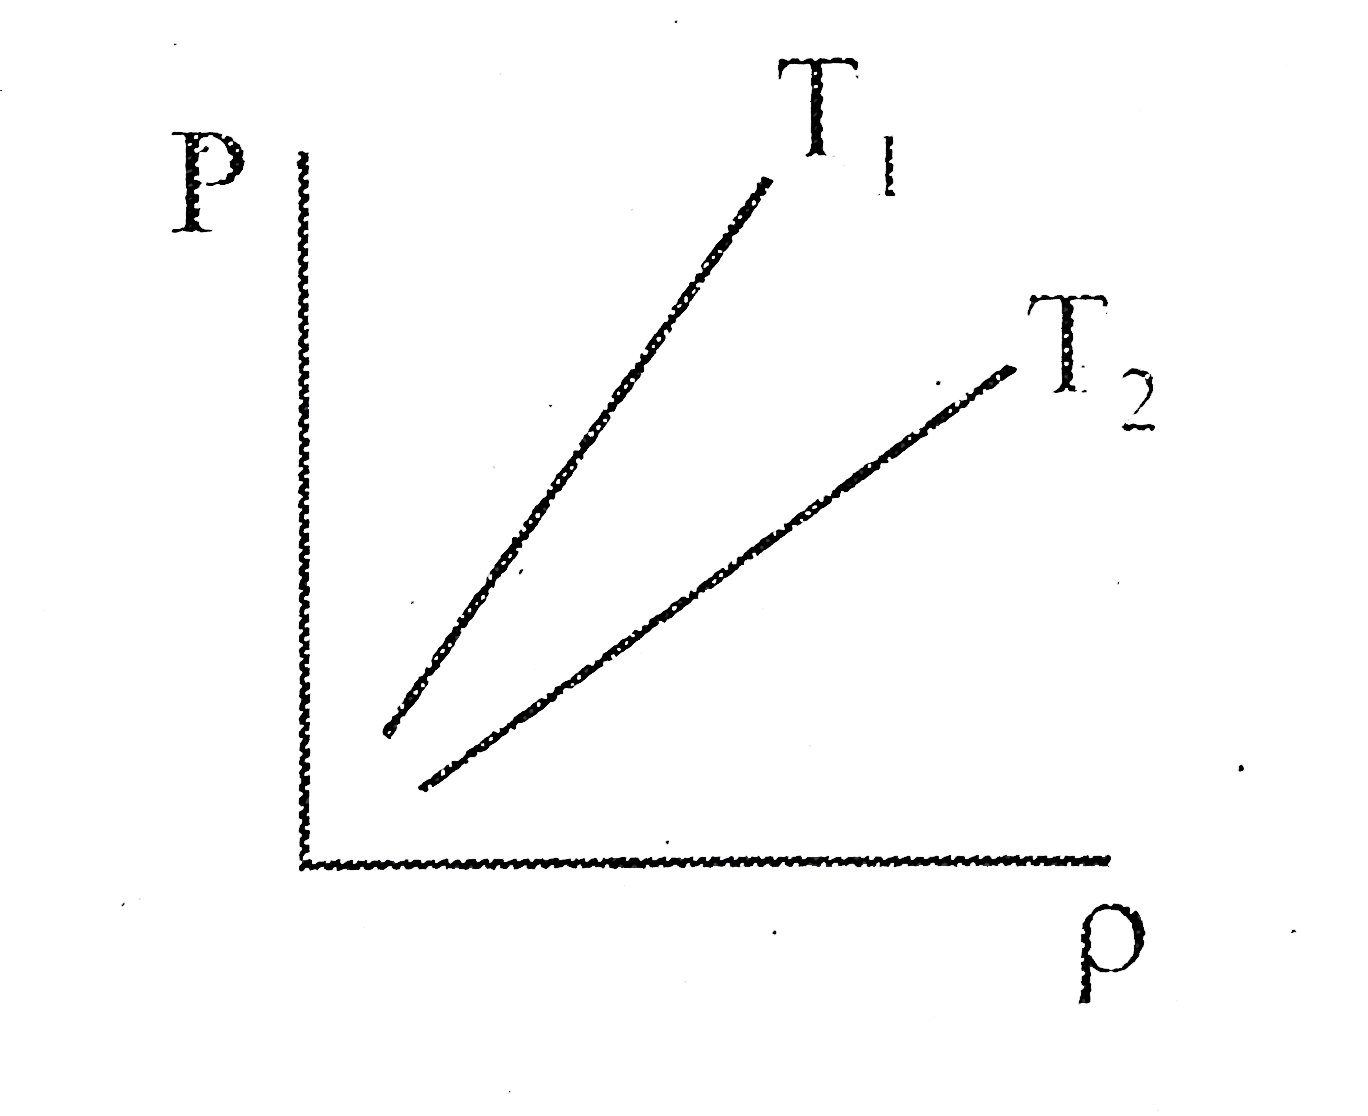
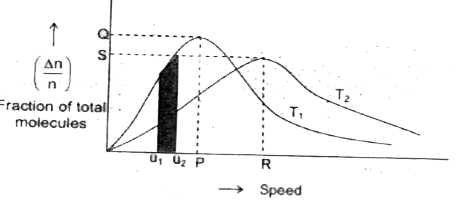
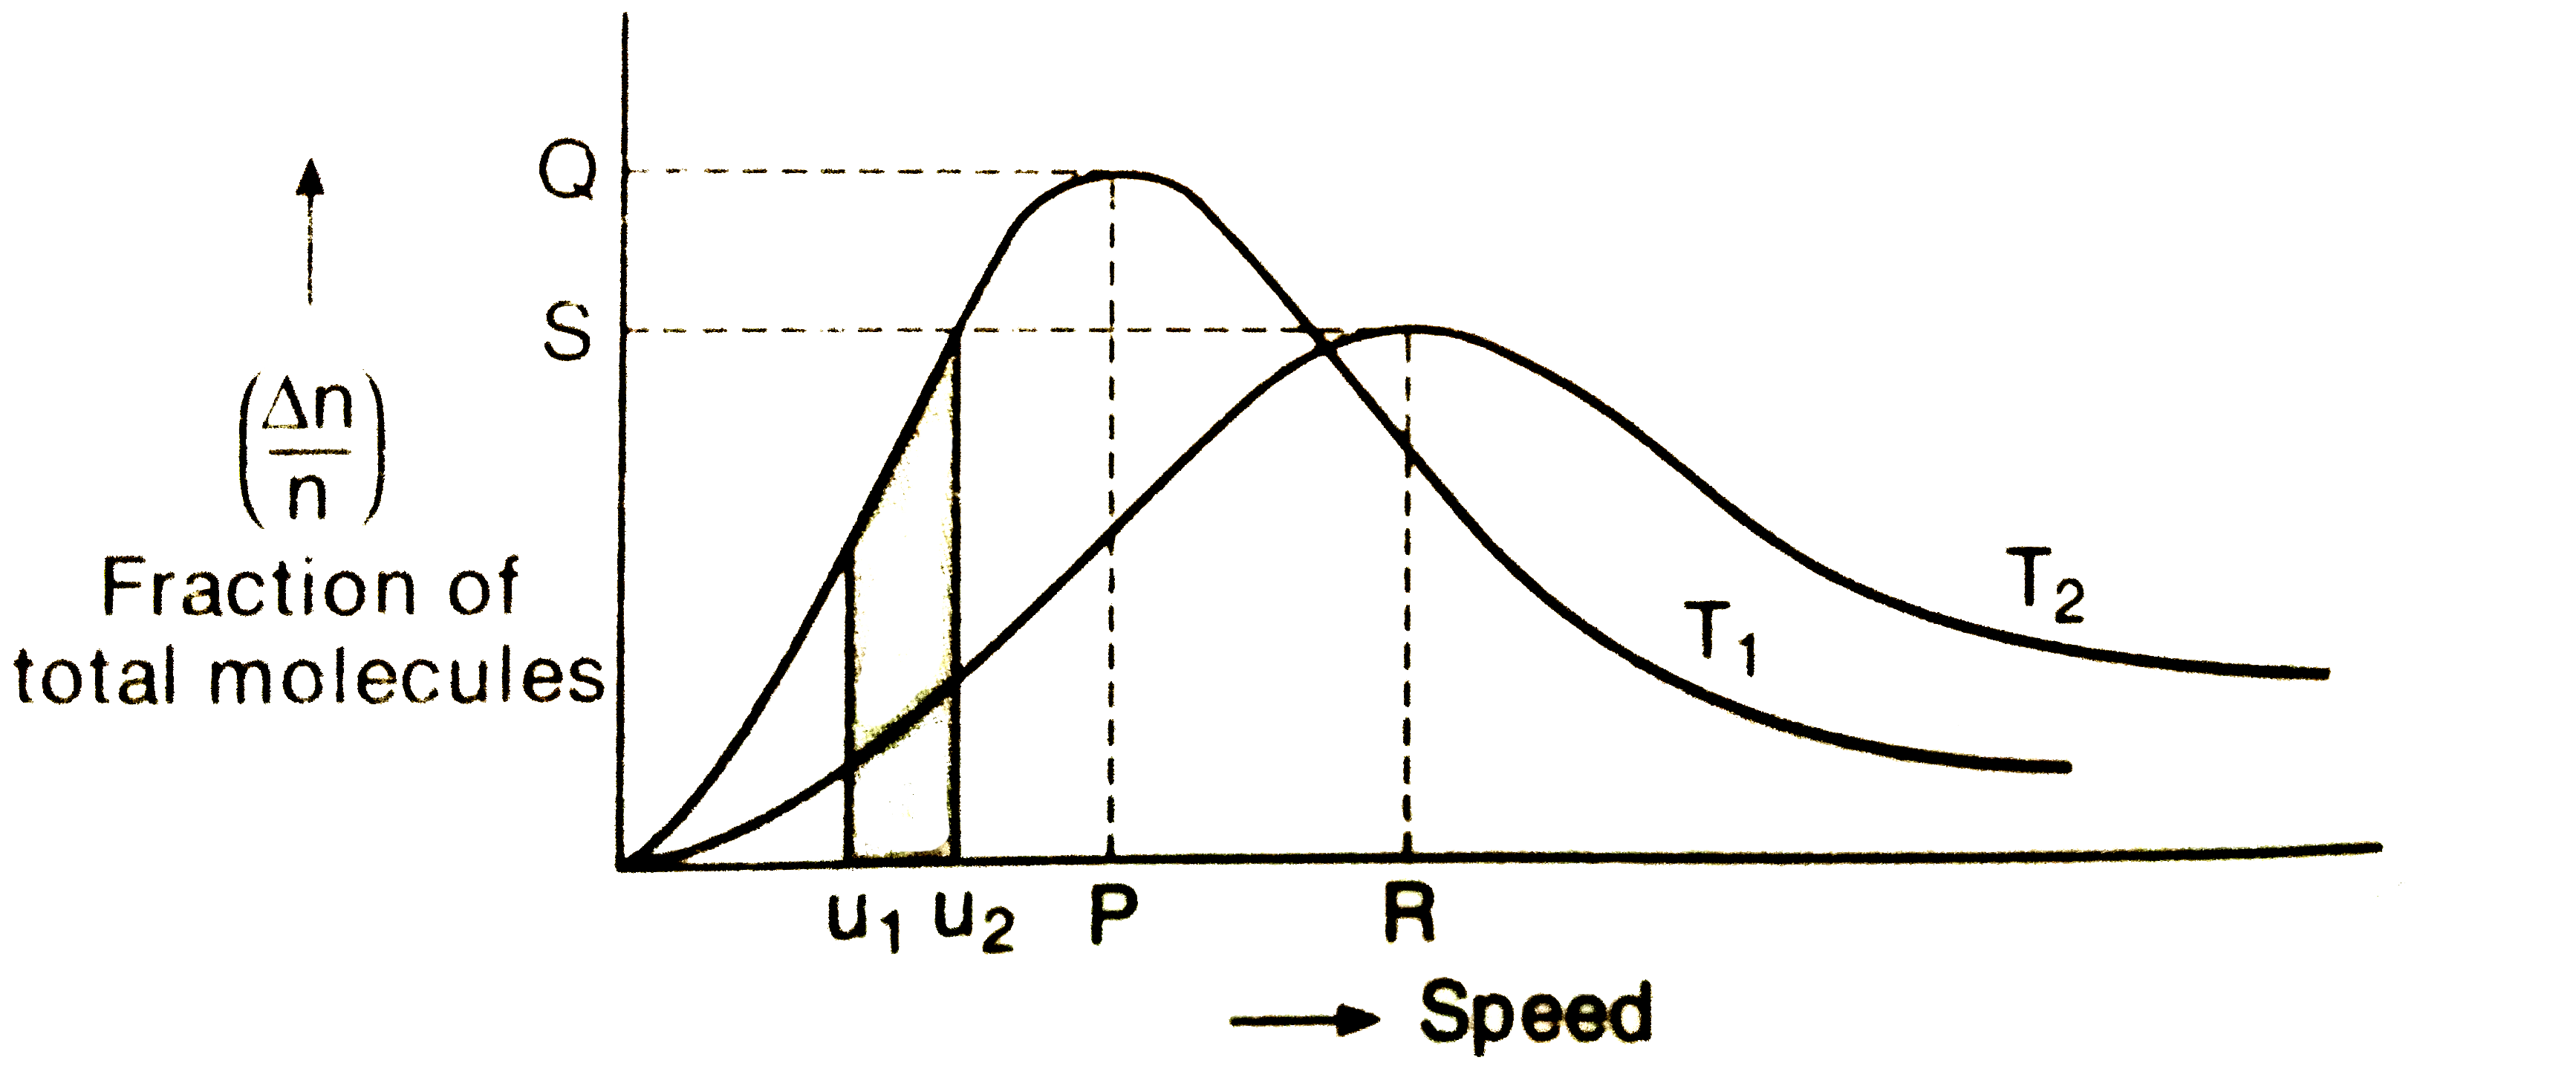
Following represents the Maxwell distribution curve for an ideal gas at two temperature T1 and T2 . Which of the following option(s) is/are true?
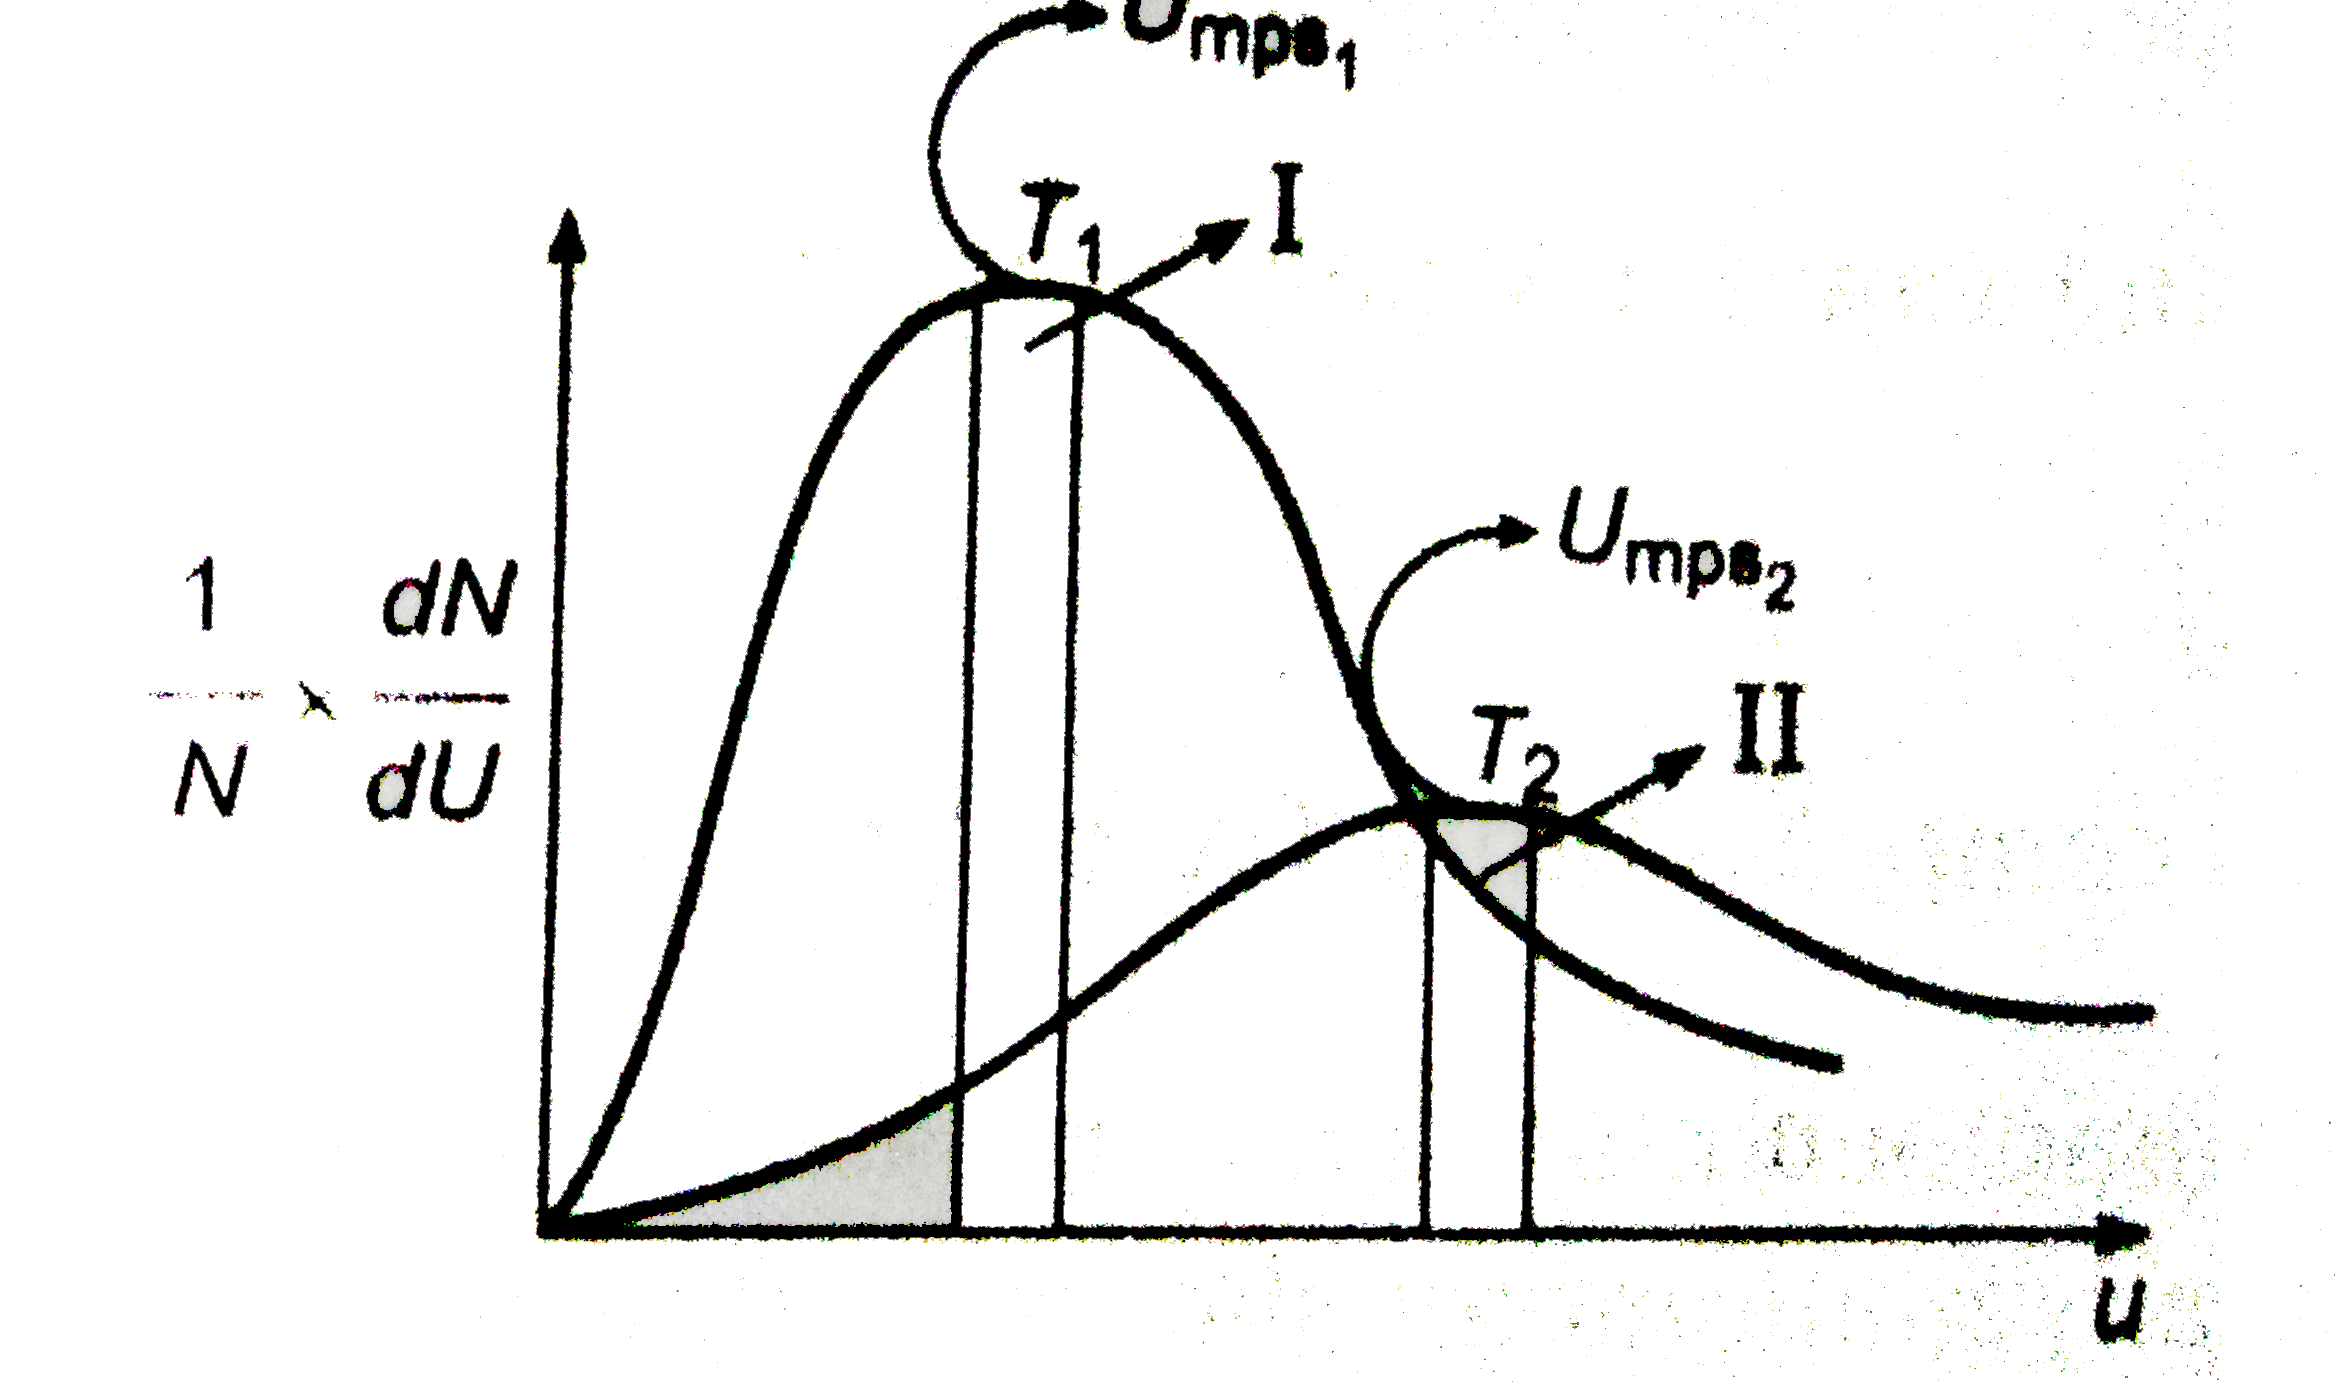
Total area under the two curves is independent of moles of gas
If dU1=fUmps1 and dU2=fUmps2 then A1=A2
T1>T2 and hence higher the temperature, sharper the curve
The fraction of molecules having speed =Umps decreases as temperature increases
The correct Answer is:ABD
(a ) ∵ Area under the curve gives fraction of molecules and total area is constant.
(b) From expression of Maxwell distribution fraction of molecules between Umps→Umps+fUmps is independent of value of Umps and is dependent only on f.
(c ) T2 is higher temperature
(d) As seen from graph ,∴a,b,d.
Topper's Solved these Questions
- GASEOUS STATE BOOK - ERRORLESS CHAPTER - GASEOUS STATE EXERCISE - JEE SECTION (Reasoning type questions)
3 Videos
- GASEOUS STATE BOOK - ERRORLESS CHAPTER - GASEOUS STATE EXERCISE - JEE SECTION Comprehension type question (Passage-I)
2 Videos
- GASEOUS STATE BOOK - ERRORLESS CHAPTER - GASEOUS STATE EXERCISE - JEE SECTION (Only one choice answer)
44 Videos
- ENVIRONMENTAL CHEMISTRYBOOK - ERRORLESS CHAPTER - ENVIRONMENTAL CHEMISTRYEXERCISE - CRITICAL THINKING (Objective question )
16 Videos
- GENERAL ORGANIC CHEMISTRYBOOK - ERRORLESS CHAPTER - GENERAL ORGANIC CHEMISTRYEXERCISE - Matrix Match type questions
4 Videos
Similar Questions
Knowledge Check
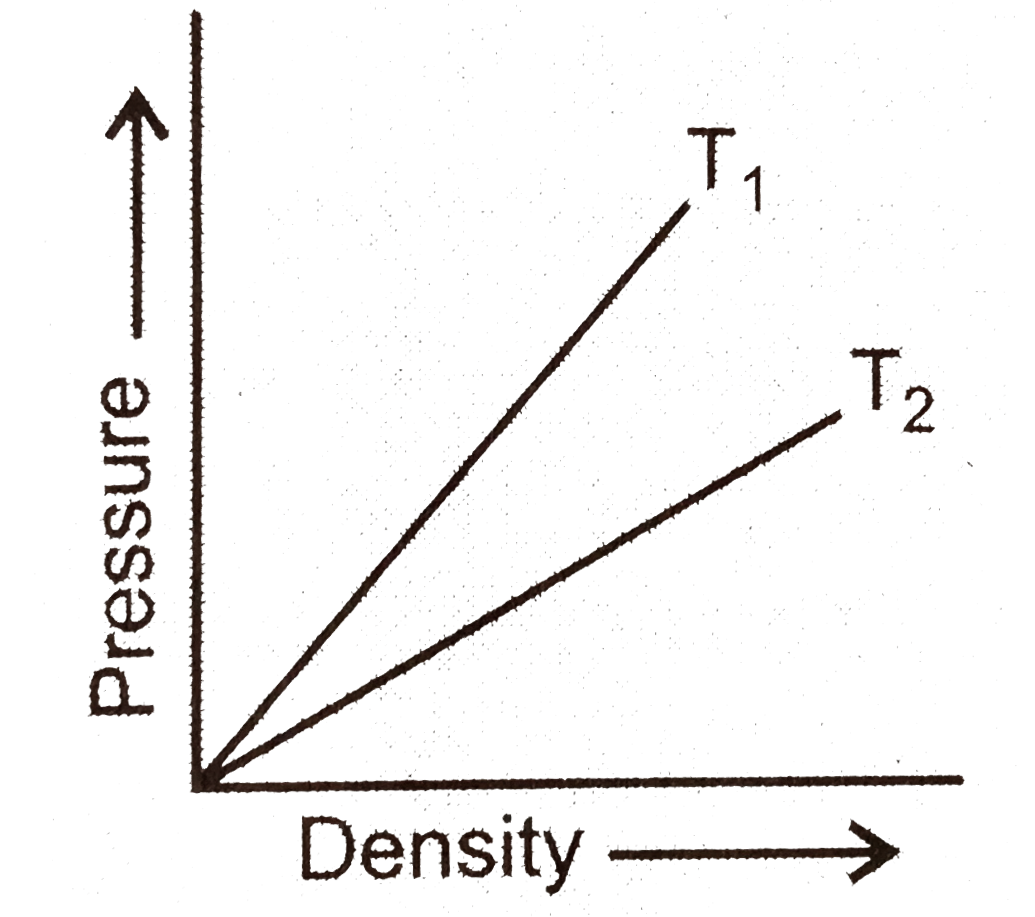
Figure shows graphs of pressure vs density for an ideal gas at two temperature T1andT2. Which of the following is correct?
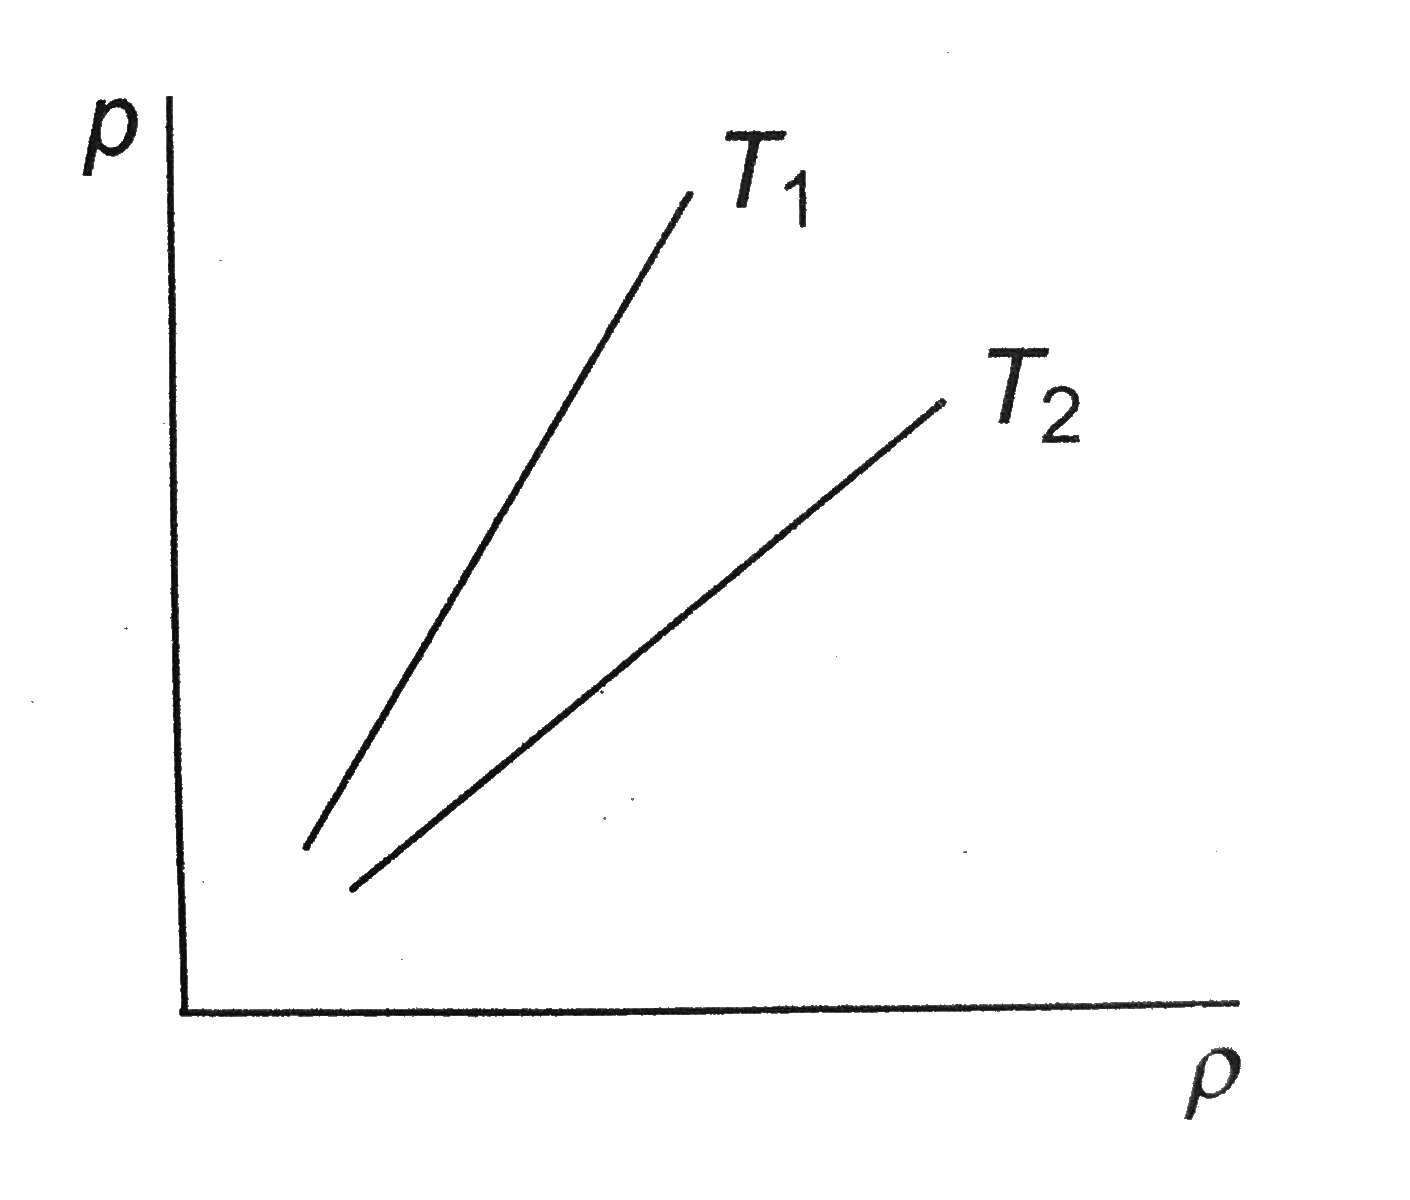 AT1>T2BT1=T2CT1<T2Dany of the three is possible
Shows graphs of pressure vs density for an ideal gas at two temperaturesT1andT2
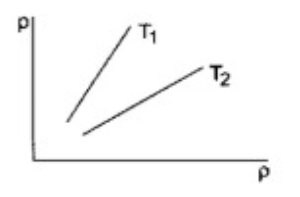 A(a)T1>T2B(b)T1=T2C(c)T1<T2D(d)Any of the three is possibe.
Which of the following options is correct w.r.t. ideal gas
A(∂H∂T)P−(∂H∂T)V=RB(∂H∂T)P<(∂H∂T)VC(∂H∂T)P(∂U∂T)V=γ(Poisson's ratio)D(∂U∂T)P−(∂H∂T)p=R
The gas molecules randomly move in an directions and collide with each other and with the wall of the container. It is dificult to detemine the speed of an individual molecule but it has become possible to Work out the distribution of molecules among different molecular speeds. This is known as Maxwell
Boltzmann distribution.
Consider the following graph about Maxwell's distribution of speeds at two different temperatures T1andT2 and answer the following questions:
Total area under the curve at T1 is
View SolutionFigure shows graphs of pressure versus density for an ideal gas at two temperatures T1 and T2 Which is correct ?
 .
.
View SolutionThe gas molecules randomly move in an directions and collide with each other and with the wall of the container. It is dificult to detemine the speed of an individual molecule but it has become possible to Work out the distribution of molecules among different molecular speeds. This is known as Maxwell
Boltzmann distribution.
Consider the following graph about Maxwell's distribution of speeds at two different temperatures T1andT2 and answer the following questions:
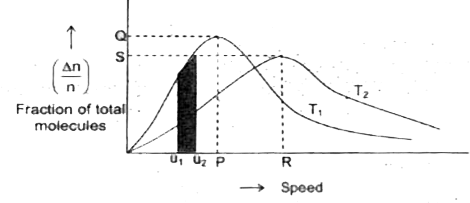
The shaded area represents
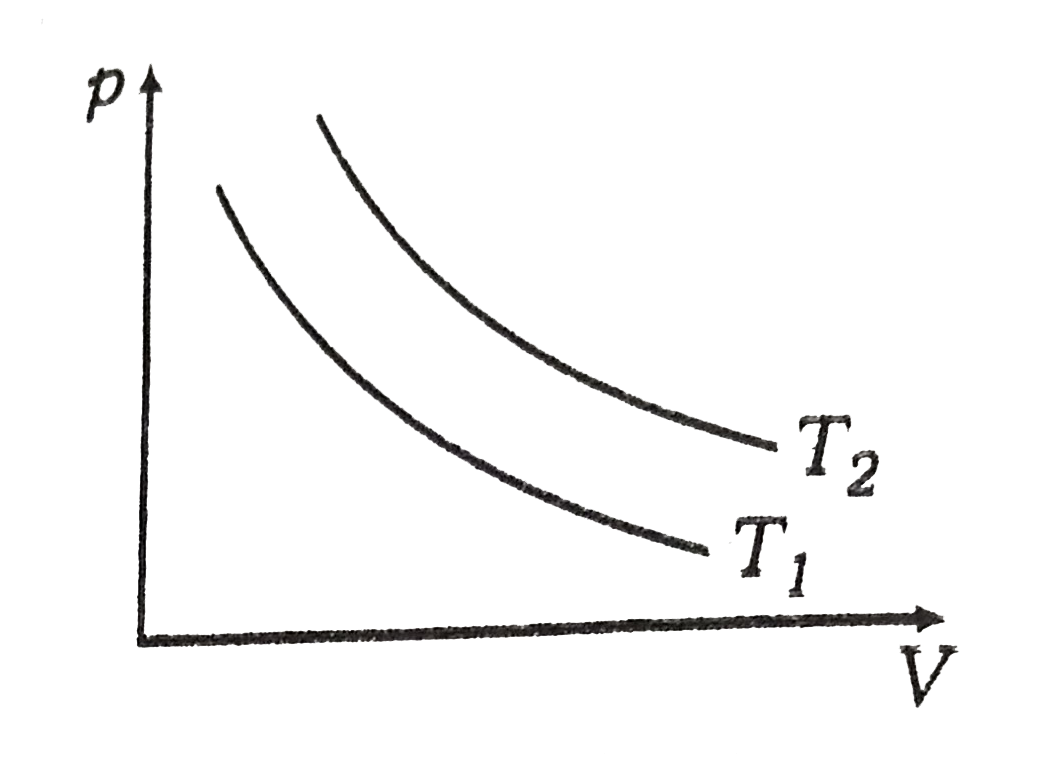
View SolutionThe adjoining fgure shows graph of pressure and volume of a gas at two temperatures T1 and T2 Which one the following is correct
View SolutionThe gas molecules randomly move in all directions and collide with each other and with the wall of the container. If is difficult to determine the speed of an individual molecule but it had become passible to work out the distribution of molecules among different molecular speeds. This is known as Maxwell Boltzmann distribution
consider the following graph about Maxwell's distribution of speed at two different temperature T1 and T2
The curve has which of the following characteristics ?
(i) It has symmetrical distribution of molecules against molecular velocity
(ii) The area under the curve gives the total number of molecules.
(iii) The maxima of teh curve shifts towards right as the temperature is raised.
(iv) The area under the curve is independent of temperature
Select the correct statements from the codes given below:
View Solution

