Use the tables below to draw linear graphs. (a) The number of days a hill side city received snow in different years. Years 2003,2004,2005and2006 and Days 8,10,5,and12 (b) Population (in thousands) of men and women in a village in different years.
plot the graph as shown in the diagram
Topper's Solved these Questions
- BOOK - NCERTCHAPTER - INTRODUCTION TO GRAPHSEXERCISE - SOLVED EXAMPLES8videos
INTRODUCTION TO GRAPHS
- BOOK - NCERTCHAPTER - INTRODUCTION TO GRAPHSEXERCISE - EXERCISE 15.32videos
INTRODUCTION TO GRAPHS
- BOOK - NCERTCHAPTER - FACTORISATIONEXERCISE - EXERCISE 14.421videos
FACTORISATION
- BOOK - NCERTCHAPTER - LINEAR EQUATIONS IN ONE VARIABLEEXERCISE - EXERCISE 2.39videos
LINEAR EQUATIONS IN ONE VARIABLE
Similar Questions
Use the tables below to draw line graphs.
The number of days a hill side city received snow in different years.
 View Solution
The following table shows the number of patients discharged from a hospital with HIV diagnosis in different years: Years:, 2002, 2003, 2004, 2005, 2006 No. of Patients:, 150, 170, 195, 225, 230 Represent this information by a graph.
View Solution
Knowledge Check
- Question 1 - Select One
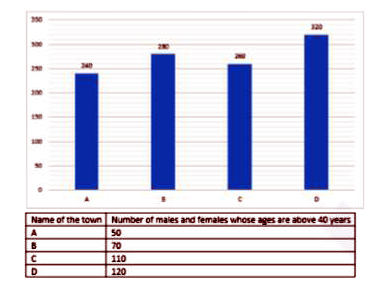
The bar graph shows the total number of male and female lives in four different towns and table shows the number of males and females whose ages are above 40 years. Read the data carefully and answer the questions below:
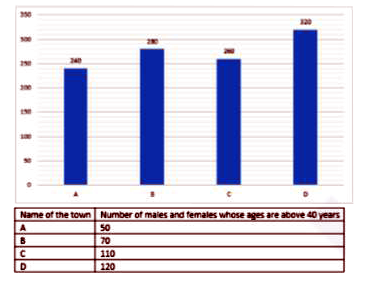
If 40% of population in town B whose ages are below and equals to 40 years are male and 40% of population in town D whose ages are below and equals to 40 years are female. Find the difference between the females of town B and D whose ages are below and equals to 40 years.A46B52C49D58 - Question 2 - Select One
The table given below shows the number of students who have taken admission in school A and B from the years 2010 to 2015.
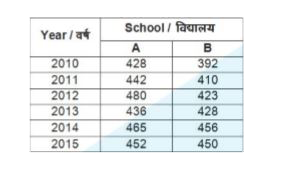
What is the average difference of number of students in school A and B in the given period?Aa)24Bb)27Cc)96Dd)144 - Question 3 - Select One
The bar graph shows the total number of male and female lives in four different towns and table shows the number of males and females whose ages are above 40 years. Read the data carefully and answer the questions below:
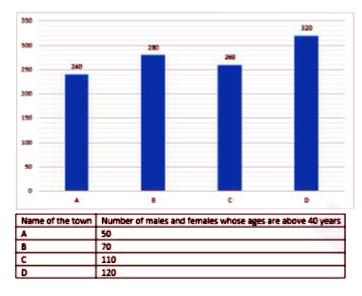
Number of males and females in town A whose ages are below and equals to 40 years is what percent less than those number of males and females in town D whose ages are below and equals to 40 years.A10%B12%C7%D5%
The following table shows the amount of rice grown by a farmer in different years: Years:, 2000, 2001, 2002, 2003, 2004, 2005, 2006 Rice grown (in quintals):, 200, 180, 240, 260, 250, 200, 270 Plot a graph to illustrate this information.
View SolutionRead the following table carefully and answer the questions given below:
Number of questions asked in different subjects during different years in an examination of Bank.

The total number of questions asked from Reasoning and English in the year 2006 is what percent that from General studies and Marketing in the year 2008 ?View SolutionThe following graph below shows the number of students (in thousands) who were admitted to three different courses in 5 years in a university. Study the graph and answer the question.
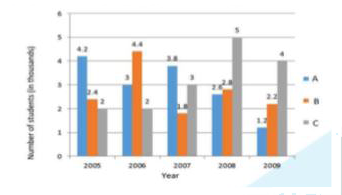
What is the ratio of the number of students who were admitted to course A in the year 2007 to that of students who were admitted to course C in the year 2009?View SolutionThe following table shows the sales of a commodity during the years 2000 to 2006. Years:, 2000, 2001, 2002, 2003, 2004, 2005, 2006 Sales (in lakhs of Rs.), 1.5, 1.8, 2.4, 3.2, 5.4, 7.8, 8.6 Draw a graph of this information.
View SolutionThe bar graph shows the total number of male and female lives in four different towns and table shows the number of males and females whose ages are above 40 years. Read the data carefully and answer the questions below:
Find the ratio of the those number of males and females whose ages are above 40 years in town A and B to those males and females whose ages are below and equals to 40 years in town D.View Solution

