The following table shows the amount of rice grown by a farmer in different years: Years:, 2000, 2001, 2002, 2003, 2004, 2005, 2006 Rice grown (in quintals):, 200, 180, 240, 260, 250, 200, 270 Plot a graph to illustrate this information.
Step by step video & image solution for The following table shows the amount of rice grown by a farmer in different years: Years:, 2000, 2001, 2002, 2003, 2004, 2005, 2006 Rice grown (in quintals):, 200, 180, 240, 260, 250, 200, 270 Plot a graph to illustrate this information. by Maths experts to help you in doubts & scoring excellent marks in Class 8 exams.
Updated on:21/07/2023Topper's Solved these Questions
Similar Questions
The following table shows the number of patients discharged from a hospital with HIV diagnosis in different years: Years:, 2002, 2003, 2004, 2005, 2006 No. of Patients:, 150, 170, 195, 225, 230 Represent this information by a graph.
View SolutionThe following table shows the sales of a commodity during the years 2000 to 2006. Years:, 2000, 2001, 2002, 2003, 2004, 2005, 2006 Sales (in lakhs of Rs.), 1.5, 1.8, 2.4, 3.2, 5.4, 7.8, 8.6 Draw a graph of this information.
View Solution
Knowledge Check
The following table shows the productions of food-grains (in million tons) in a state for the period 1999 - 2000 to 2003 - 2004. Read the table and the questions.
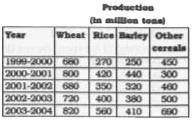
The different of average production of rice and the average production of barley over the years is (in million tonnes) :A50B60C80D40The following graph shows the production of cotton bales of 100 kg each in lakhs by different states A, B, C, D and E over the years. Study the graph and answer the following Questions.
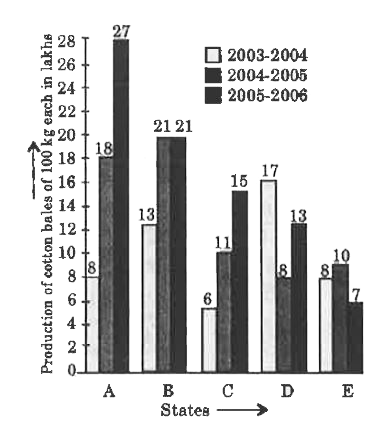
The production of State C in 2003-2004 is how many times its production in 2005-2006 ?A2.5B1.85C1.5D0.4Study the bar graph and answer the question that follows.
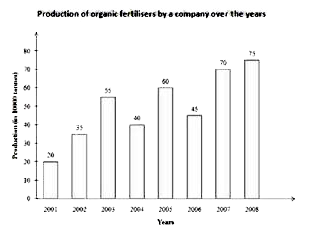
The ratio of the total production of organic fertilizers by the company in the years 2005. 2006 and 2008 to the total production in the years 2001, 2002, 2003 and 2004. is:A5:6B4:3C6:5D3:4
The following table shows the productions of food-grains (in million tons) in a state for the period 1999-2000 to 2003-2004. Read the table and answer the questions
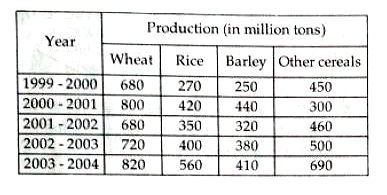
In 2002-2003, the percentage increase in the production of barley as compared to the previous year was
View SolutionUse the tables below to draw linear graphs. (a) The number of days a hill side city received snow in different years. Years 2003,2004,2005and2006 and Days 8,10,5,and12 (b) Population (in thousands) of men and women in a village in different years.
View SolutionThe following table shows the productions of food-grains (in million tons) in a state for the period 1999-2000 to 2003-2004. Read the table and answer the questions
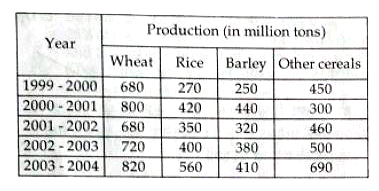
The difference of average production of rice and the average production of barley over the years is
View SolutionStudy the following graph and answer the following questions :-
Following graph shows the actual & target productin of a companry over the period (in thousand tonnes)
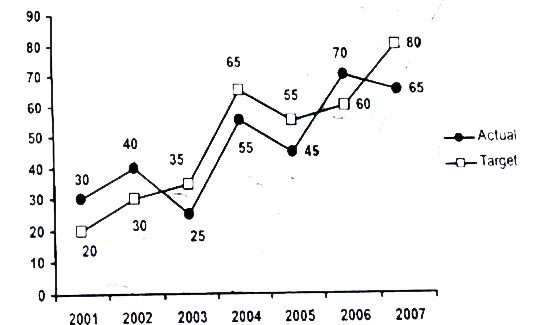
the target production in the year 2001, 2003 and 2005 together is what percent of acutal production of 2002, 2004 and 2006 together ?
View SolutionIn the following table, pass percentage of three schools from the year 2001 to the year 2006 are given. Which school students' performance is more consistent?
200120022003200420052006School X808979838465School Y929476758063School Z939767637085
View Solution
