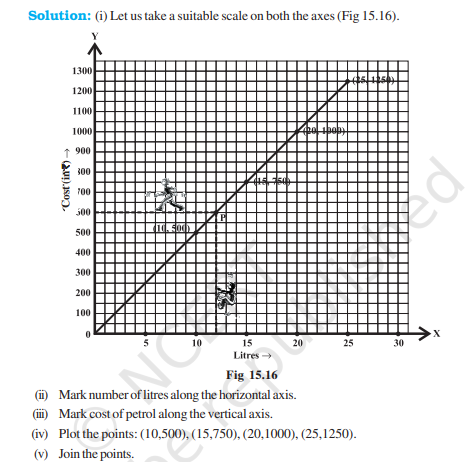
(Quantity and Cost) The following table gives the quantity of petrol and its cost.Plot a graph to show the data.

The below graph shows the above information

Topper's Solved these Questions
- INTRODUCTION TO GRAPHSBOOK - NCERTCHAPTER - INTRODUCTION TO GRAPHSEXERCISE - EXERCISE 15.3
2 Videos
- INTRODUCTION TO GRAPHSBOOK - NCERTCHAPTER - INTRODUCTION TO GRAPHSEXERCISE - EXERCISE 15.2
4 Videos
- INTRODUCTION TO GRAPHSBOOK - NCERTCHAPTER - INTRODUCTION TO GRAPHSEXERCISE - EXERCISE 15.2
4 Videos
- FACTORISATIONBOOK - NCERTCHAPTER - FACTORISATIONEXERCISE - EXERCISE 14.4
21 Videos
- LINEAR EQUATIONS IN ONE VARIABLEBOOK - NCERTCHAPTER - LINEAR EQUATIONS IN ONE VARIABLEEXERCISE - EXERCISE 2.3
9 Videos
Similar Questions
Knowledge Check
A trader mixes 25% kerosene to his petrol and then he sells the whole mixture at the price of petrol. If the cost price of kerosene be 50% of the cost price of petrol/what is the net profit percentage?
A1119%B1219%C9111%D20%A trader mixes 25% kerosene to his petrol and then he sells the whole mixture at the price of petrol. If the cost price of kerosene be 50% of the cost price of petrol/what is the net profit percentage?
A1119%B12(1)/9%C9111%D20%

Out of the total quantity of sugar sold, half the quantity is sold at the given rate while half the quantity is sold on a price increases by 20% . What is the total cost of entire quantity of sugar sold ?
View SolutionThe following table gives the GDP in rupees (crore) by the three sectors

Show the data as a bar diagram similar to graph in the chapter.
View SolutionDraw the graphs for the following tables of values, with suitable scales on the axes.
cost of apples.

View SolutionAn open tank with a square base and vertical sides is to be constructed from a metal sheet so as to hold a given quantity of water. Show that the cost of the material will be least when depth of the tank is half of its width.
View SolutionAn open tank with a square base and vertical sides is to be constructed form a metal sheet so as to hold a given quantity of water. Show that the cost of material will be least when depth of tank is half its width. If the cost is to be borne by nearby settled lower income families, for whom water will be provided, what kind of value is hidden in the question
View SolutionThe following table shows the cost function of a firm. Calculate its average variable cost and marginal cost as each level of output.

View Solution

