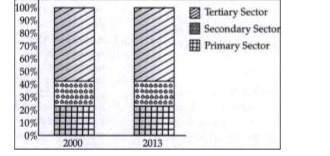
The following table gives the GDP in rupees (crore) by the three sectors

Show the data as a bar diagram similar to graph in the chapter.
Text Solution
Presentation of data in Bar graph

|
Similar Questions
Knowledge Check
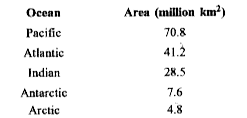
The following table gives the areas of the oceans of the word :

A pie diagram of this data is to be drawn. What is the angle which the sector representing Pacific Ocean subtends at the centre ?A167∘B97∘C67∘D18∘
The following table shows the number of fruits in a fruit shop. Represent the above data by a bar graph
View SolutionThe following table shows the favourite sports of 250 students of a school. Represent the data by a bar graph.
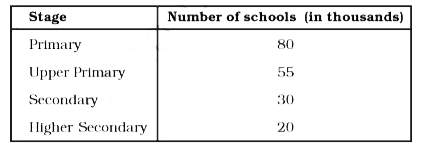
View SolutionThe following table gives the data of number of schools (stage-wise) of a country in the year 2002.

Draw a bar graph to represent the above data:
View Solution. The following data shows the year wise strength of a school.Represent the the above data by bar graph:
View SolutionFor the following table, draw a bar-graph

View SolutionReprent the following data by a deviation bar diagram :

View SolutionThe following table gives the data on the marks obtained by two students 'A and B' in five subjects :

Represent the data by a multiple bar diagram.
View Solution


