The given table shows the quantity of petrol and its cost.

Plot a graph to show the data.
Step by step video & image solution for The given table shows the quantity of petrol and its cost. Plot a graph to show the data. by Maths experts to help you in doubts & scoring excellent marks in Class 8 exams.
Updated on:21/07/2023Topper's Solved these Questions
- INTRODUCTION TO GRAPHS BOOK - MTG IIT JEE FOUNDATIONCHAPTER - INTRODUCTION TO GRAPHS EXERCISE - SOLVED EXAMPLES
25 Videos
- INTRODUCTION TO GRAPHS BOOK - MTG IIT JEE FOUNDATIONCHAPTER - INTRODUCTION TO GRAPHS EXERCISE - NCERT SECTIONS (15.1)
7 Videos
- FOOTSTEPS TOWARDS JEE MAINBOOK - MTG IIT JEE FOUNDATIONCHAPTER - FOOTSTEPS TOWARDS JEE MAINEXERCISE - Section B (Numerical Value Type Questions)
9 Videos
- LINEAR EQUATIONS IN ONE VARIABLEBOOK - MTG IIT JEE FOUNDATIONCHAPTER - LINEAR EQUATIONS IN ONE VARIABLEEXERCISE - Olympiad/HOTS Corner
15 Videos
Similar Questions
(Quantity and Cost) The following table gives the quantity of petrol and its cost.Plot a graph to show the data.

View SolutionThe table below gives the number of students who took part in the various items of the talent show as part of the annual school gathering. Make a bar graph to show this data :

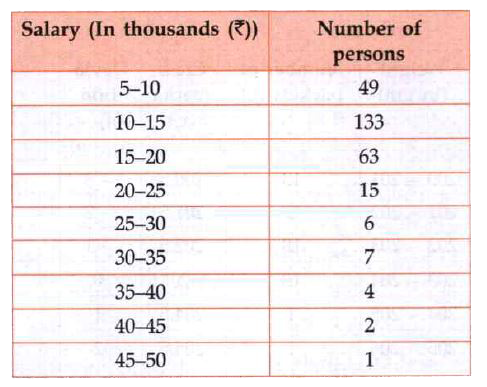
View SolutionThe table below shows the salaries of 280 persons.
Calculate the median and mode of the data.
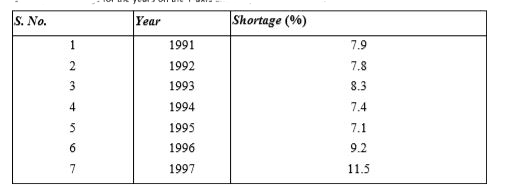
View SolutionThe following Table shows the total power shortage in India from 1991 - 1997. Show the data in the form of a graph. Plot shortage percentage for the years on the Y-axis and the year on the X-axis
View SolutionThe following Table shows the total power shortage in India from 1991 - 1997. Show the data in the form of a graph. Plot shortage percentage for the years on the Y-axis and the year on the X-axis

View SolutionThe table shows the data collected for Dhruv’s walking on a road.

(a) Plot a line graph for the given data using a suitable scale.
(b) In what time periods did Dhruv make the most progress?
View SolutionThe following table shows the number of fruits in a fruit shop. Represent the above data by a bar graph
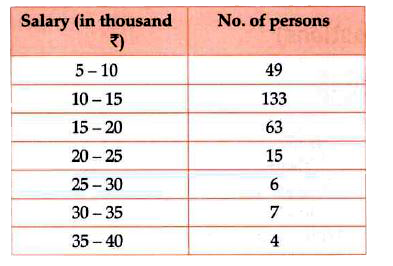
View SolutionThe table below show the salaries of 280 persons:
Calculate the median salary of the data.

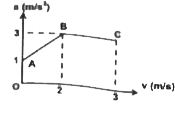
View SolutionA particle starts its motion from the origin in positive x-direction. The given graph shows the variation of acceleration (a) with velocity (v). Plot the corresponding graph between velocity and time.
View SolutionDiagram below depicts an experiment to find the effect of temperature on the rate of photosynthesis. The average number of bubbles per minute at each temperature is given in the table.
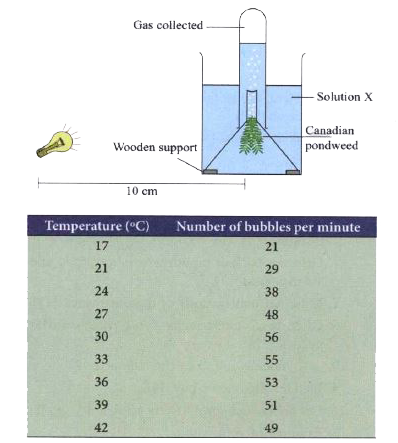
Plot a graph to show the relation between the rate of photosynthesis and temperature.
View Solution
