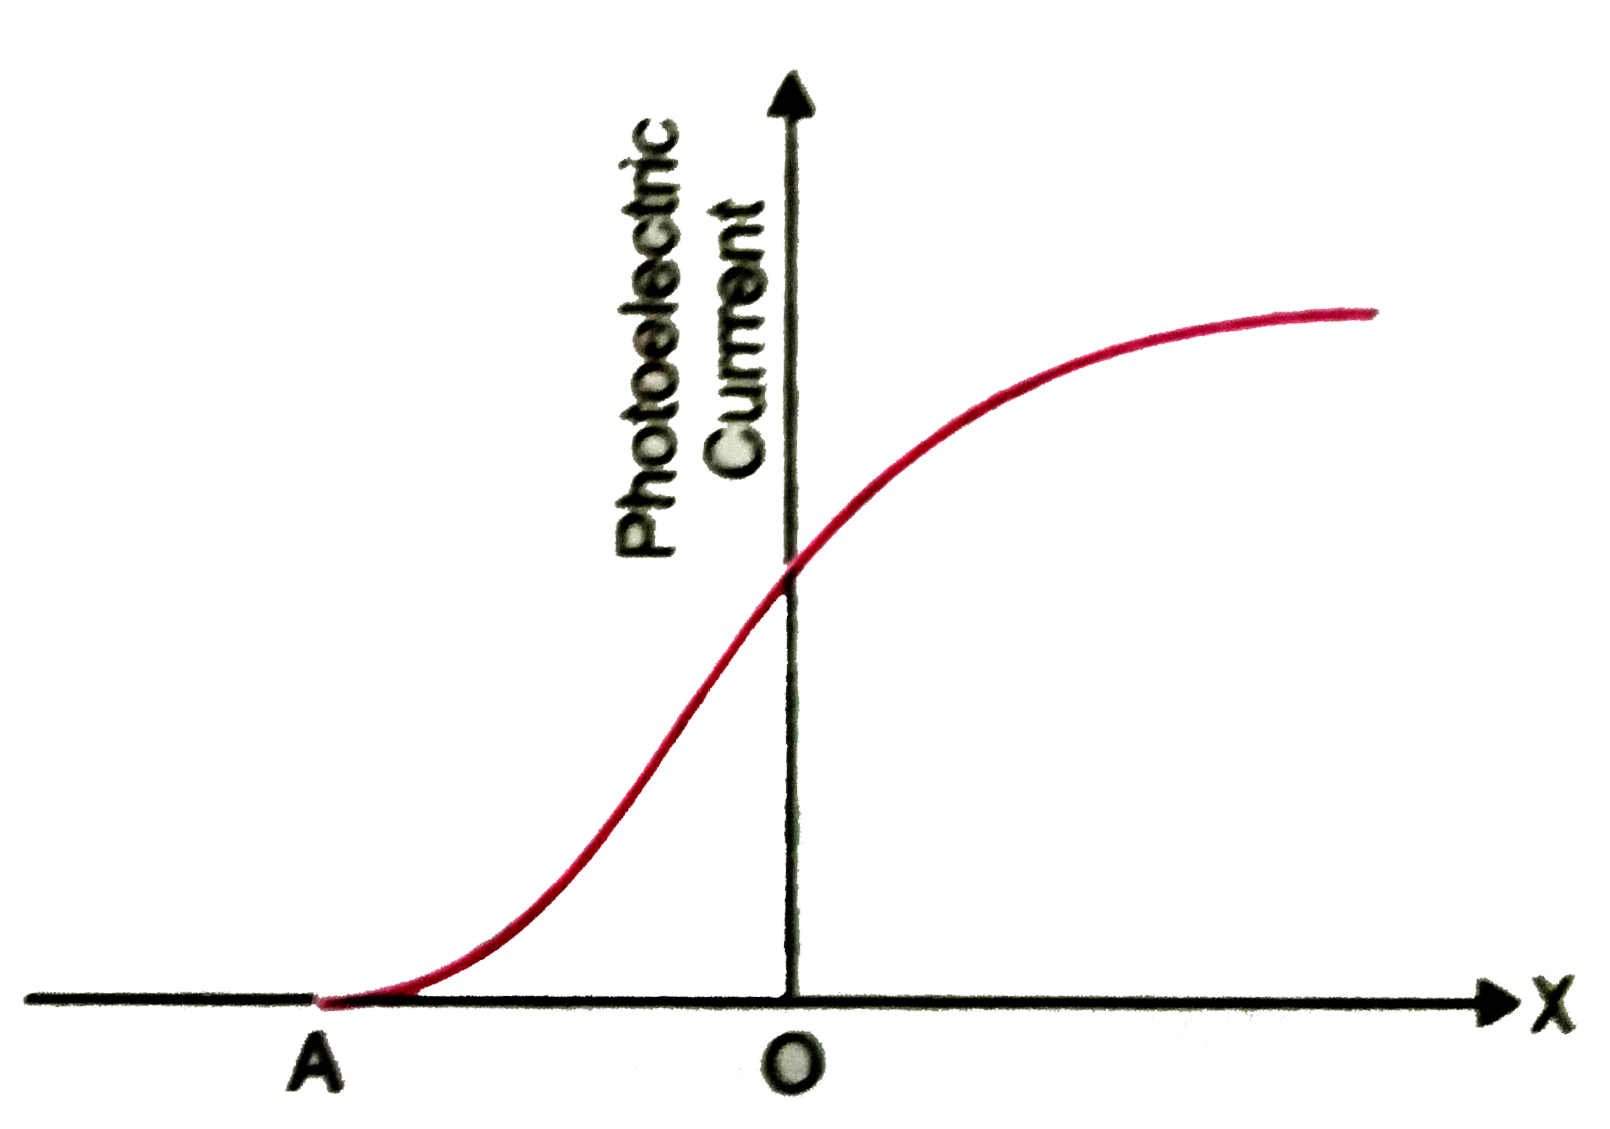
The graph show sthe variation of photocurrent for a photosensitive metal.
(a) Identify the variable X on horizontal axis.
(b) What does the point A on the horizontal axis represent ?
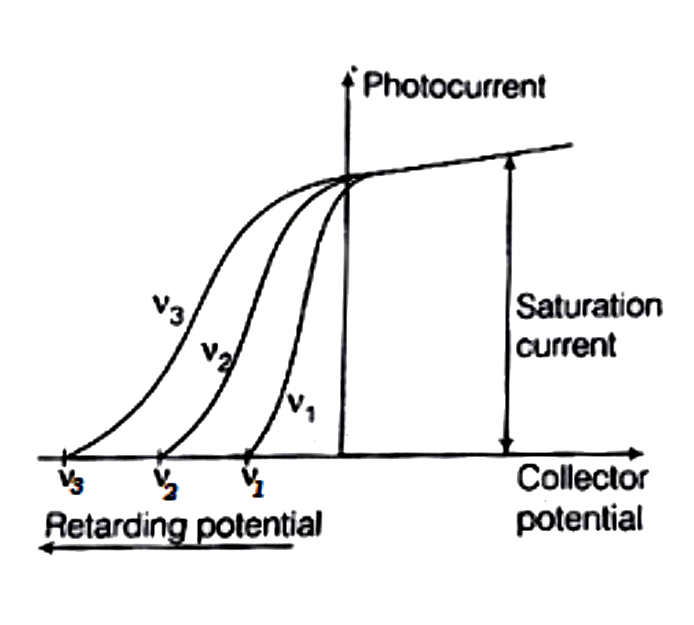
(c) Draw this graph for three different values of frequencies of incident radiation v1,v2andv3(v1>v2>v3) for same intensity.
(d) Draw this graph for three different values of intensities of incident radiation I1,I2andI3(I1>I2>I3) having same frequency.
(a) The variable X is the accelerating potential between emitter and collector plates.
(b) The point A represent the stopping potential.
Topper's Solved these Questions
- DUAL NATURE OF RADIATION AND MATTERBOOK - U-LIKE SERIESCHAPTER - DUAL NATURE OF RADIATION AND MATTEREXERCISE - SELF ASSESSMENT TEST SECTION-A (MULTIPLE CHOICE QUESTIONS)
6 Videos
- DUAL NATURE OF RADIATION AND MATTERBOOK - U-LIKE SERIESCHAPTER - DUAL NATURE OF RADIATION AND MATTEREXERCISE - SELF ASSESSMENT TEST SECTION-A (FILL IN THE BLANKS)
2 Videos
- DUAL NATURE OF RADIATION AND MATTERBOOK - U-LIKE SERIESCHAPTER - DUAL NATURE OF RADIATION AND MATTEREXERCISE - SHORT ANSWER QUESTIONS
27 Videos
- CURRENT ELECTRICITY BOOK - U-LIKE SERIESCHAPTER - CURRENT ELECTRICITY EXERCISE - SELF ASSESSMENT TEST (SECTION C )
3 Videos
- ELECTRIC CHARGES AND FIELDS BOOK - U-LIKE SERIESCHAPTER - ELECTRIC CHARGES AND FIELDS EXERCISE - SELF ASSESSMENT TEST (SECTION-B) (VERY SHORT ANSWER QUESTIONS)
4 Videos
Similar Questions
The following graph shows the variation of photoelectric current for a photosensitive metal .

(a) Identify the variable X on the horizontal line.
(b) What does the point A on the horizontal axis represent?
(c) Draw this graph for three different values of frequencies of incident radiation v1,v2andv3(v1>v2>v3) for same intensity.
(d) Draw this graph for three different values of intensities of incident radiation I1,I2,I3(I1>I2>I3) having same frequency.
View SolutionThe variation of photocurrent with collector potential for different frequencies of incident radiation v1,v2,v3 is as shown in the the graph , then

View Solution
Knowledge Check
The slope of the graph showing the variation of potential difference V on X-axis and current Y-axis gives conductor
AresistanceBresistivityCreciprocal of resistanceDconductivity
The variation of photocurrent with collector potential for different frequencies of incident radiation v1,v2,v3 is as shown in the the graph , then

View Solution(i) Plot a labelled graph of |Vs| where Vs is stopping potential versus frequency f of the incident radiation.
(ii) State how will you use this graph to determine the value of Planck.s constant.
View SolutionDefine photoelectric effect. Draw a graph to show the variation of stopping potential with frequency of incident radiation on a metal plate.
View SolutionDraw a plot showing the variation of photoelectric current versus the intensity of incident radiation on a given photosensitive surface.
View SolutionDraw a plot showing the variation of photoelectric current versus the intensity of incident radiation on a given photosenstive surface.
View SolutionThe slope of the graph showing the variation of potential difference V on X-axis and current Y-axis gives conductor
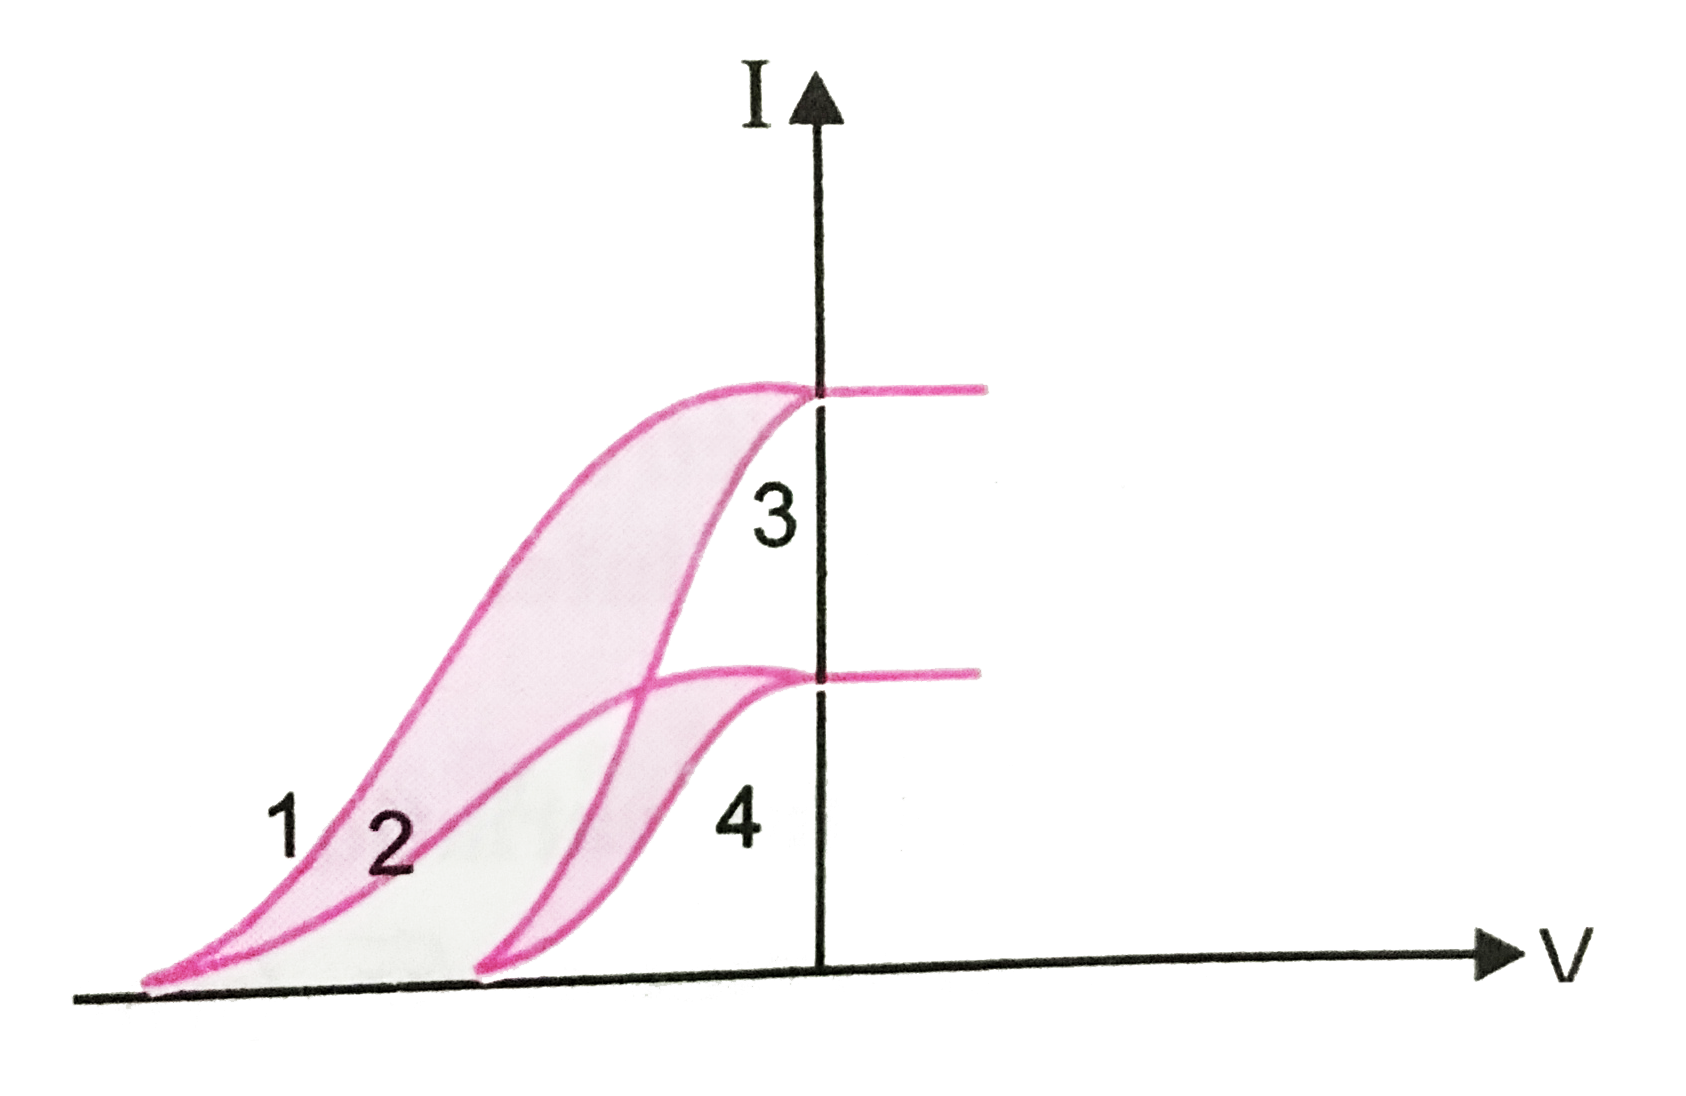
View SolutionThe graph of Fig. shows the variation of photoelectric current (I) versus applied voltage (V) for the two different photosensitive materials for two different intensities of the incident radiation. Identify the pairs of curves that correspond to different materials but same intensity of incident radiation.

View Solution
