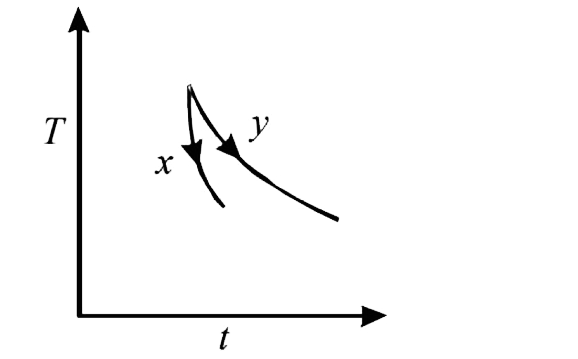
The graph shown represents the variation of temperature (T) of two bodies, x and y, having same surface area, with time (t) due to the emission of radiation. Then ,

The correct Answer is:B, C
Variation of temperature with time
in the graph is greater for the curve x.
(Mass) ( specific heat )
since is greater for x than for y
Again constant = ( constant )a
hence
Topper's Solved these Questions
- BOOK - MTG-WBJEECHAPTER - HEAT AND THERMAL PHYSICSEXERCISE - WB JEE PREVIOUS YEARS QUESTIONS15videos
HEAT AND THERMAL PHYSICS
- BOOK - MTG-WBJEECHAPTER - HEAT AND THERMAL PHYSICSEXERCISE - WB JEE WORKOUT ( CATEGORY 2: SINGLE OPTION CORRECT TYPE )14videos
HEAT AND THERMAL PHYSICS
- BOOK - MTG-WBJEECHAPTER - GRAVITATIONEXERCISE - WB JEE Previous Years Questions (CATEGORY 1: Single Option Correct Type7videos
GRAVITATION
- BOOK - MTG-WBJEECHAPTER - KINEMATICS EXERCISE - WB JEE Previous Years Questions (CATEGORY 3 : One or More than One Option Correct Type (2 Marks) )1videos
KINEMATICS
Similar Questions
The graph, shown in the adjacent diagram, represents the variation of temperature (T) of two bodies, x and y having same surface area, with time (t) due to the emission of radiation. Find the correct relation between the emissivity and absorptivity power of the two bodies
 View Solution
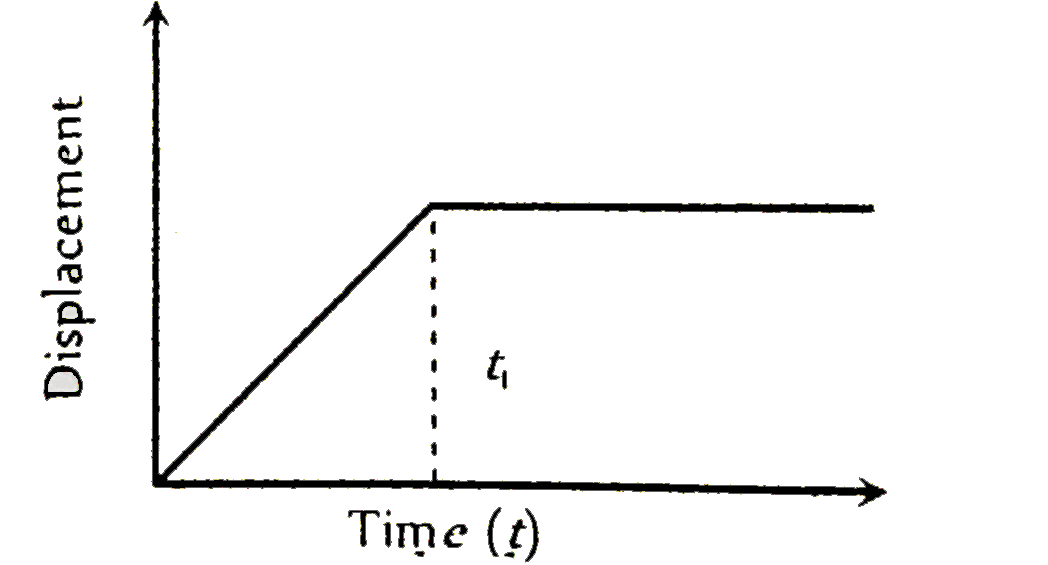
The x-t graph shown in figure represents
 View Solution
Knowledge Check
- Question 1 - Select One
The graph, shown in the adjacent diagram, represents the variation of temperature (T) of two bodies, x and y having same surface area, with time (t) due to the emission of radiation. Find the correct relation between the emissivity and absorptivity power of the two bodies
 AEx>Ey&ax<ayBEx<Ey&ax>ayCEx>Ey&ax>ayDEx<Ey&ax<ay
 - Question 2 - Select One
The graph shown in the adjacement diagram represents the variation of temperature (T) of two bodies x and y having the same surface area, with time (t). Both of these bodies lose heat only due to the emission of radiation. Find the correct relation between the emissive and absorptive power of the two bodies.
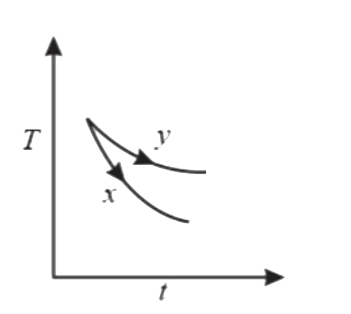 AEx>Eyandax<ayBEx<Eyandax>ayCEx>Eyandax>ayDEx<Eyandax<ay
 - Question 3 - Select One
Which of the following graphs represents the variation of activity (A) of a radioactive substance with time (t).
A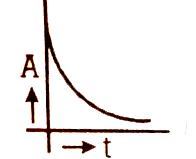 B
B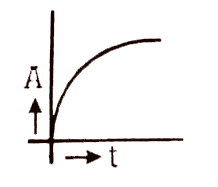 C
C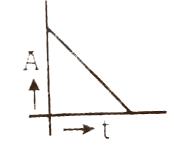 D
D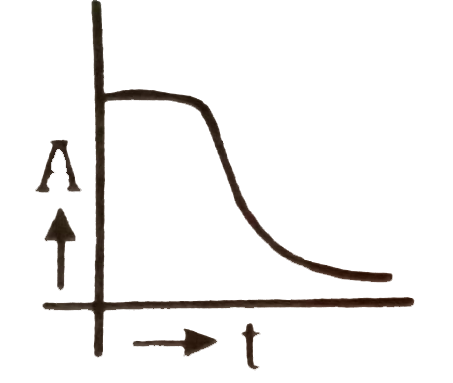
The x -t graph shown in figure represents
 View Solution
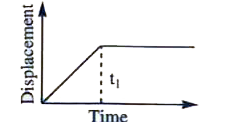
The x-t graph shown in figure represents.
 View Solution
The graph shown the variation with times t of the velocity v of an object . Which one of the following graphs best represents the variation of acceleration a of the object with time t?
 View Solution
which of the following graph represents the variation of resistivity (ρ) with temperature (T) for copper?
View SolutionThe graph shown the variation with times t of the velocity v of an object . Which one of the following graphs best represents the variation of acceleration a of the object with time t?
 View Solution
