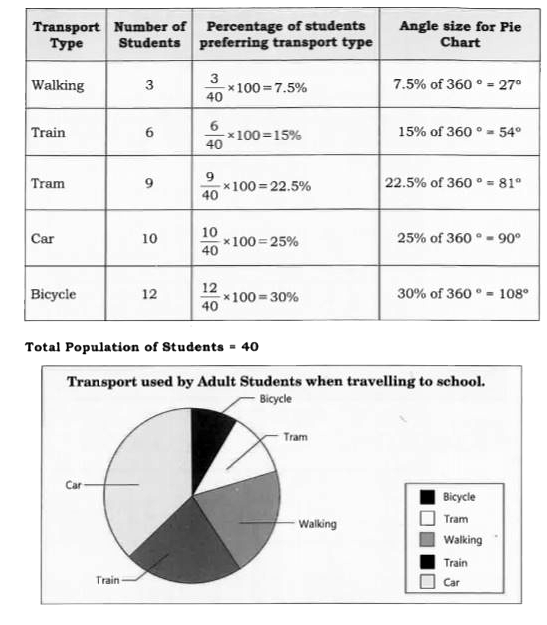
Construct as pie chargE with this information.
Students in an adult school were surveyed about the type of transport they use to travel to school.
The results were:
Walking 3, Train 6, Tram 9, Car 10, Bicycle 12.
Topper's Solved these Questions
- GRAPHICAL REPRESENTATION OF DATABOOK - FULL MARKSCHAPTER - GRAPHICAL REPRESENTATION OF DATAEXERCISE - NCERT TEXTBOOK QUESTIONS SOLVED (ACTIVITY)
5 Videos
- GRAPHICAL REPRESENTATION OF DATABOOK - FULL MARKSCHAPTER - GRAPHICAL REPRESENTATION OF DATAEXERCISE - ADDITIONAL QUESTIONS SOLVED (VERY SHORT ANSWER QUESTIONS)
11 Videos
- DATA-ITS SOURCE AND COMPLIATIONBOOK - FULL MARKSCHAPTER - DATA-ITS SOURCE AND COMPLIATIONEXERCISE - ADDITIONAL QUESTION SOLVED (IV. VIVA-VOCE QUESTIONS)
8 Videos
- HUMAN DEVELOPMENTBOOK - FULL MARKSCHAPTER - HUMAN DEVELOPMENTEXERCISE - Worksheet (Based on Chapter -4)
12 Videos
Similar Questions
A survey was carried out on 30 students of class VI in a school. Data about the different modes of transport used by them to travel to school was displayed as pictograph. What can you conclude from the pictograph?
View SolutionA survey was carried out on 30 students of class VI in a school. Data about the different modes of transport used by them to travel to school was displayed as pictograph. What can you conclude from the pictograph?
View Solution
Knowledge Check
The histogram shows the number of students using different modes of transport to commute from residence to school.
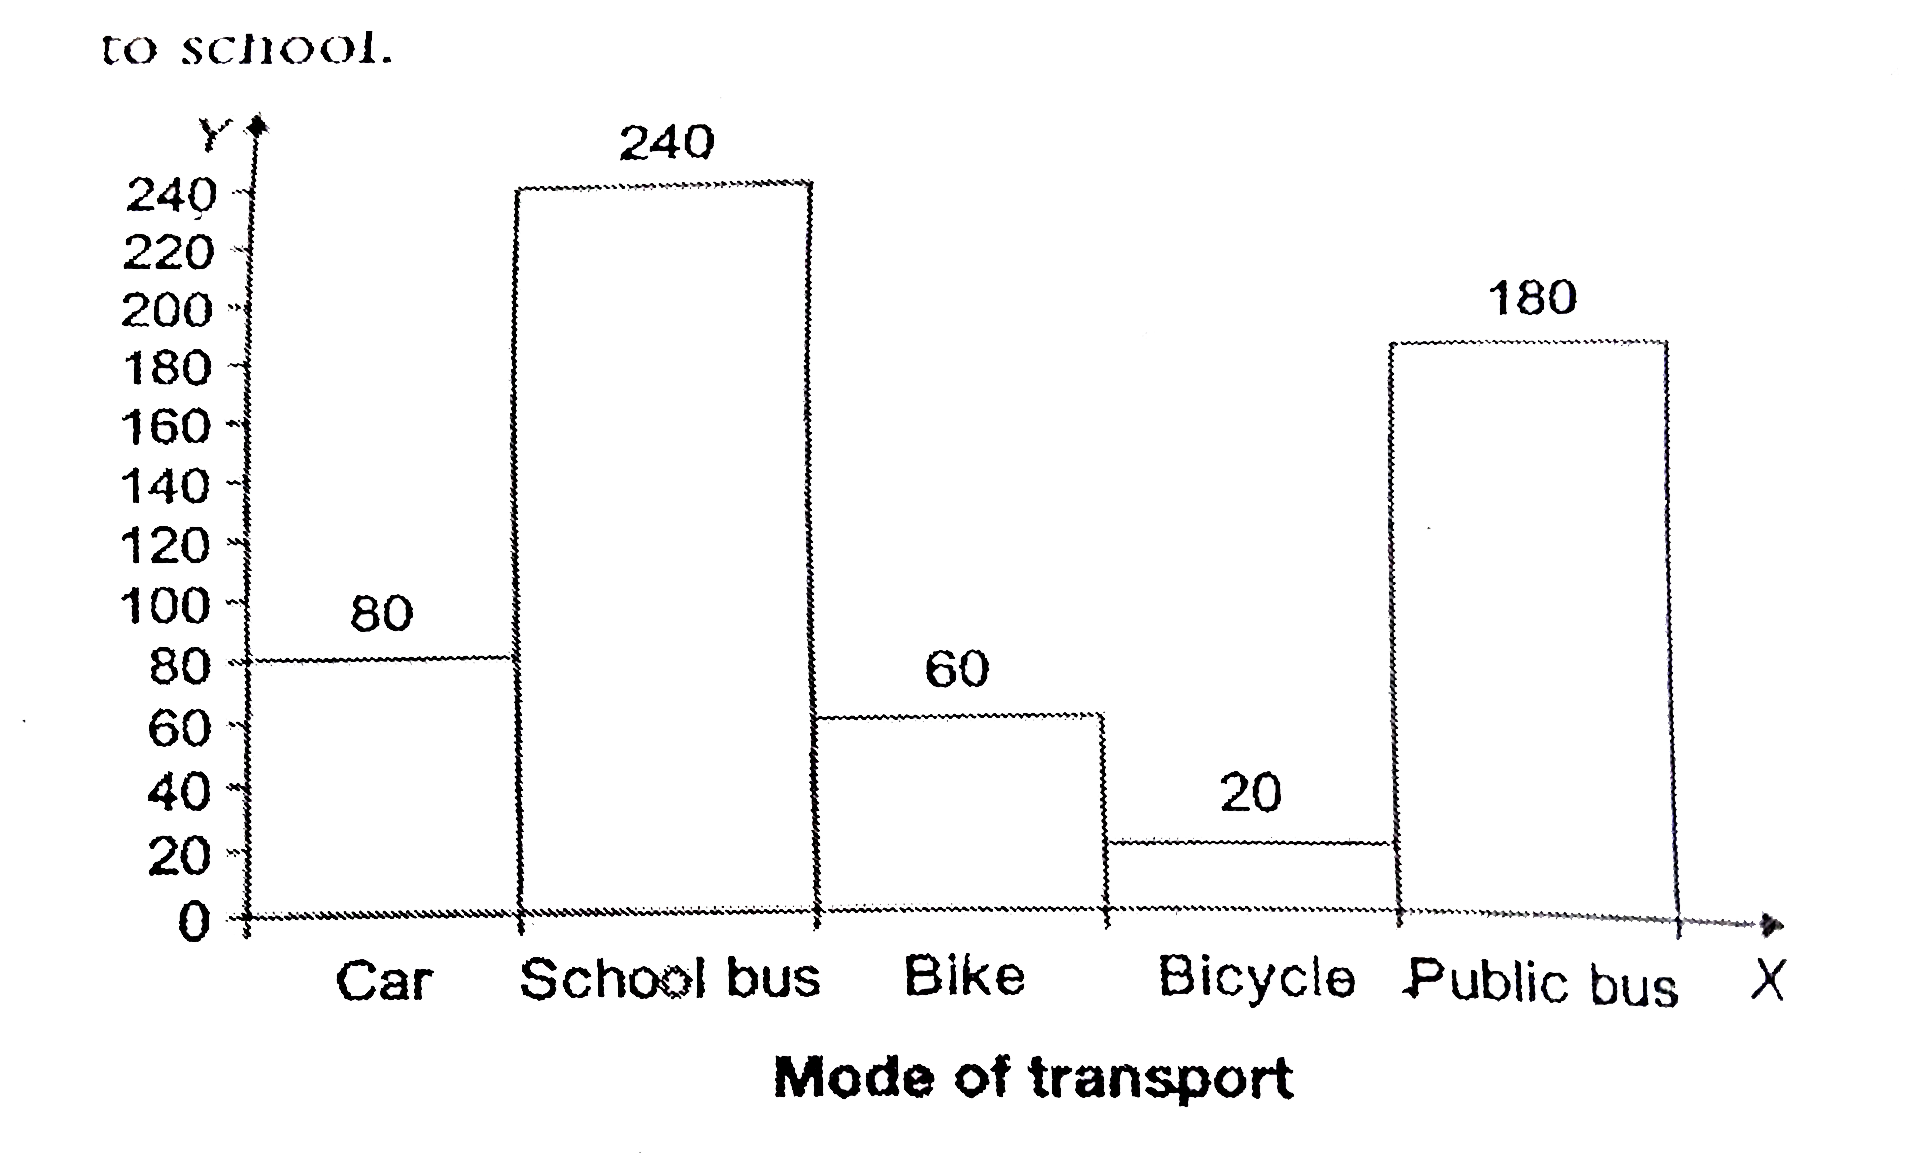
From the bar graph, answer the following question :
If 6 girls travel to school by bicycle, then how many boys travel by bicycle ?A20B16C14D6The Harrisburg Recreation Center recently changed its hours to open 1 hour later and close 3 hours later than it had previously. Residents of Harrisburg age 16 or older were given a survey and 560 residents replied. The survey asked each resident his or her student status (high school, college, or nonstudent) and what he or she thought about the change in hour (approve, disapprove, or no opinion). The results are summarized in the table below.

What fraction of these nonstudent resisdents replied they disapproved of the change in hours?A13B445C1475D353485
A survey was carried out in a certain school to find about different modes of transport used by students to travel to school each day. 30 students of class VI were interviewed and the data obtained was displayed in the form of a pictographs given below: Mode of Transport, Number of Students Scooter, Figure Public Bus, Figure School Bus, Figure Cycle, Figure Walking, Figure Look at the above pictograph and answer the following questions: Look at the above pictograph and answer the following questions: How many students are using cycle or walking as a mode of travel? Which is most popular mode of travel?
View SolutionA survey was carried out in a certain school to find about different modes of transport used by students to travel to school each day. 30 students of class VI were interviewed and the data obtained was displayed in the form of a pictographs given below: Mode of Transport, Number of Students Scooter, Figure Public Bus, Figure School Bus, Figure Cycle, Figure Walking, Figure Look at the above pictograph and answer the following questions: Look at the above pictograph and answer the following questions: How many students are using cycle or walking as a mode of travel? Which is most popular mode of travel?
View SolutionThe pie chart on the right shows the result of a survey carried out to find the modes of travel used by the children to go to school. Study the pie chart and answer the questions that follow.
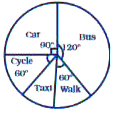
What fraction of children travel by car?
View SolutionThe pie chart on the right shows the result of a survey carried out to find the modes of travel used by the children to go to school. Study the pie chart and answer the questions that follow.
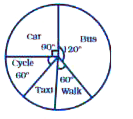
What is the most common mode of transport?
View SolutionThe pie chart on the right shows the result of a survey carried out to find the modes of travel used by the children to go to school. Study the pie chart and answer the questions that follow.
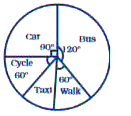
If 18 children travel by car, how many children took part in the survey?
View SolutionThe pie chart on the right shows the result of a survey carried out to find the modes of travel used by the children to go to school. Study the pie chart and answer the questions that follow.
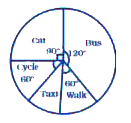
By which two modes of transport are equal number of children travelling?
View Solution
