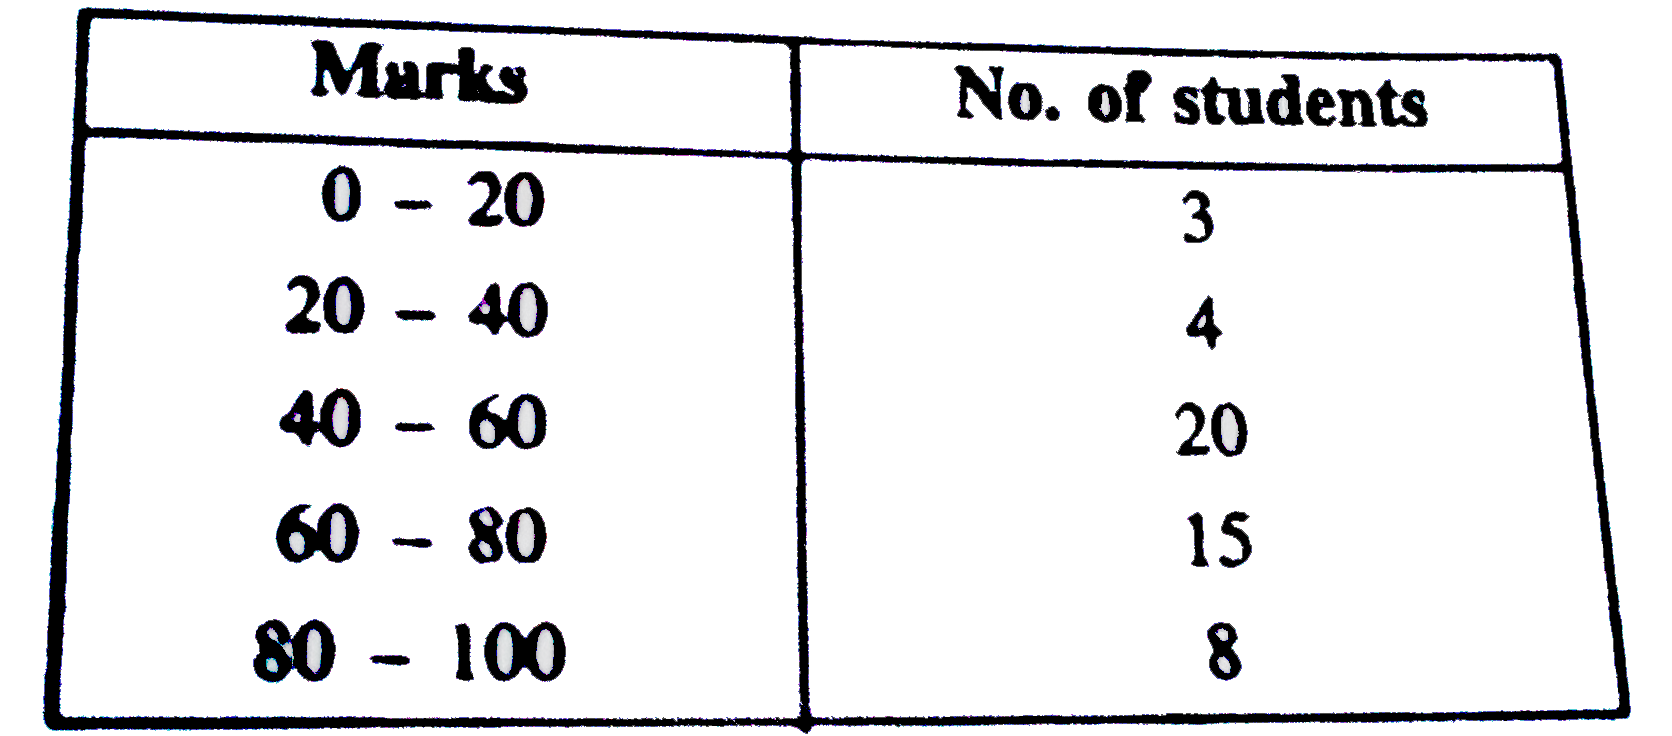
For the following information of wages of 30 workers in a factory, the value of Q1+Q2+Q3 is

1187.5
789.5
705
872.5
The correct Answer is:A
Arranging the wages in ascending order, we obtain the following table :

We have,n=30
Lower Quartile:
Q1= Value of (n+14)th observation
⇒Q−(1)= Value of (30+14)th observation
⇒Q1= Value of (7.75)th observation
⇒Q1= Value of 7th observation
+34( Value of 8th Observation− Value of 7th Observation)
⇒Q1=300+34(320−300)=315
Middle quartile (Median):
Q2=A.M of (n2)thand(n2+1)th observation
⇒Q2= Value of 15th Observation+ Value of 16th Observation2
⇒Q2=380+4002=390
Upper Quartile:
Q3= Value of 3(n+14)th observation
⇒Q3= Value of 3(30+14)th observation
⇒Q3= Value of 23.25th observation
+14(Value of 24th observation − Value of 23rd observation)
⇒Q3=480+14(490−480)=482.50
∴Q1+Q2+Q3=315+390+482.50=1187.50
Topper's Solved these Questions
- MEASURES OF CENTRAL TENDENCYBOOK - OBJECTIVE RD SHARMACHAPTER - MEASURES OF CENTRAL TENDENCYEXERCISE - Section I - Solved Mcqs
24 Videos
- MEASURES OF CENTRAL TENDENCYBOOK - OBJECTIVE RD SHARMACHAPTER - MEASURES OF CENTRAL TENDENCYEXERCISE - Exercise
40 Videos
- MAXIMA AND MINIMA BOOK - OBJECTIVE RD SHARMACHAPTER - MAXIMA AND MINIMA EXERCISE - Chapter Test
30 Videos
- MISCELLANEOUS EQUATIONS AND INEQUATIONS BOOK - OBJECTIVE RD SHARMACHAPTER - MISCELLANEOUS EQUATIONS AND INEQUATIONS EXERCISE - Chapter Test
30 Videos
Similar Questions
Knowledge Check
For the following data the value of Q1+Q3−Q2, is
Age in years:20304050607080No. of members:361132153140513AQ1BQ2CQ3D2Q2The average of daily wages for the workers of the two factories combined is
 A2⋅22B3⋅15C4.10Dnone of these
Consider the following distribution of daily wages of 50 workers of a factory.Find the mean daily wages of the workers of the factor}- by using an appropriate method.
View SolutionConsider the following distribution of daily wages of 50 workers of a factory.

Find the mean daily wages of the workers of factory by using an appropriate method.
View SolutionThe following table gives the weekly wage of workers in a factory:

Find the mean
View SolutionConsider the following data:

What is the variability in the wages of the workers in Factory - A?
View SolutionThe following histogram shows the monthly wages (in Rs.) of workers in a factory: Figure Find the largest and least number of workers and also their wages in rupees.
View SolutionFor the following data the value of Q1+Q3−Q2, is
Age in years:20304050607080No. of members:361132153140513
View Solution


