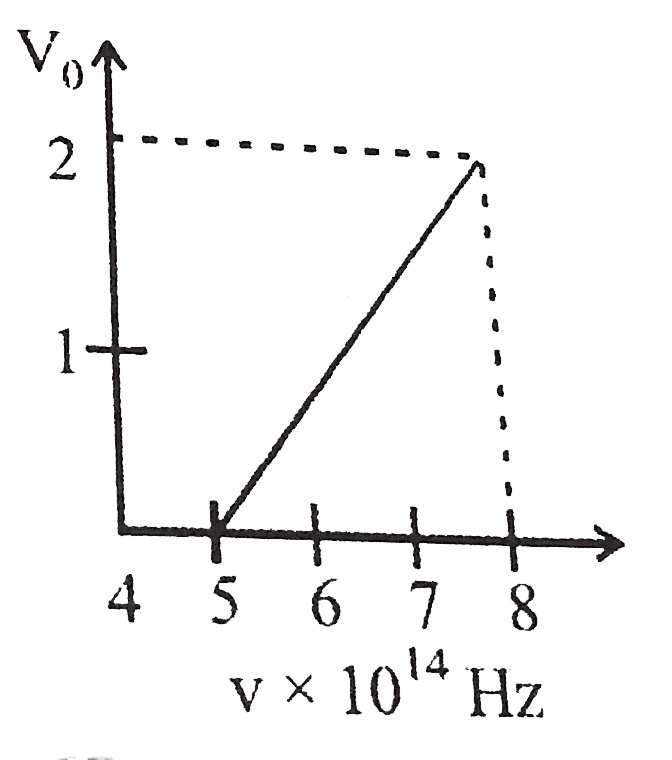
The figure shows different graphs between stopping potential (V0) and frequency (v) for photosensitive surface of cesium , potassium , sodium and lithium. The plots are parallel. Correct ranking of the targets according to their work function greatest forst will be

lithium, sodium, potassium, cesium, (b) all tie
Topper's Solved these Questions
- BOOK - RESNICK AND HALLIDAYCHAPTER - PHOTONS AND MATTER WAVESEXERCISE - PROBLEMS50videos
PHOTONS AND MATTER WAVES
- BOOK - RESNICK AND HALLIDAYCHAPTER - PHOTONS AND MATTER WAVESEXERCISE - PRACTICE QUESTIONS (Single Correct Choice Type)47videos
PHOTONS AND MATTER WAVES
- BOOK - RESNICK AND HALLIDAYCHAPTER - PHOTONS AND MATTER WAVESEXERCISE - PRACTICE QUESTIONS(Integer Type)4videos
PHOTONS AND MATTER WAVES
- BOOK - RESNICK AND HALLIDAYCHAPTER - OSCILLATIONSEXERCISE - Practice Questions57videos
OSCILLATIONS
- BOOK - RESNICK AND HALLIDAYCHAPTER - RELATIVITYEXERCISE - PRACTICE QUESTIONS (Integer Type)5videos
RELATIVITY
Similar Questions
Knowledge Check
- Question 1 - Select One
Graph between stopping potential and frequency of photon is given in figure
_2019_CBT7_E01_021_Q01.png)
Find out work function of metal:A0.82B0.92C0.72D0.62 - Question 2 - Select One
The figure showing the correct relationship between the stopping potential V and the frequency v of the light for potassium and tungsten is
A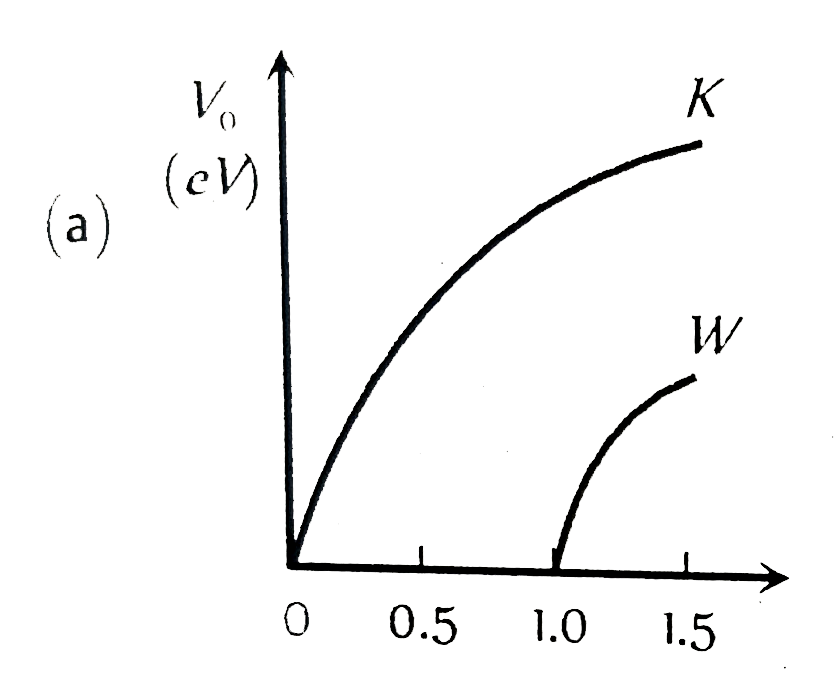 B
B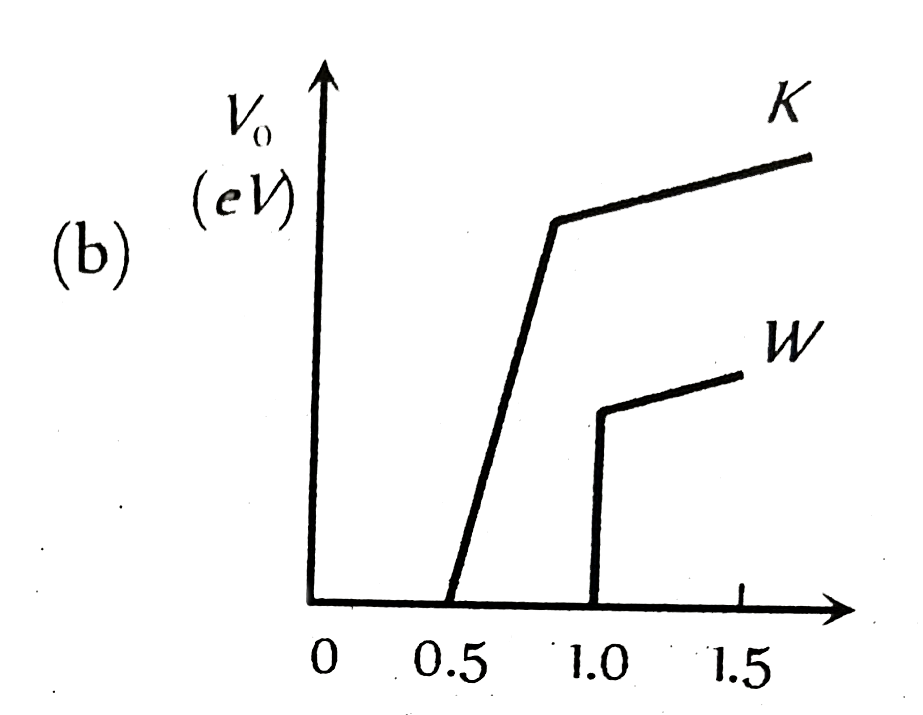 C
C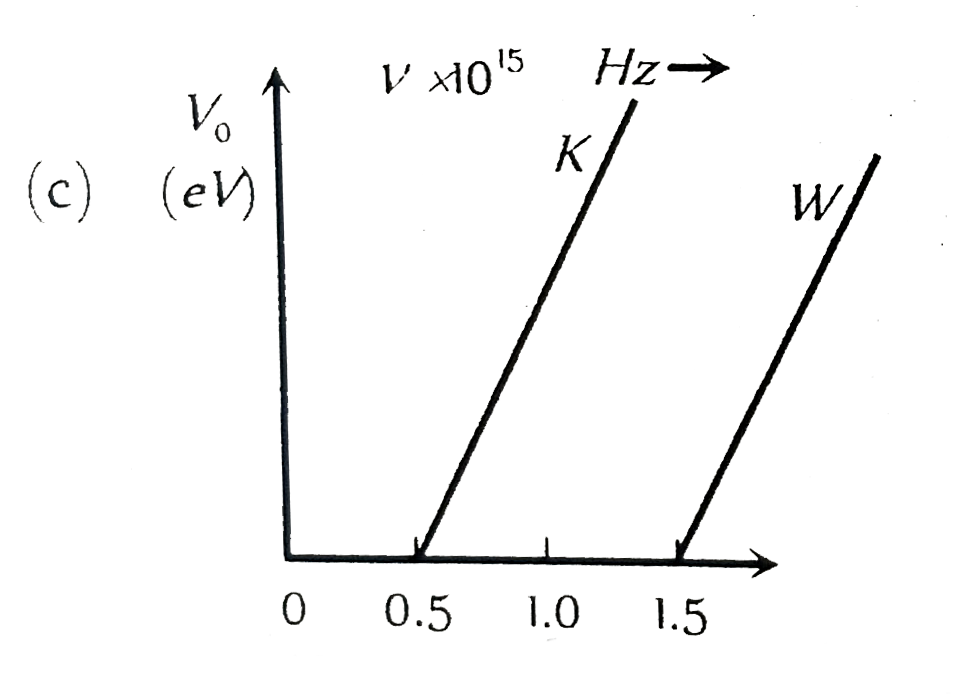 D
D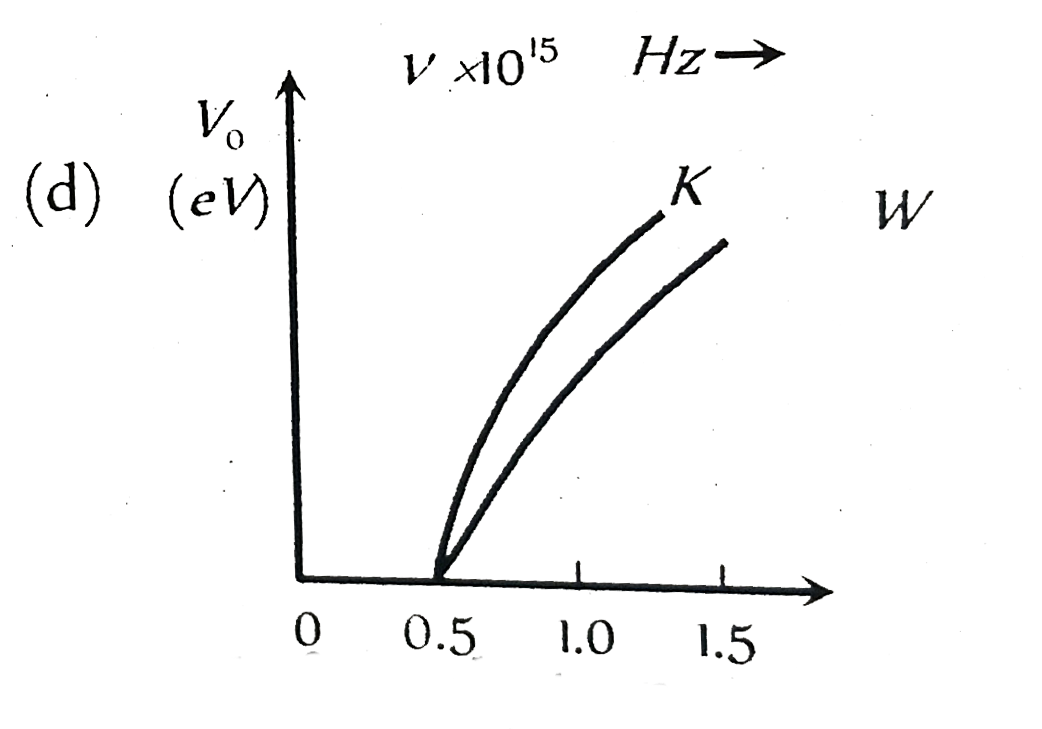
- Question 3 - Select One
Choose the graph showing the correct relationship between the stopping potential V0 and the frequency v of light for potassium and tungsten.
A B
B C
C D
D
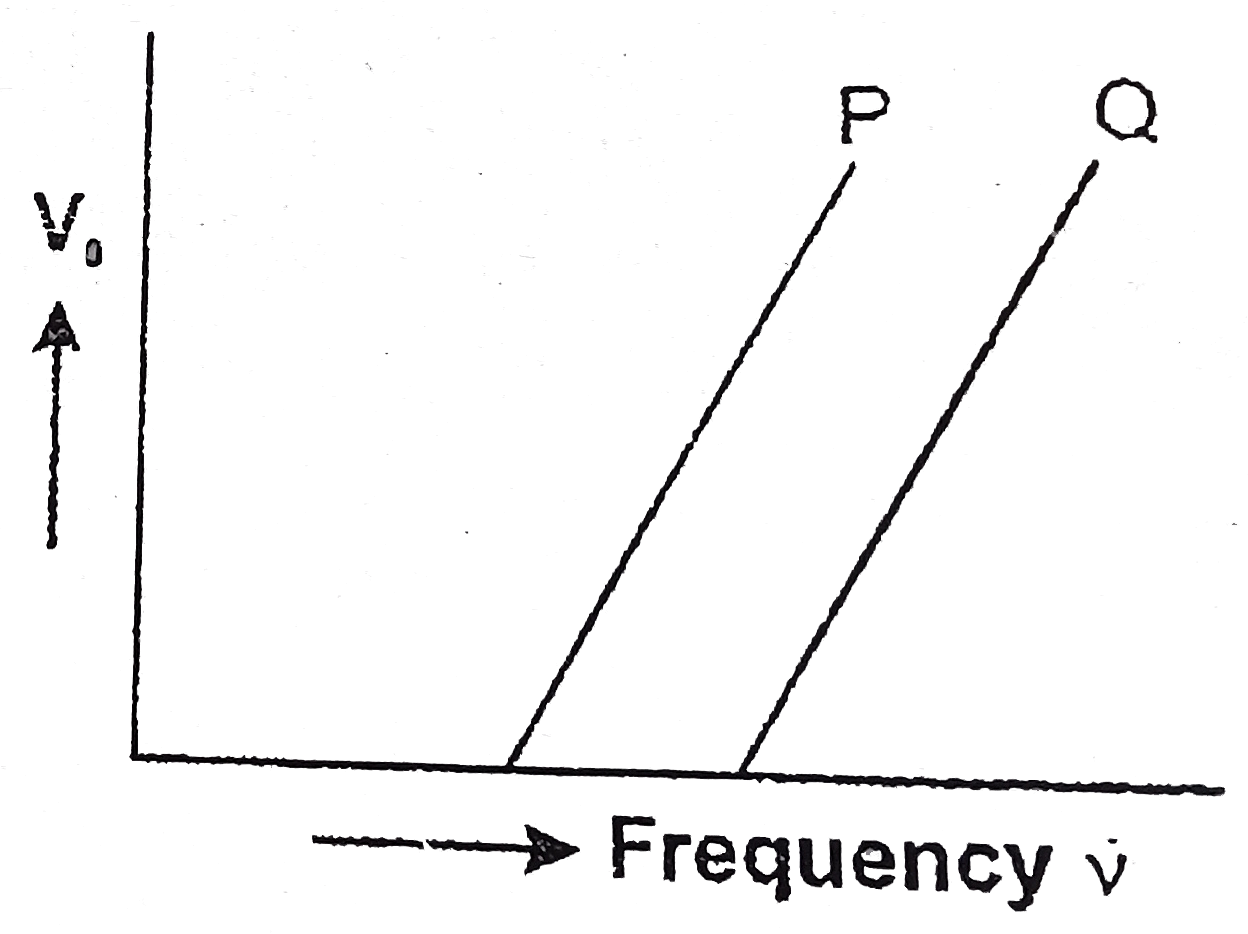
The graph between the stopping potential V0 and frequency v for two different metal plates P and Q are shown in the figure. Which of the metals has greater threshold wavelength and work function.
 View Solution
Draw a graph between stopping potential and the frequency of two metals A and B having threshold frequencies v0and2v0 .
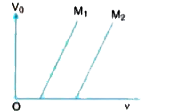
View SolutionThe variation of the stopping potential (V0) with the frequency (v) of the light incident on two different photosensitive surfaces M1andM2 is shown in the figure. Identify the surfaces which has greater value of the work function.
 View Solution
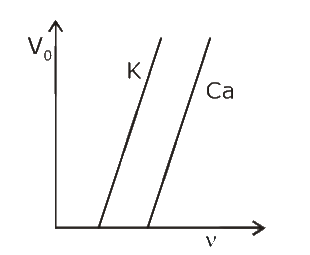
In the diagram, graph are drawn between stopping potential V0 and frequency v for the elements K and Ca. According this to diagram
 View Solution
Figure shows the graph of stopping potential verus that frequency of a photosensitive metal. The plank's constant and work funcation of the metal are
_S01_035_Q01.png) View Solution
View Solution


