Which of the following graph represent the variation of particle momentum and associated de Broglie wavelength?
A

B

C
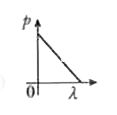
D

Text Solution
The correct Answer is:D
|
Topper's Solved these Questions
- PHOTONS AND MATTER WAVESBOOK - RESNICK AND HALLIDAYCHAPTER - PHOTONS AND MATTER WAVESEXERCISE - PRACTICE QUESTIONS (More than One Correct Choice Type)
5 Videos
- PHOTONS AND MATTER WAVESBOOK - RESNICK AND HALLIDAYCHAPTER - PHOTONS AND MATTER WAVESEXERCISE - PRACTICE QUESTIONS (Link Comprehension)
17 Videos
- PHOTONS AND MATTER WAVESBOOK - RESNICK AND HALLIDAYCHAPTER - PHOTONS AND MATTER WAVESEXERCISE - PROBLEMS
50 Videos
- OSCILLATIONSBOOK - RESNICK AND HALLIDAYCHAPTER - OSCILLATIONSEXERCISE - Practice Questions
57 Videos
- RELATIVITYBOOK - RESNICK AND HALLIDAYCHAPTER - RELATIVITYEXERCISE - PRACTICE QUESTIONS (Integer Type)
5 Videos
Similar Questions
Knowledge Check
Which of the following figure represents the variation of particle momentum and the associated de - Broglie wavelength ?
A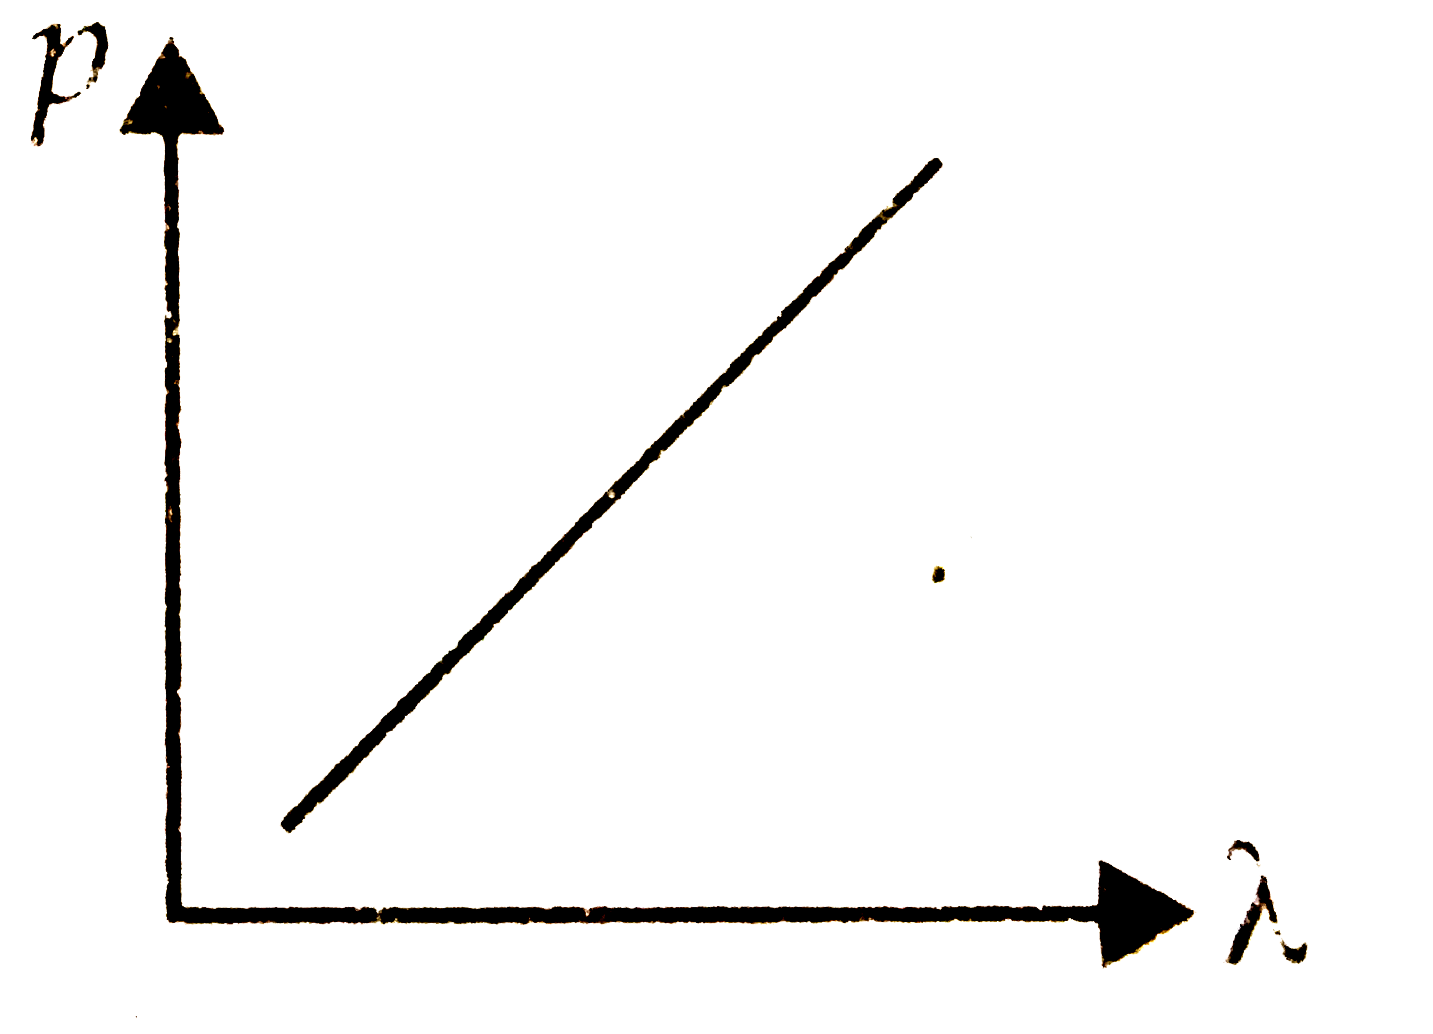 B
B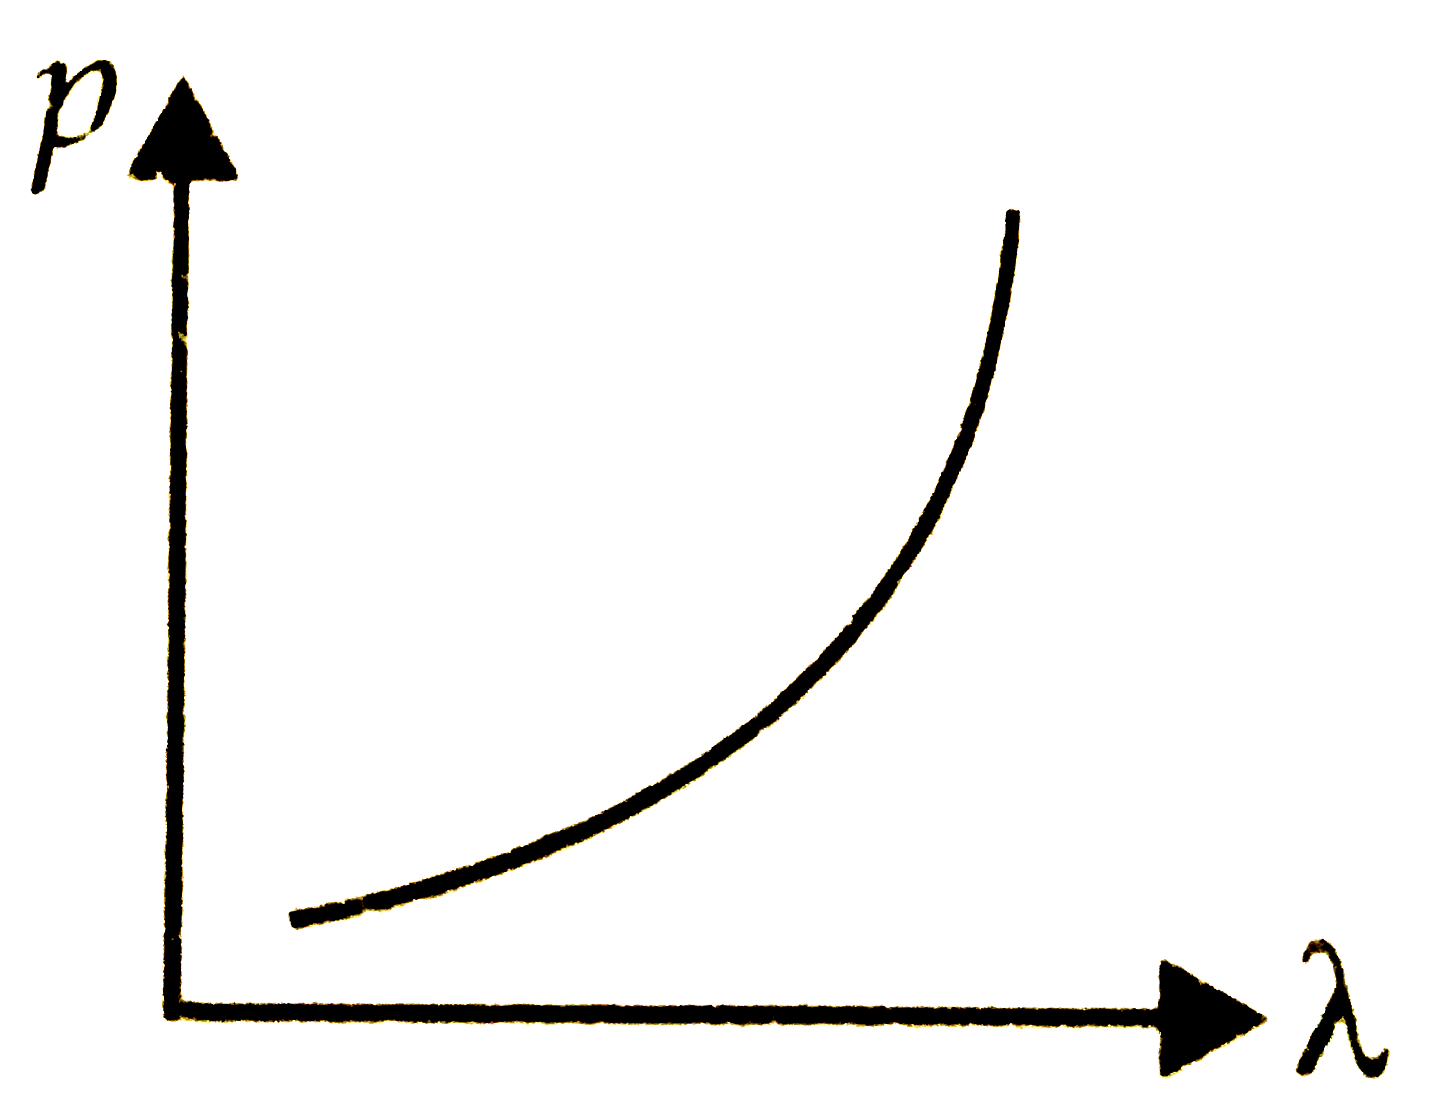 C
C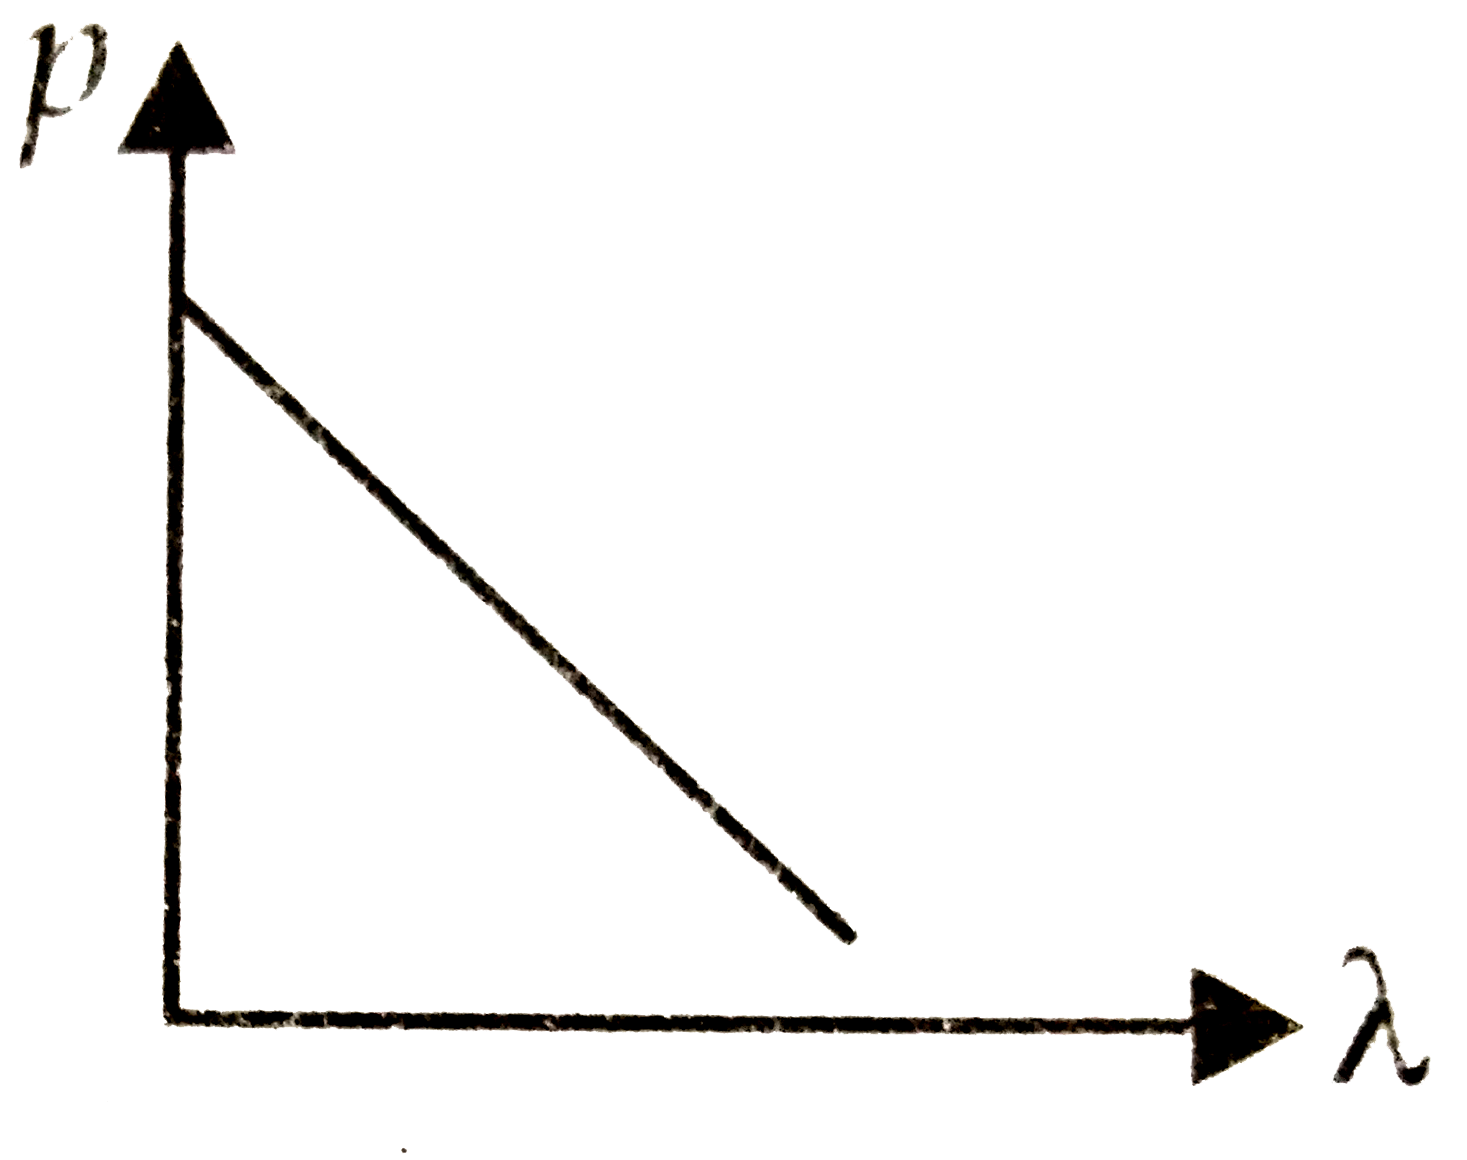 D
D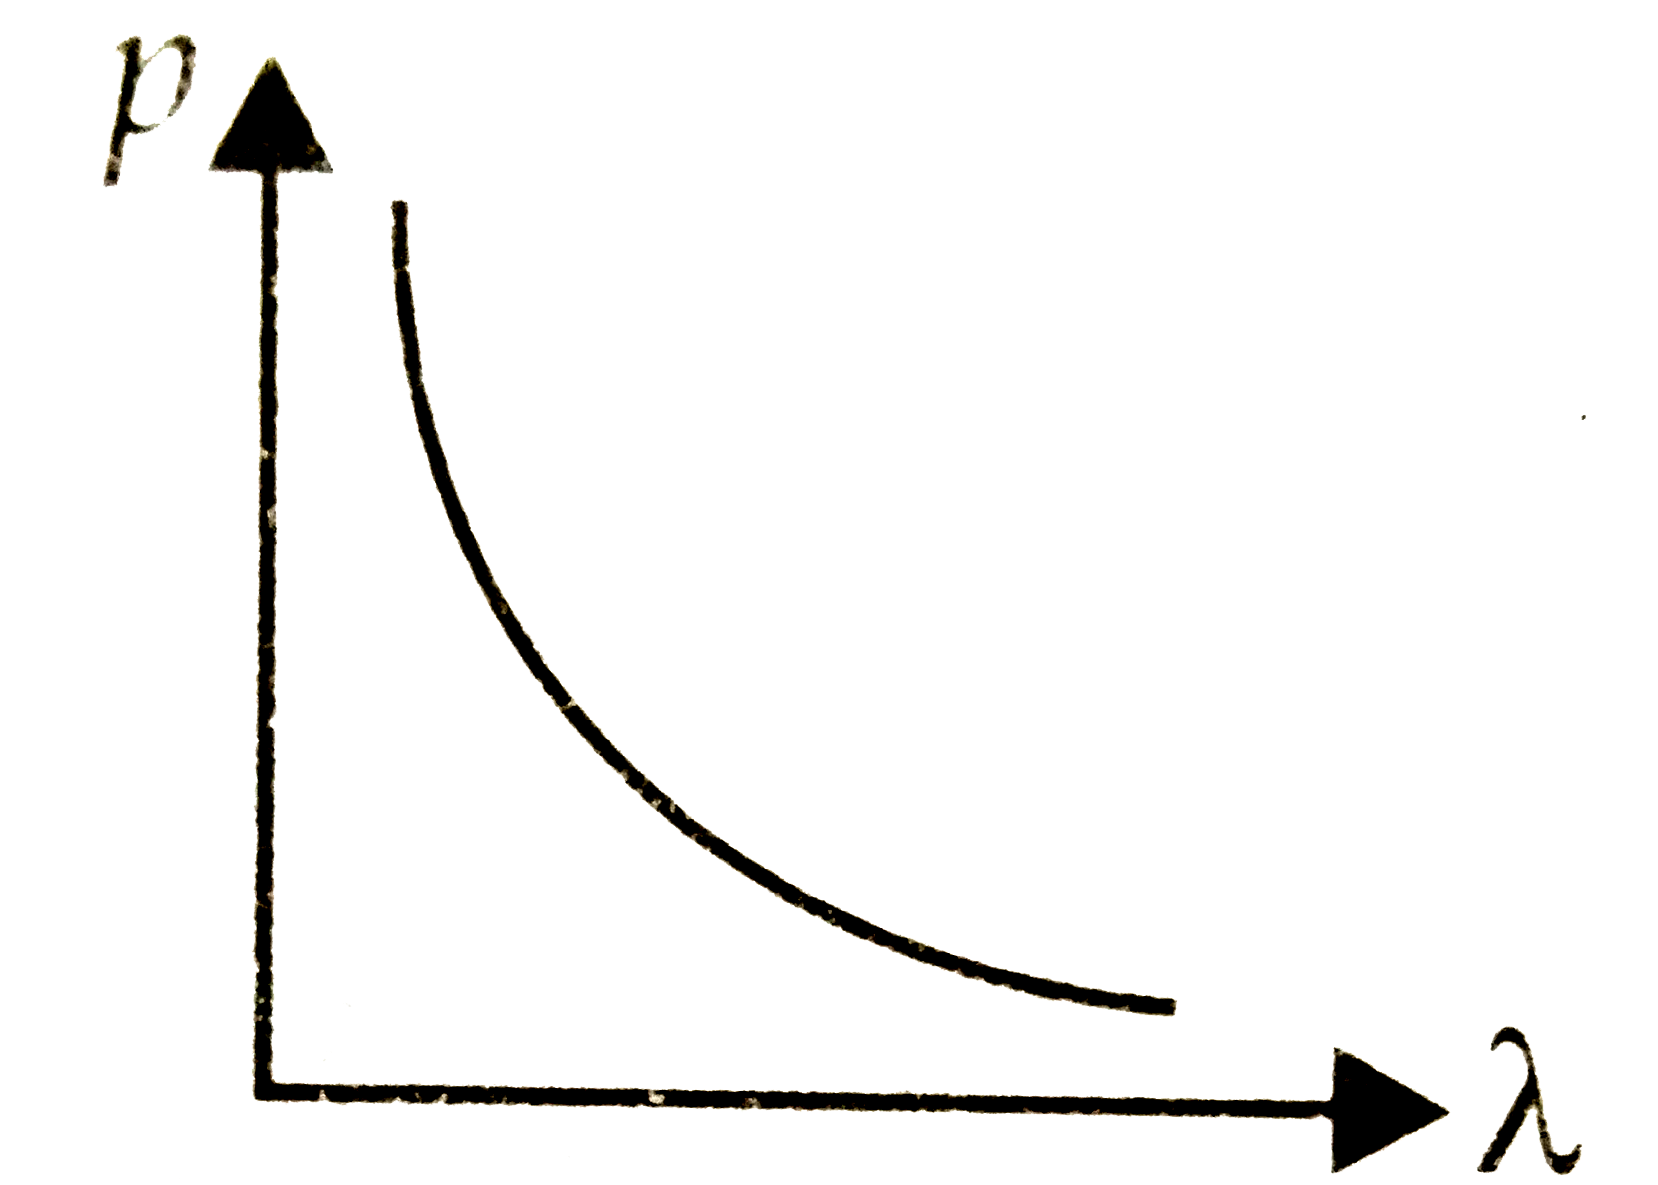
Which of the following figure represents the variation of particle momentum and the associated de - Broglie wavelength ?
A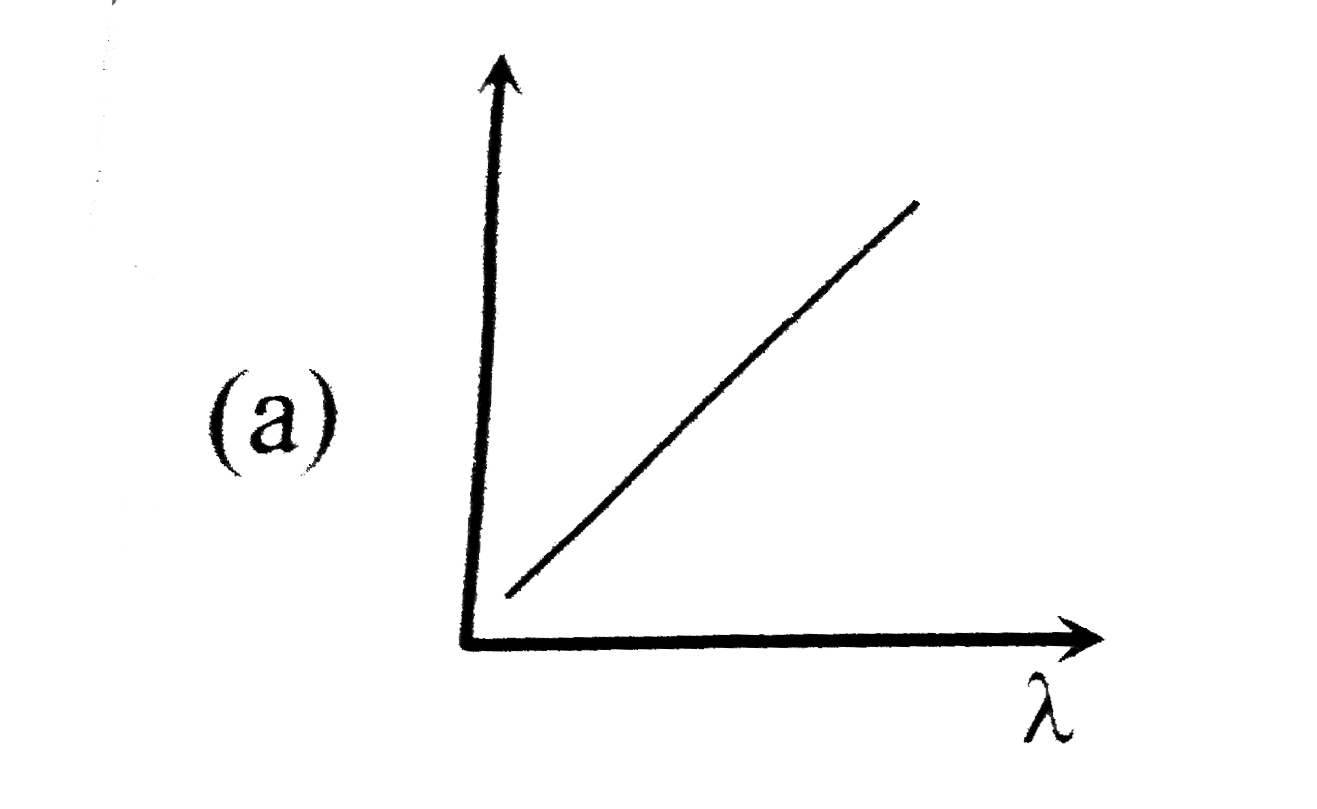 B
B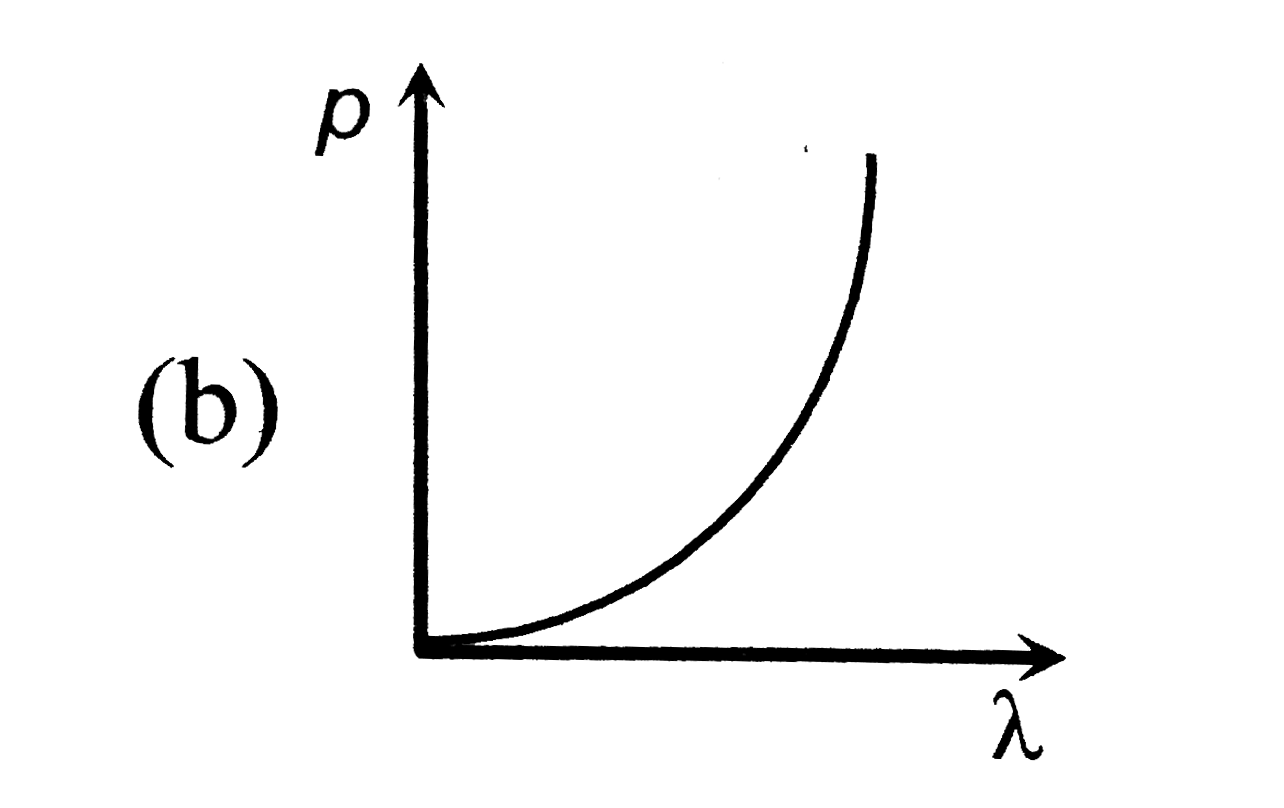 C
C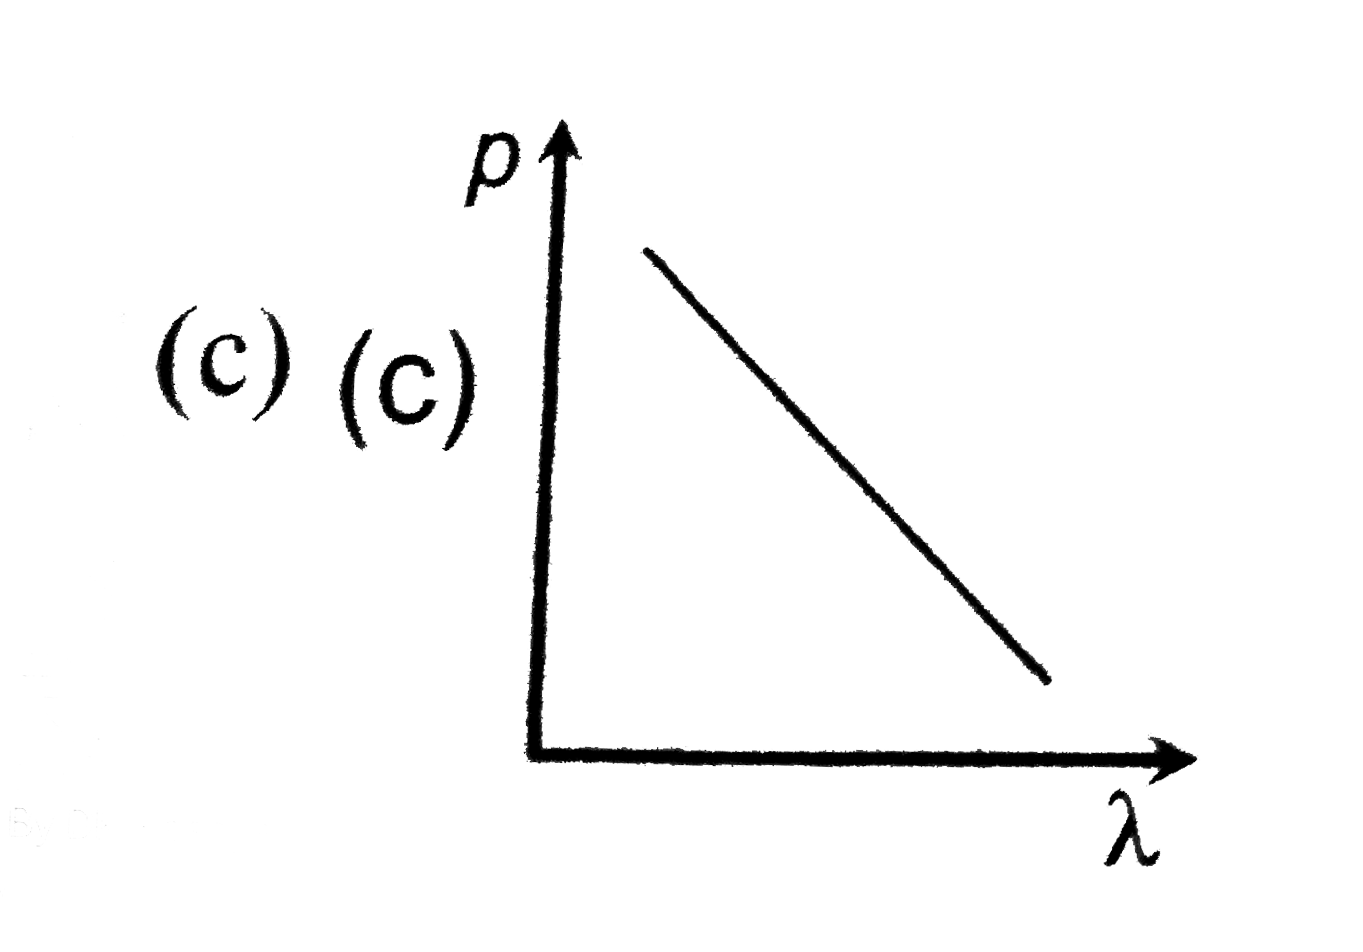 D
D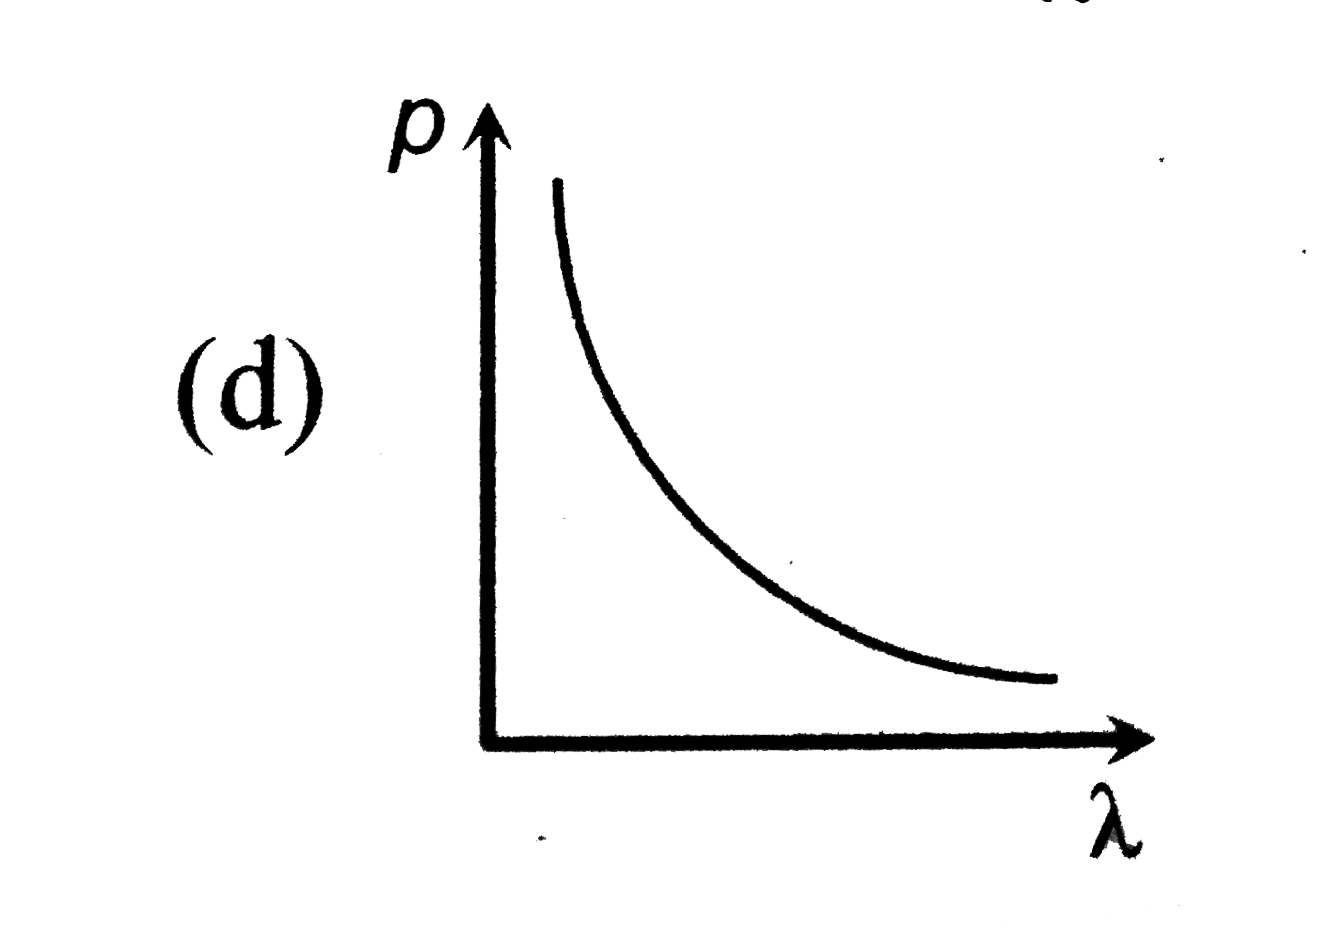
Which of the following figure represents the variation of particle momentum and the associated de - Broglie wavelength ?
A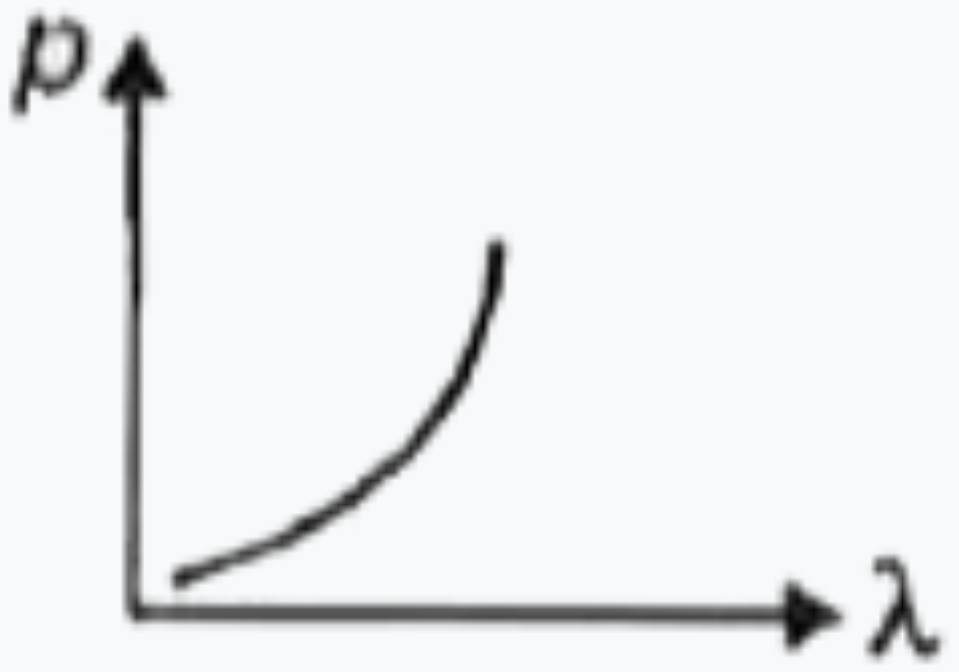 B
B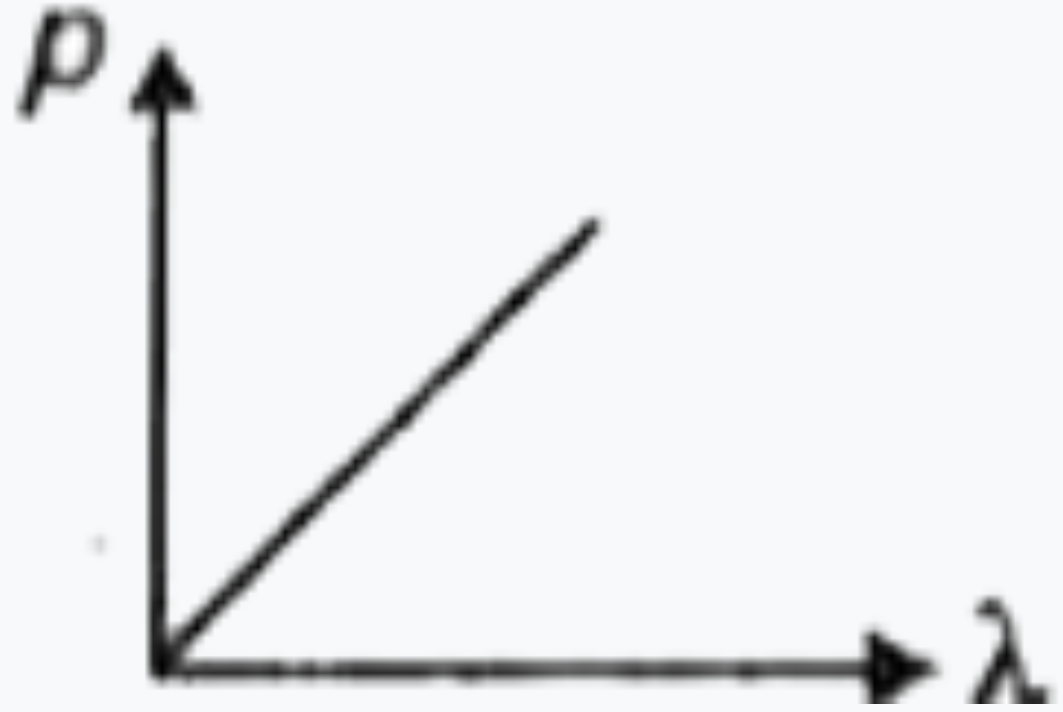 C
C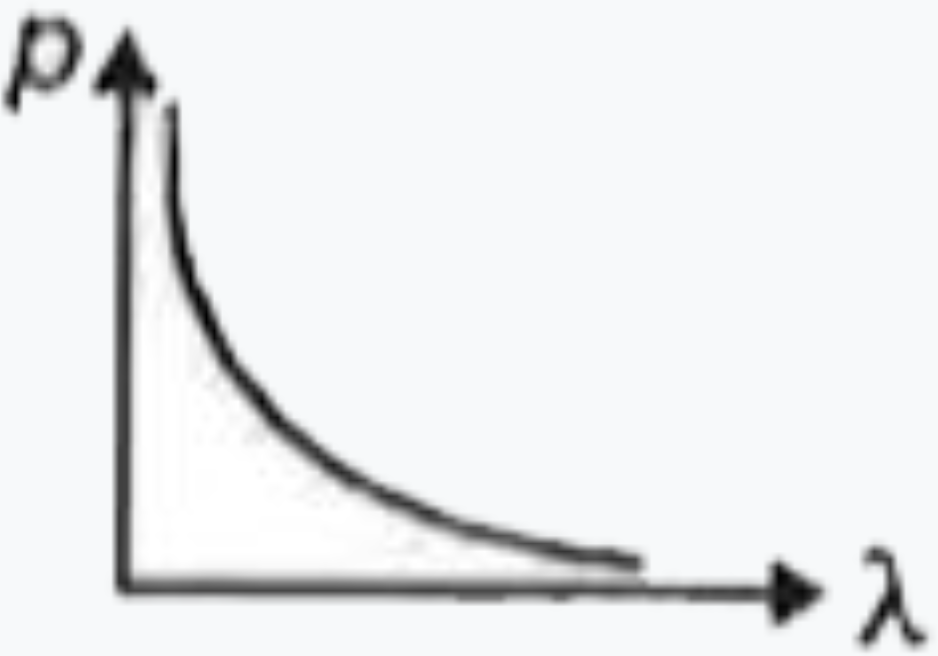 D
D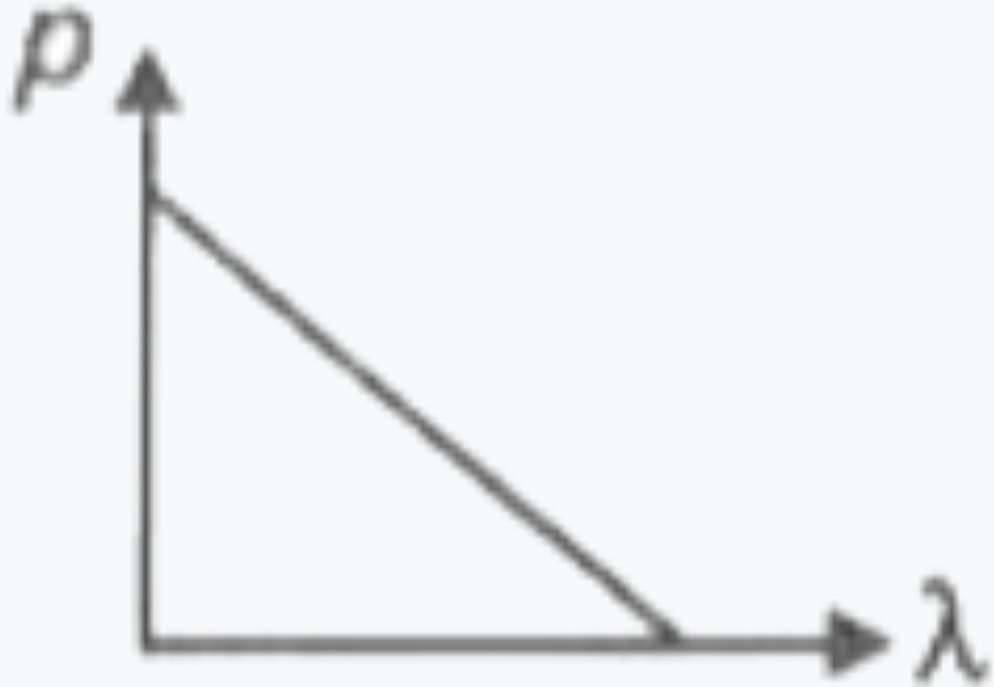
The momentum of a particle associated with de-Broglie's wavelength of 6Å is
View SolutionWhich of the following graphs correctly represents the variation of particle momentum with associated de Broglie wavelength?
View SolutionWhich of the following figure represents the variation of particle momentum and the associated de - Broglie wavelength ?
View SolutionWhich one of the following graphs in following figure represents variation of de Broglie wavelength (λ) of a particle having linear
View SolutionThe momentum of a particle associated with de-Broglie's wavelength of 6Å is
View Solution
