Which of the following figure represents the variation of particle momentum and the associated de - Broglie wavelength ?
A

B

C

D

Video Solution
Text Solution
The correct Answer is:D
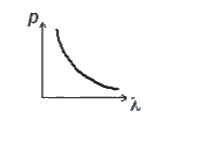
The de-Broglie wavelength of a particle is λ=hp, where h is the Planck.s constant and p is the momentum of the particle.
So the curve will be a rectangular hyperbola
|
Topper's Solved these Questions
- NTA TPC JEE MAIN TEST 104BOOK - NTA MOCK TESTSCHAPTER - NTA TPC JEE MAIN TEST 104EXERCISE - PHYSICS (SUBJECTIVE NUMERICAL)
10 Videos
- NTA TPC JEE MAIN TEST 103BOOK - NTA MOCK TESTSCHAPTER - NTA TPC JEE MAIN TEST 103EXERCISE - PHYSICS
30 Videos
- NTA TPC JEE MAIN TEST 105BOOK - NTA MOCK TESTSCHAPTER - NTA TPC JEE MAIN TEST 105EXERCISE - PHYSICS
30 Videos
Similar Questions
Knowledge Check
Which of the following figure represents the variation of particle momentum and the associated de - Broglie wavelength ?
A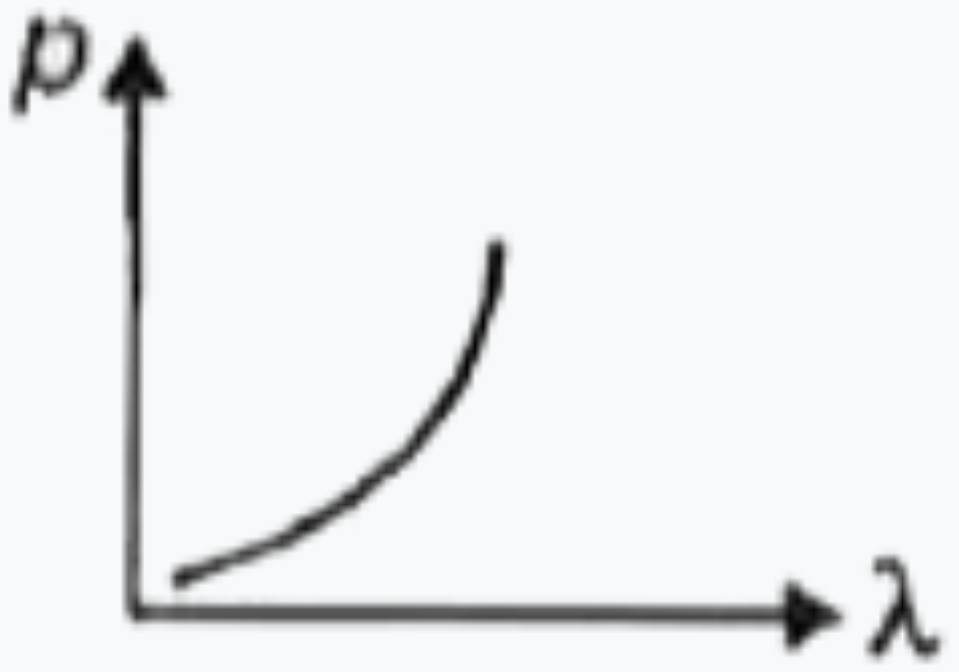 B
B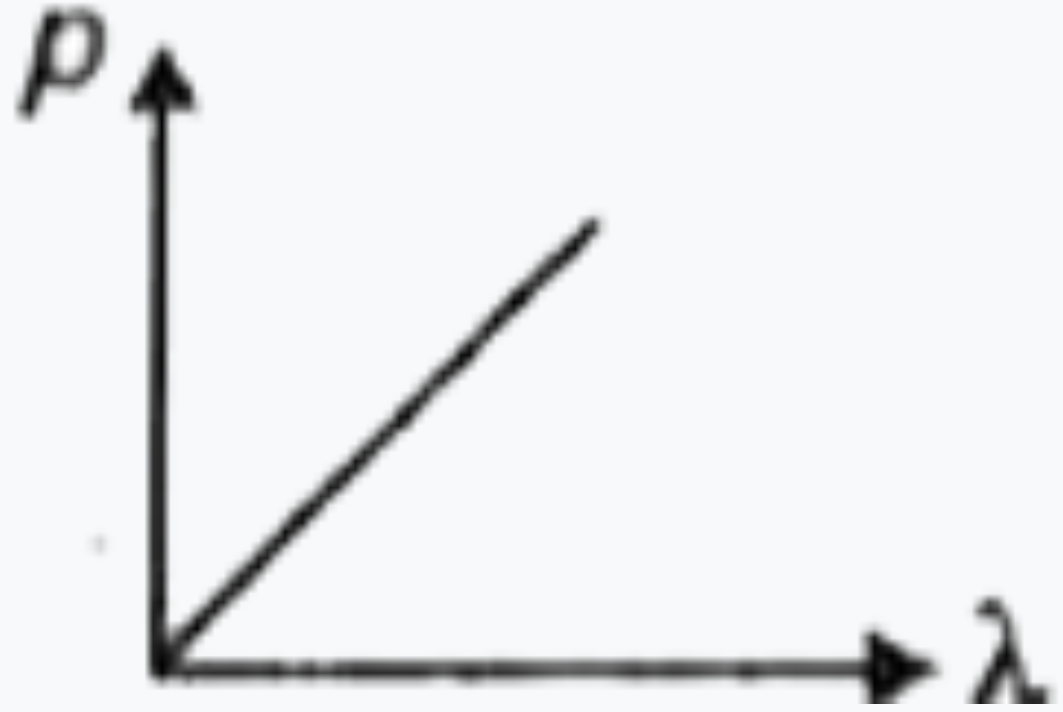 C
C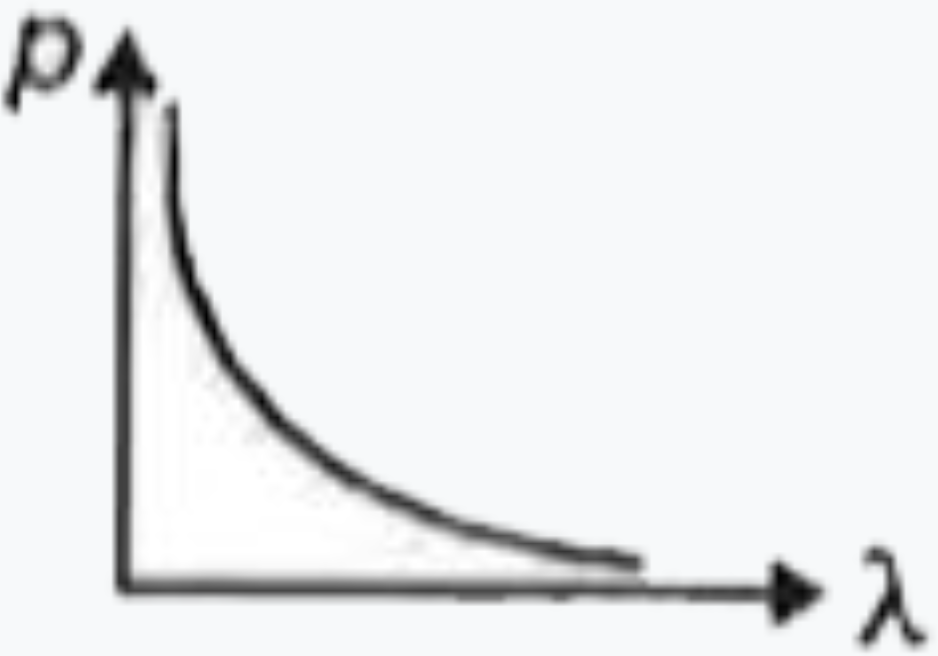 D
D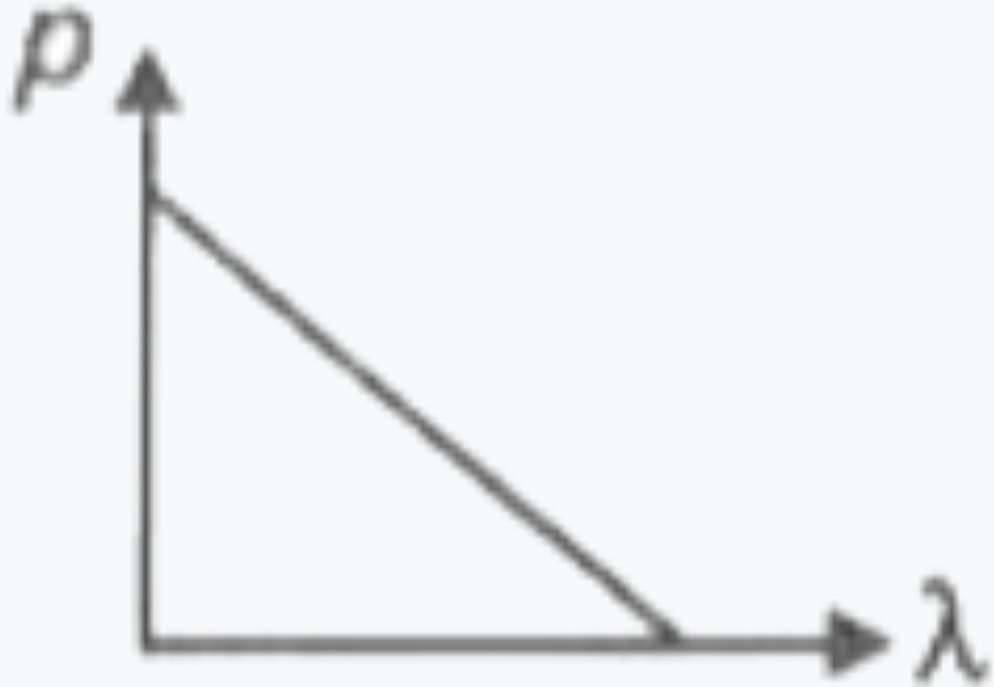
Which of the following graph represent the variation of particle momentum and associated de Broglie wavelength?
A B
B C
C D
D
Which of the following graphs correctly represents the variation of particle momentum with associated de Broglie wavelength?
A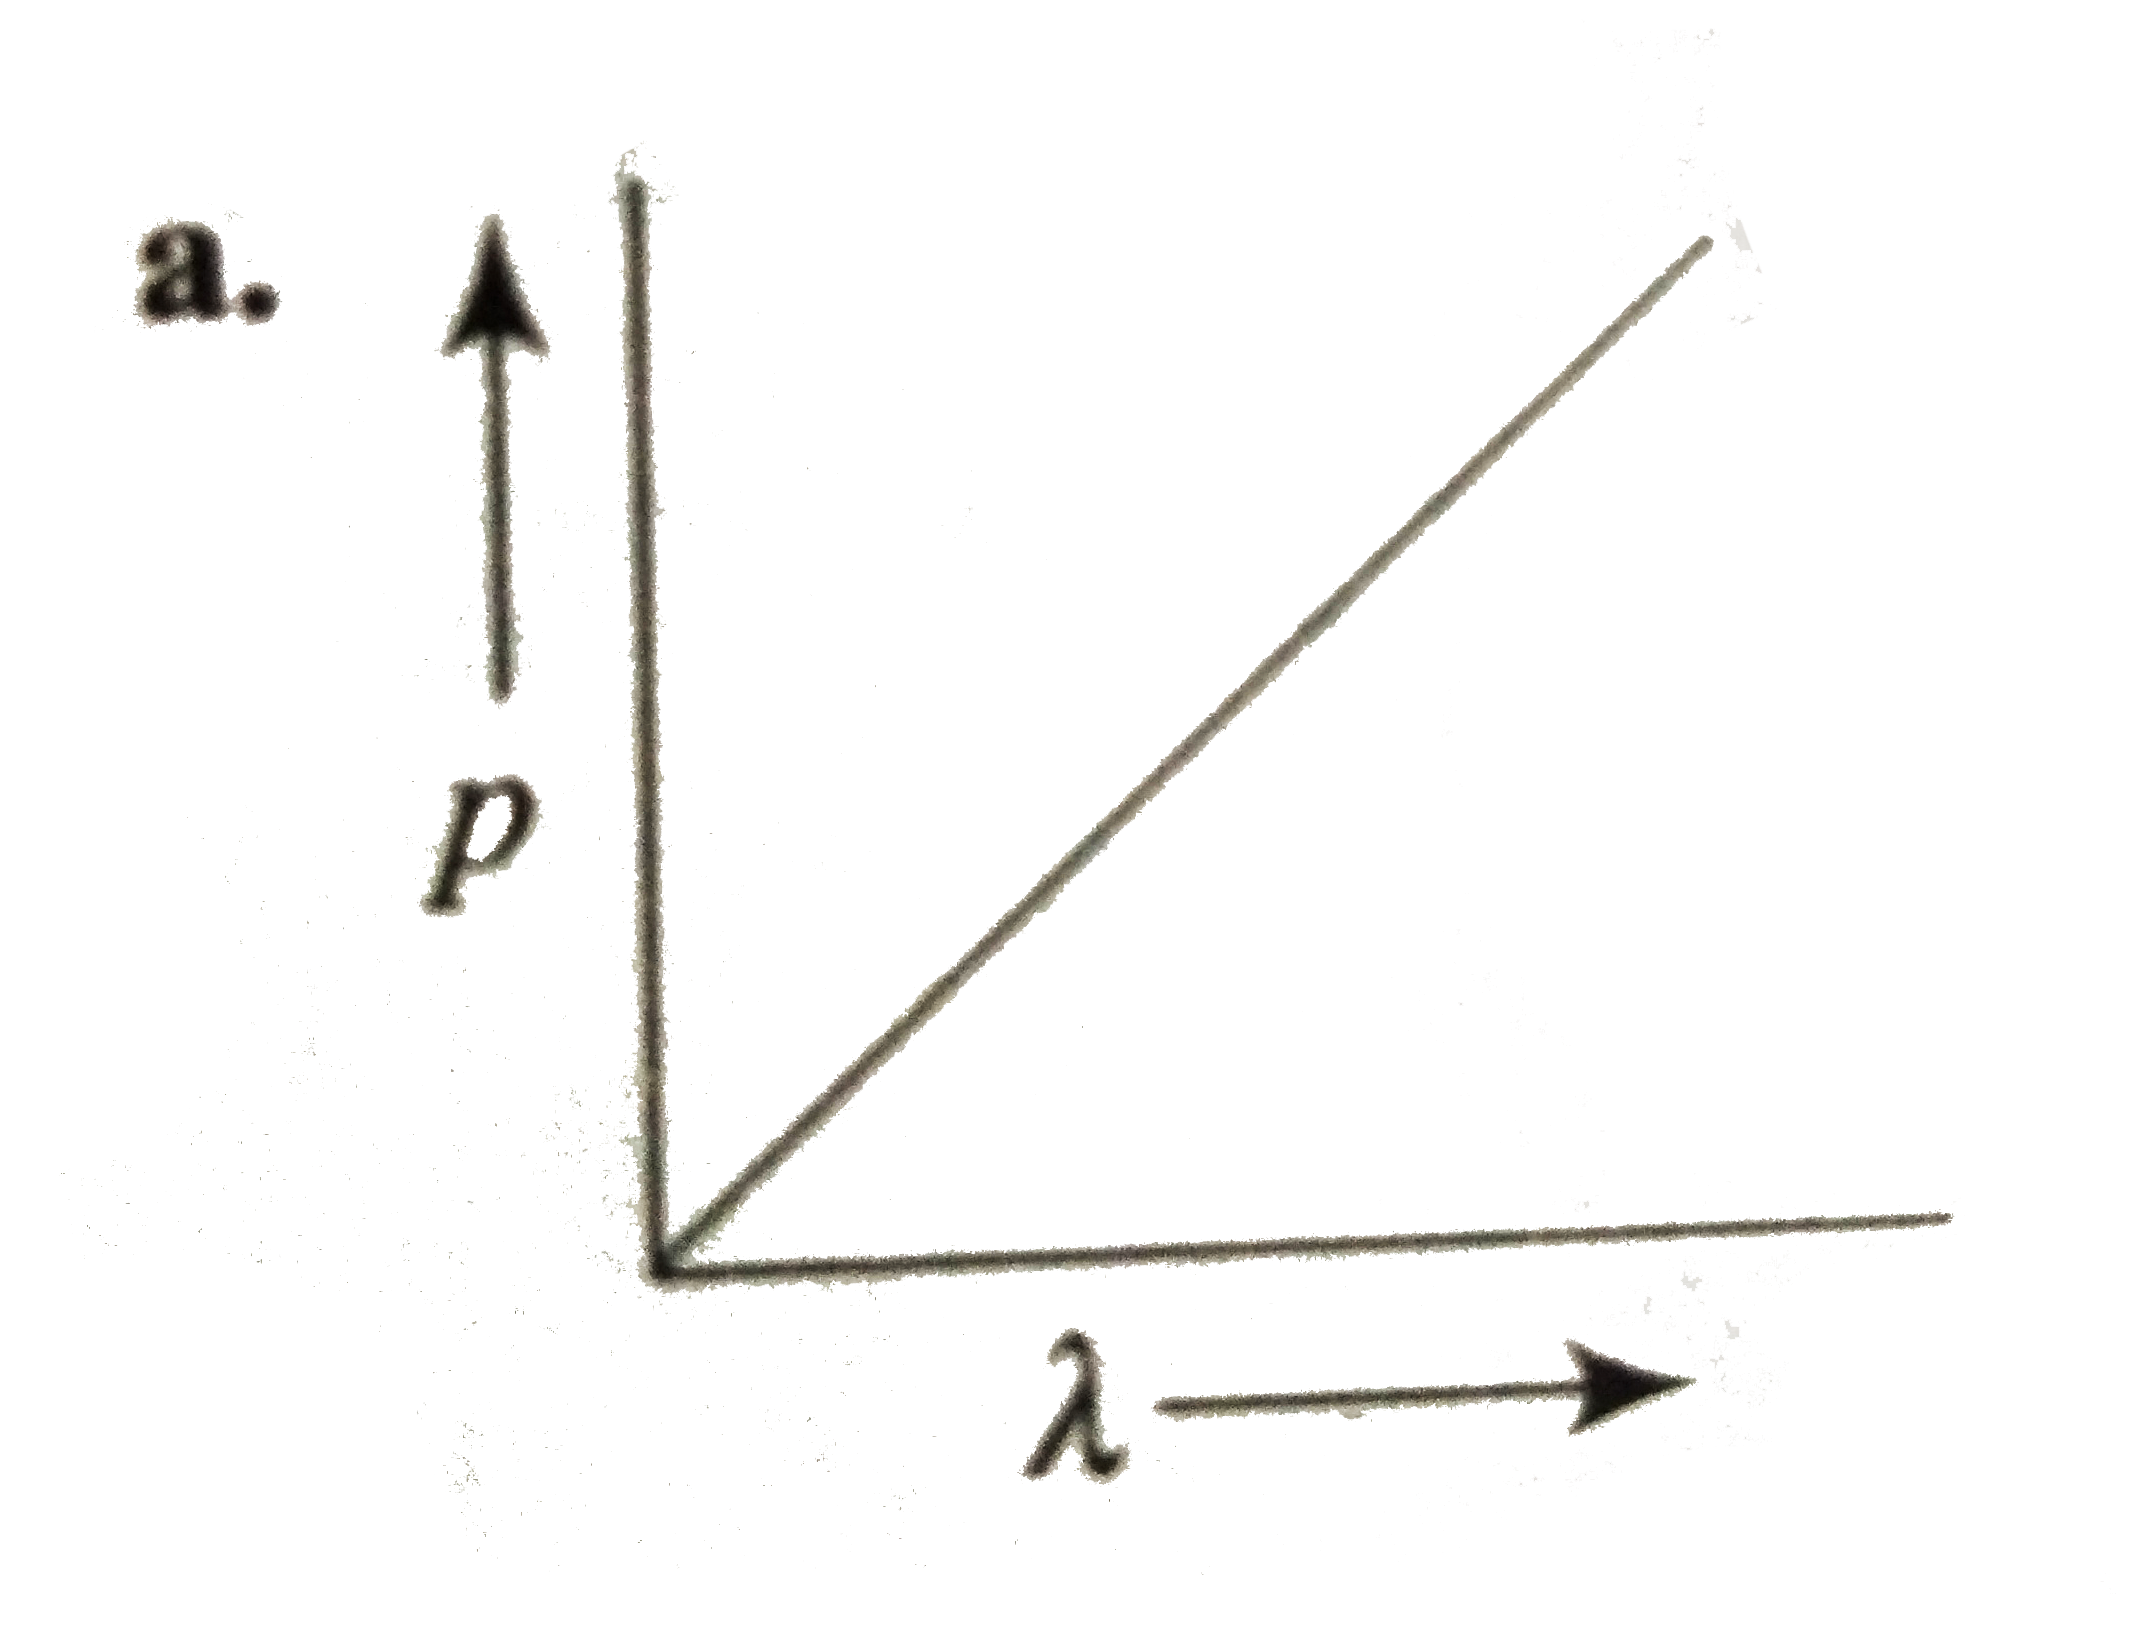 B
B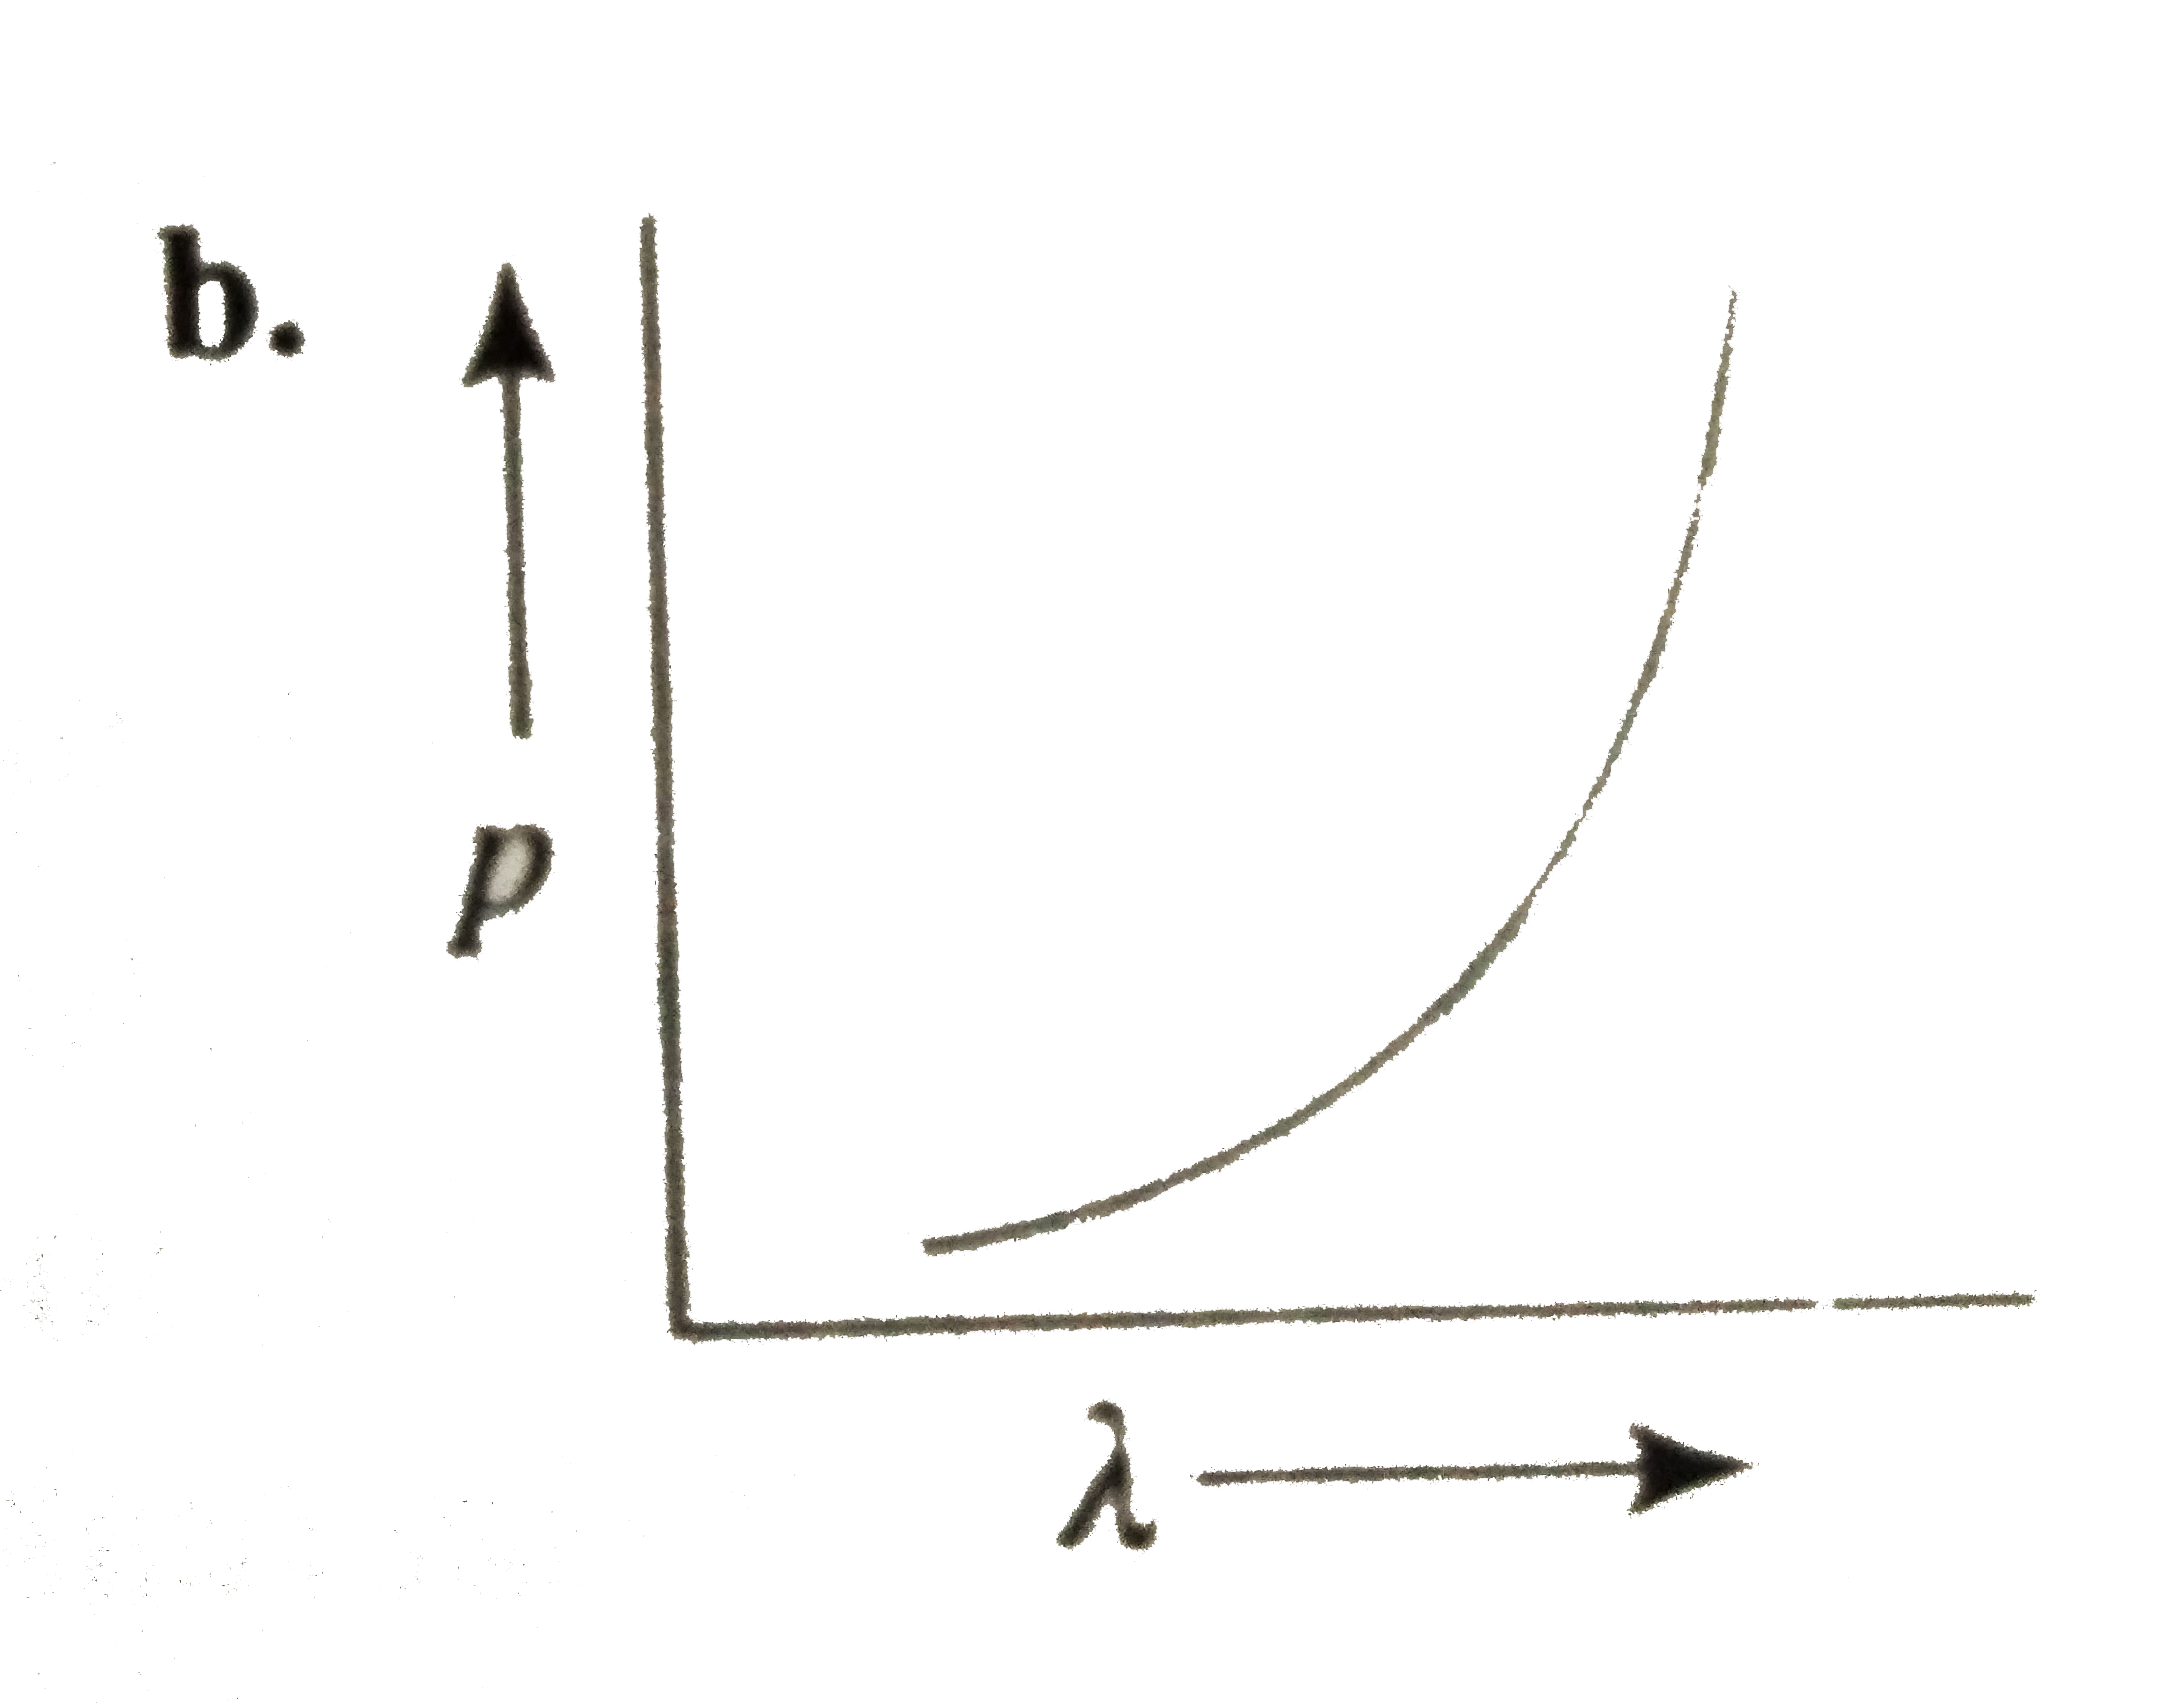 C
C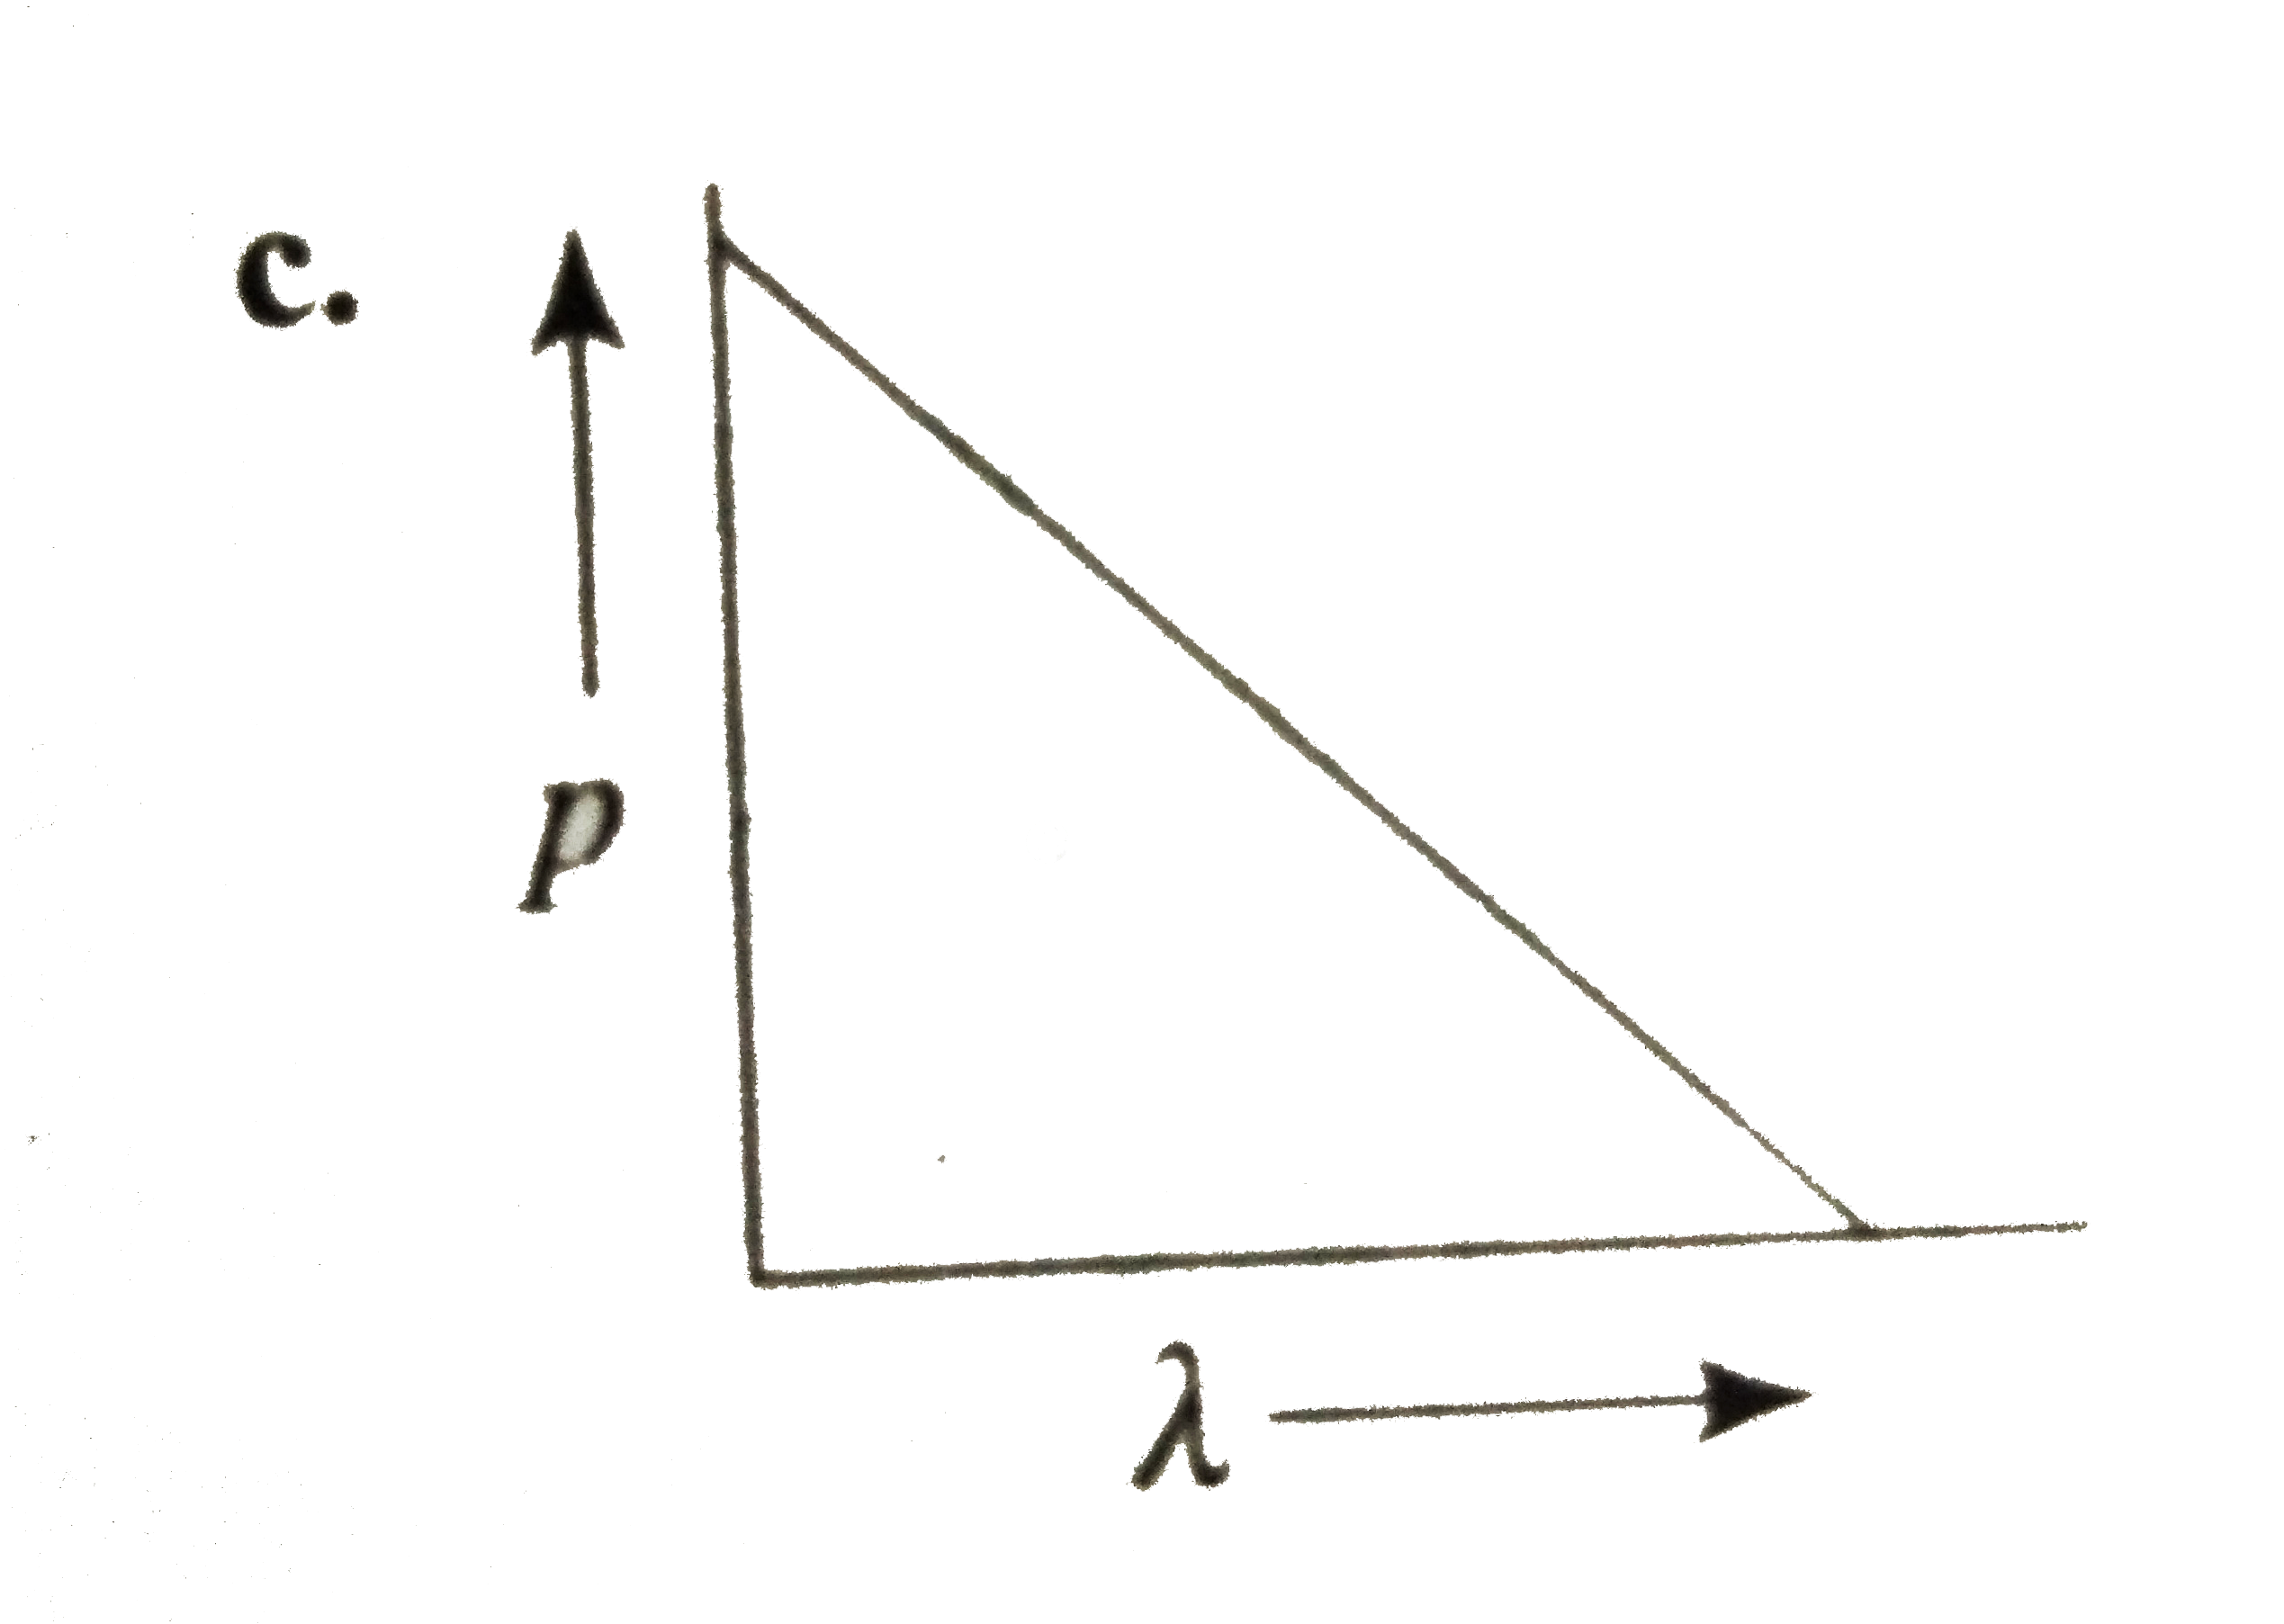 D
D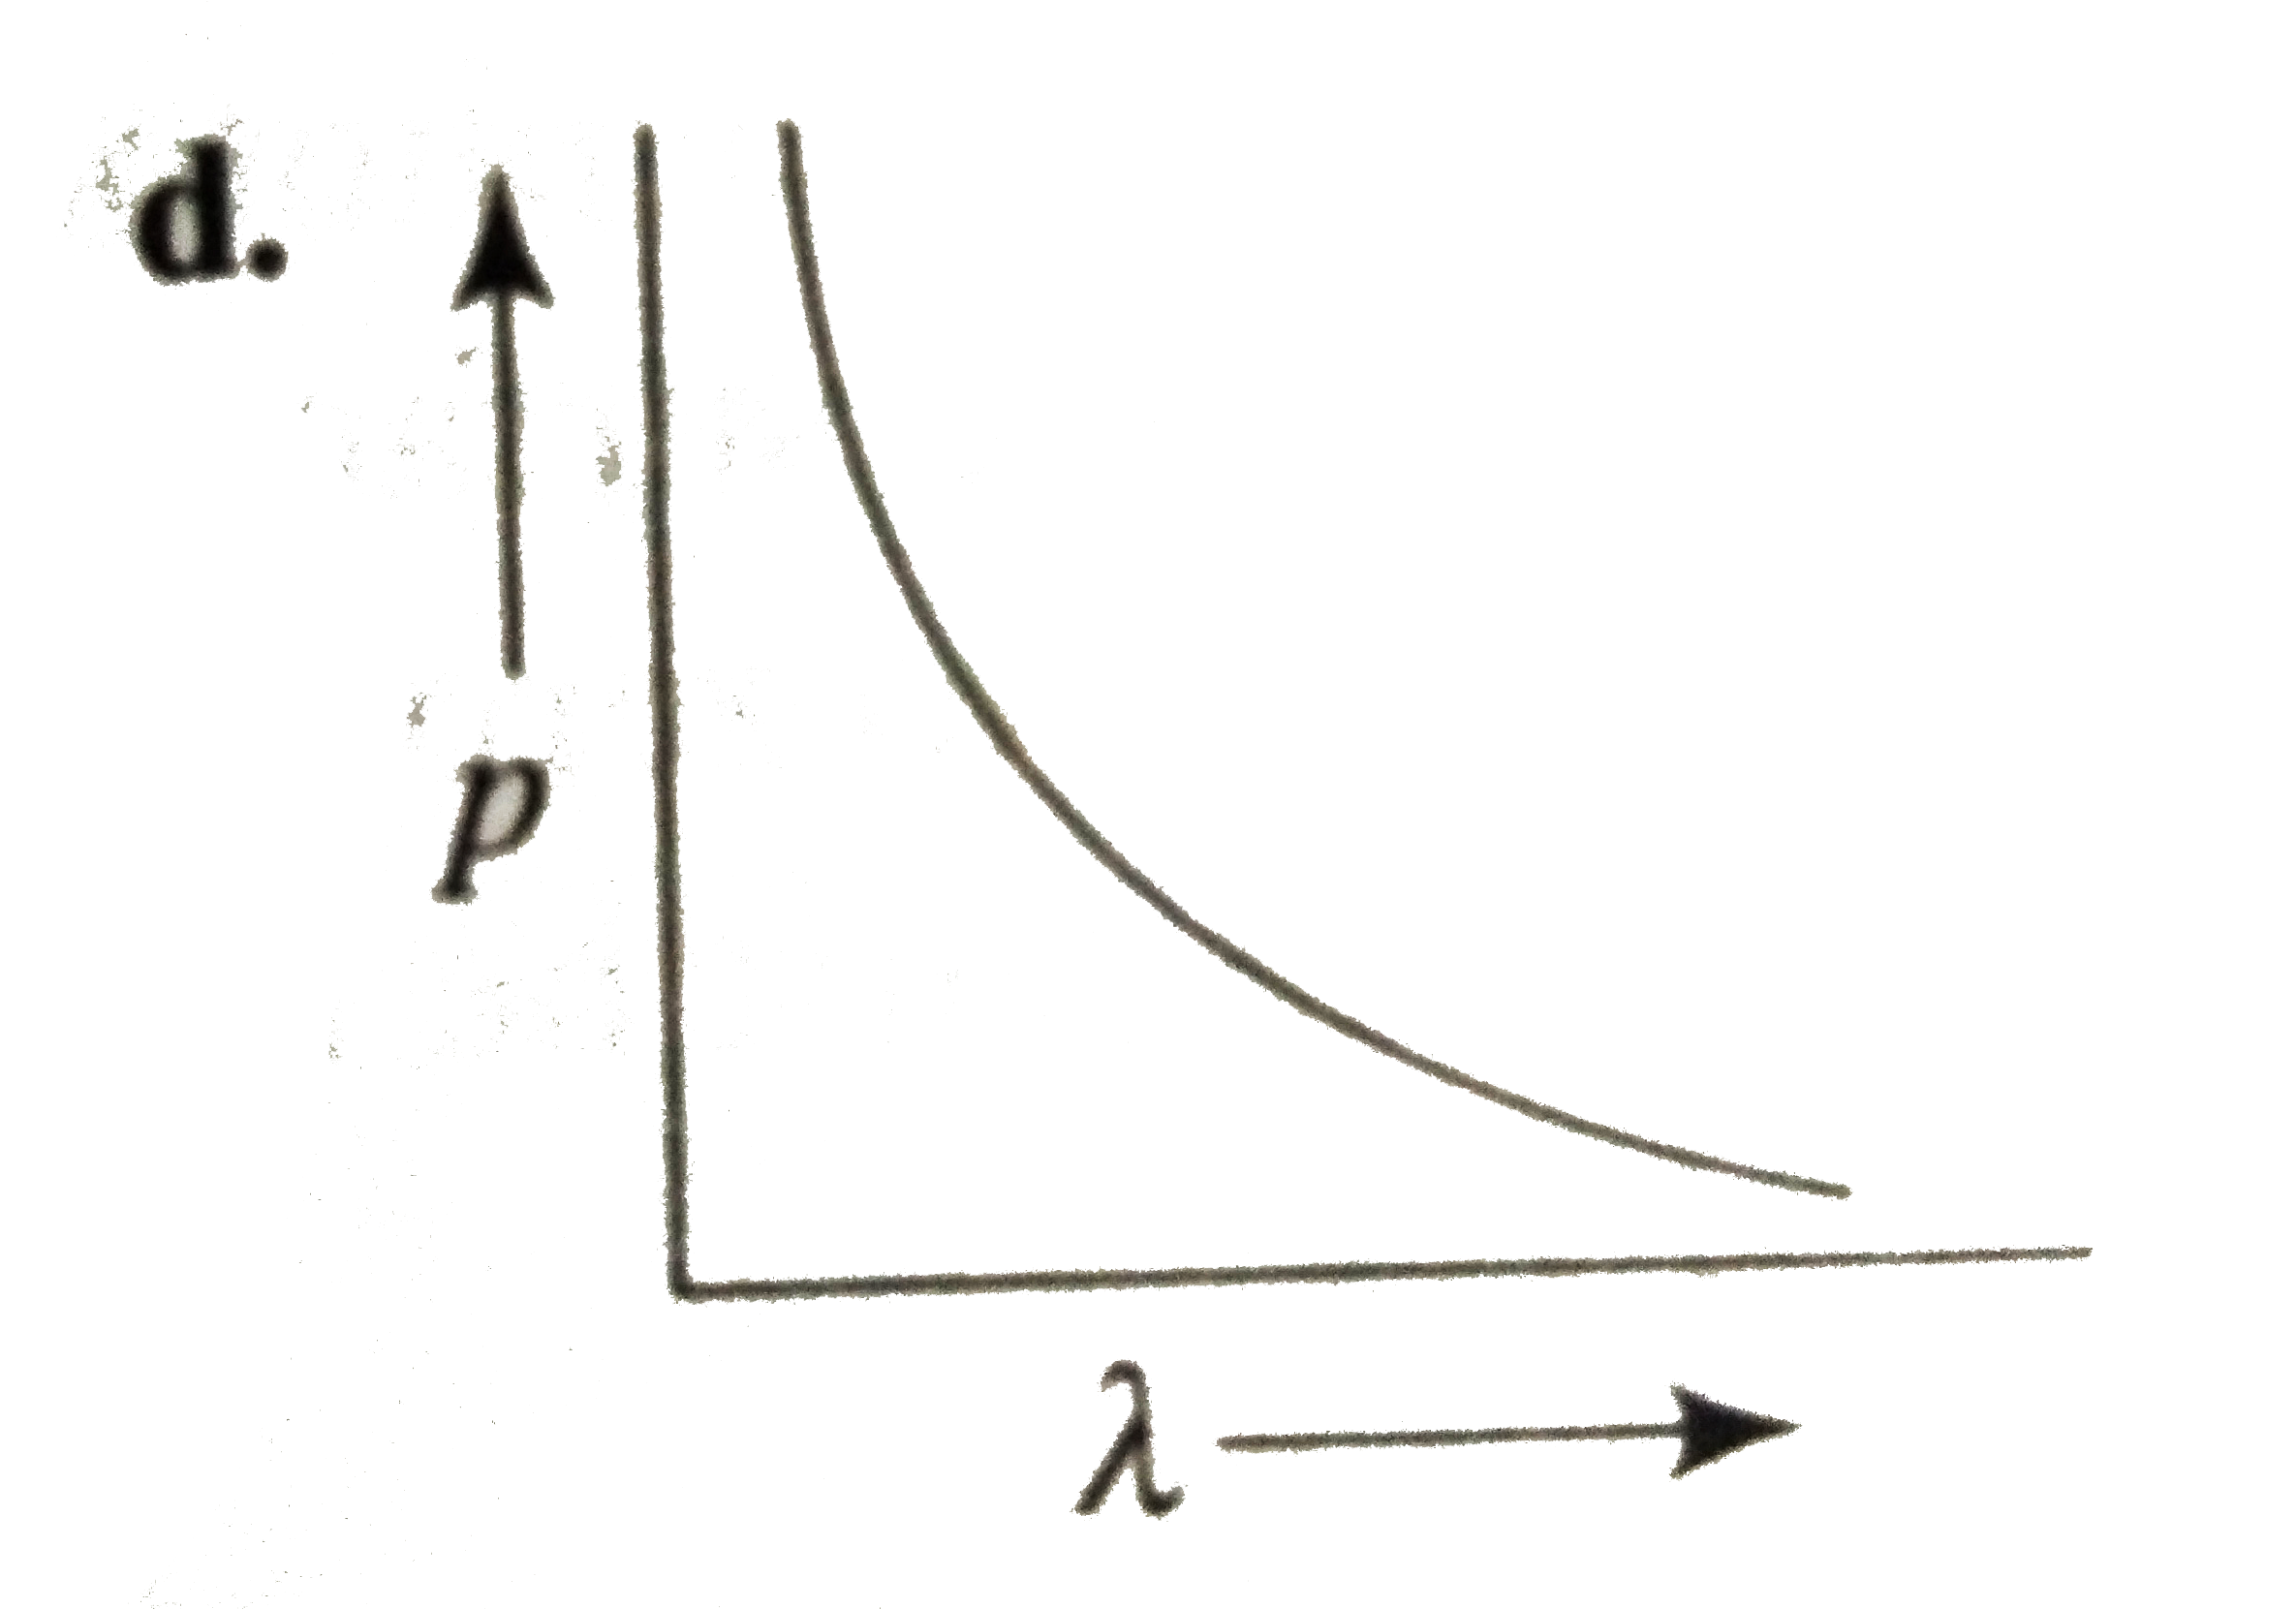
The momentum of a particle associated with de-Broglie's wavelength of 6Å is
View SolutionThe momentum of a particle having de-Broglie wavelength of 6Å
View SolutionWhich of the following particles moving with the same velocity would be associated with smallest de-Broglie wavelength?
View SolutionVeriation of momentum of perticle (p) with associated de-Broglie wavelength (λ) is shown correctly by
View SolutionIn which of the following cases the havier of the two particles has a smaller de-Broglie wavelength ? The two particles
View Solution
