Two hundred students of 6th and 7th class were asked to name their favourite colour so as to decide upon what should be the colour of their School Building. The results are shown in the following table. Represent the given data on a bar graph.
Step by step video & image solution for Two hundred students of 6th and 7th class were asked to name their favourite colour so as to decide upon what should be the colour of their School Building. The results are shown in the following table. Represent the given data on a bar graph. by Maths experts to help you in doubts & scoring excellent marks in Class 7 exams.
Updated on:21/07/2023Topper's Solved these Questions
Similar Questions
अपनी कक्षा के कम से कम 20 बच्चों (लड़के और लड़कियों ) को अलग -अलग तौलिए (कोलोग्राम में)। प्राप्त आँकड़ों को संगठित कीजिए तथा निम्नलिखित प्रश्नों के उत्तर देने का प्रयत्न कीजिएः
(i) सबसे अधिक भार किसका है? (ii) कौन-सा भार आधिकांश बच्चों का है?
(iii) आपके भार और आपके सबसे अच्छे मित्र के भार में क्या अंतर है?
View Solutionअपनी कक्षा के किन्ही दस, (10 ) विद्यार्थियों की ऊँचाइयाँ का परिसर ज्ञात कीजिए ।
View Solutionऐसे पांच और उदाहरण दीजिए, जहां एक संख्या को घातांकीय रूप में व्यक्त किया जाता है। प्रत्येक स्थिति में घातांक व आधार की पहचान भी कीजिए।
View SolutionTwo hundred students of 6th and 7th class were asked to name their favourite colour so as to decide upon what should be the colour of their School Building. The results are shown in the following table. Represent the given data on a bar graph.
View SolutionTwo hundred students of 6th and 7th class were asked to name their favourite colour so as to decide upon what should be the colour of their School Building. The results are shown in the following table. Represent the given data on a bar graph.
View SolutionTwo hundred students of class VI and VII were asked to name their favourite colours so as to decide upon what should be the colour of their school house. The results are shown in the following table. Colour:, Red, Green, Blue, Yellow, Orange Number of student, 43, 19, 55, 49, 34 Represent the given data on a bar graph. Which is the most preferred colour and which is the least? How many colours are there in all?
View SolutionA survey was taken at a high school, and the results were put in a circle graph. The students were asked to list their favourite colours. The measurement of each central angle is shown. If a person is chosen at random from the school, find the probability of each response.
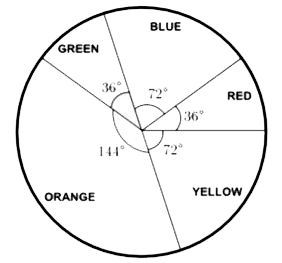
What is the probability of favourite colour being red ?
View SolutionA survey was taken at a high school, and the results were put in a circle graph. The students were asked to list their favourite colours. The measurement of each central angle is shown. If a person is chosen at random from the school, find the probability of each response.
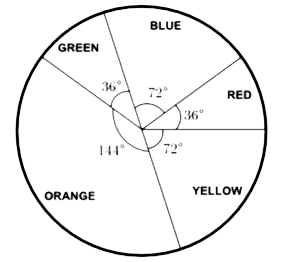
What is the probability of favourite colour being blue or green ?
View SolutionA survey was taken at a high school, and the results were put in a circle graph. The students were asked to list their favourite colours. The measurement of each central angle is shown. If a person is chosen at random from the school, find the probability of each response.
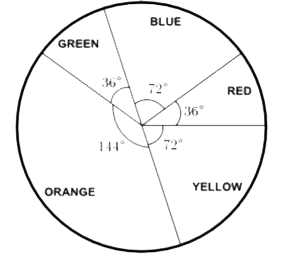
What is the probability of favourite colour not being red or blue?
View SolutionA survey was taken at a high school, and the results were put in a circle graph. The students were asked to list their favourite colours. The measurement of each central angle is shown. If a person is chosen at random from the school, find the probability of each response.
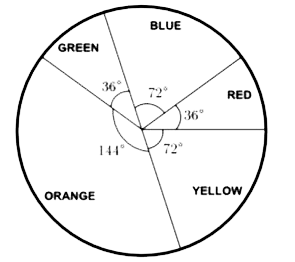
What is the probability of favourite colour not being orange or green ?
View SolutionA survey was taken at a high school, and the results were put in a circle graph. The students were asked to list their favourite colours. The measurement of each central angle is shown. If a person is chosen at random from the school, find the probability of each response.
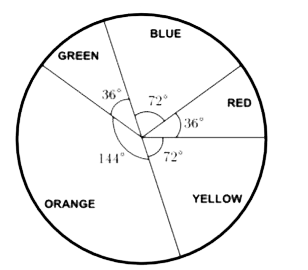
What is the probability of favourite colour being red or blue?
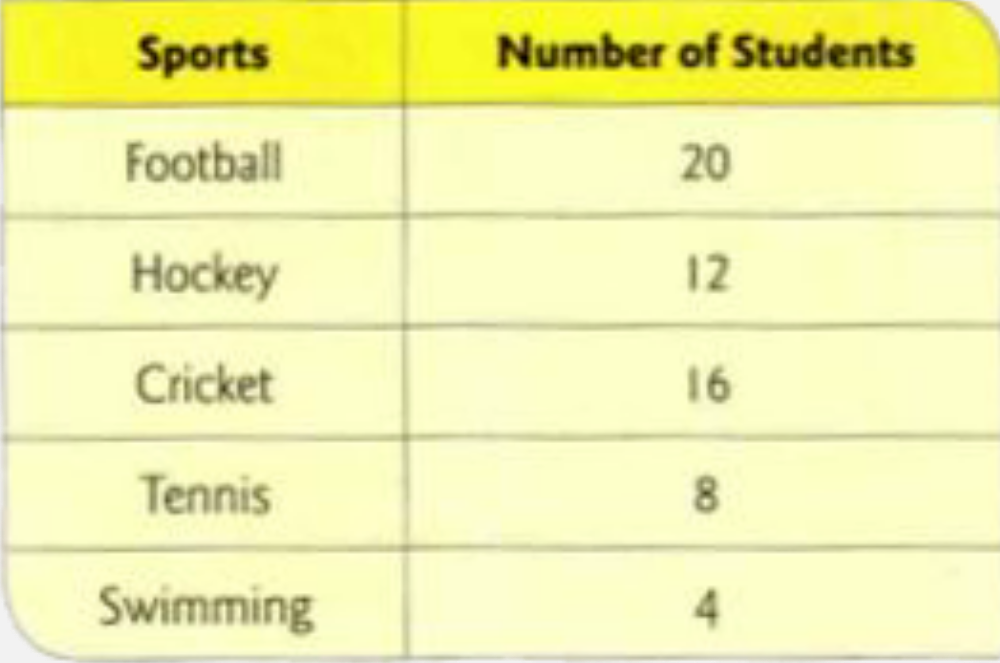
View SolutionThe following table shows the favourite sports of 250 students of a school. Represent the data by a bar graph.
View SolutionFollowing table represents the data collected from a group of children who were asked about their favourite sports. Represent the data as a bar graph.
View Solutionछटी और सातवीं कक्षाओं के 200 विद्यार्थियों से उनके मनपसंद रंग के नाम बताने के लिए कहा गया , ताकि यह निर्णंय लिया जा सके कि उनके स्कूल के भवन के क्या रंग रखा जाये। इसके परिणाम निम्नलिखित सारणी में दर्शाये गए हैं। इन आँकड़ो को एक दंड आलेख द्वारा निरूपित कीजिये।
View SolutionTwo hundred students of 6th and 7th classes were asked to name their favourite colour so as to decide upon what should be the colour of their school building. The results are shown in the following table. Represent the given data on a bar graph.

Answer the following questions with the help of the bar graph:
Which is the most preferred colour and which is the least preferred?
View Solution
