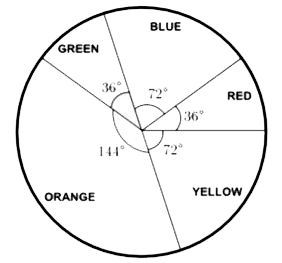
A survey was taken at a high school, and the results were put in a circle graph. The students were asked to list their favourite colours. The measurement of each central angle is shown. If a person is chosen at random from the school, find the probability of each response.
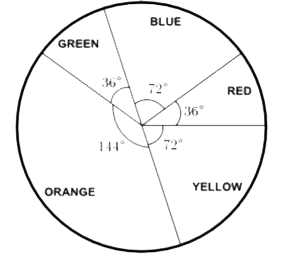
What is the probability of favourite colour not being red or blue?
0.35
0.7
0.15
0.50
The correct Answer is:B
P(not red or blue) =1−36∘+72∘360∘=1−108∘360∘
=1−310=1−0.3=0.7
Thus (b) is correct option.
Topper's Solved these Questions
Similar Questions

Girish wants to participate in the 200m Sprint. He can currently run that distance in 45 sec. But he wants to do that in under 30sec. With each day of practice, it takes him 2 sec less. Respond to the above situation by answering the questions given below
Which of the following forms an A.P for the above given situation
View SolutionSome reactions require conditions like specific temperature, pressure, etc. While writing chemical equations for such reactions, where are these conditions usually mentioned?
View SolutionTwo hundred students of 6th and 7th class were asked to name their favourite colour so as to decide upon what should be the colour of their School Building. The results are shown in the following table. Represent the given data on a bar graph.
View SolutionIn City X, there were 900 residents. A survey was conducted in it reagrding the favourite beverages of the residents. The results of the survey are partially conveyed in the table below.
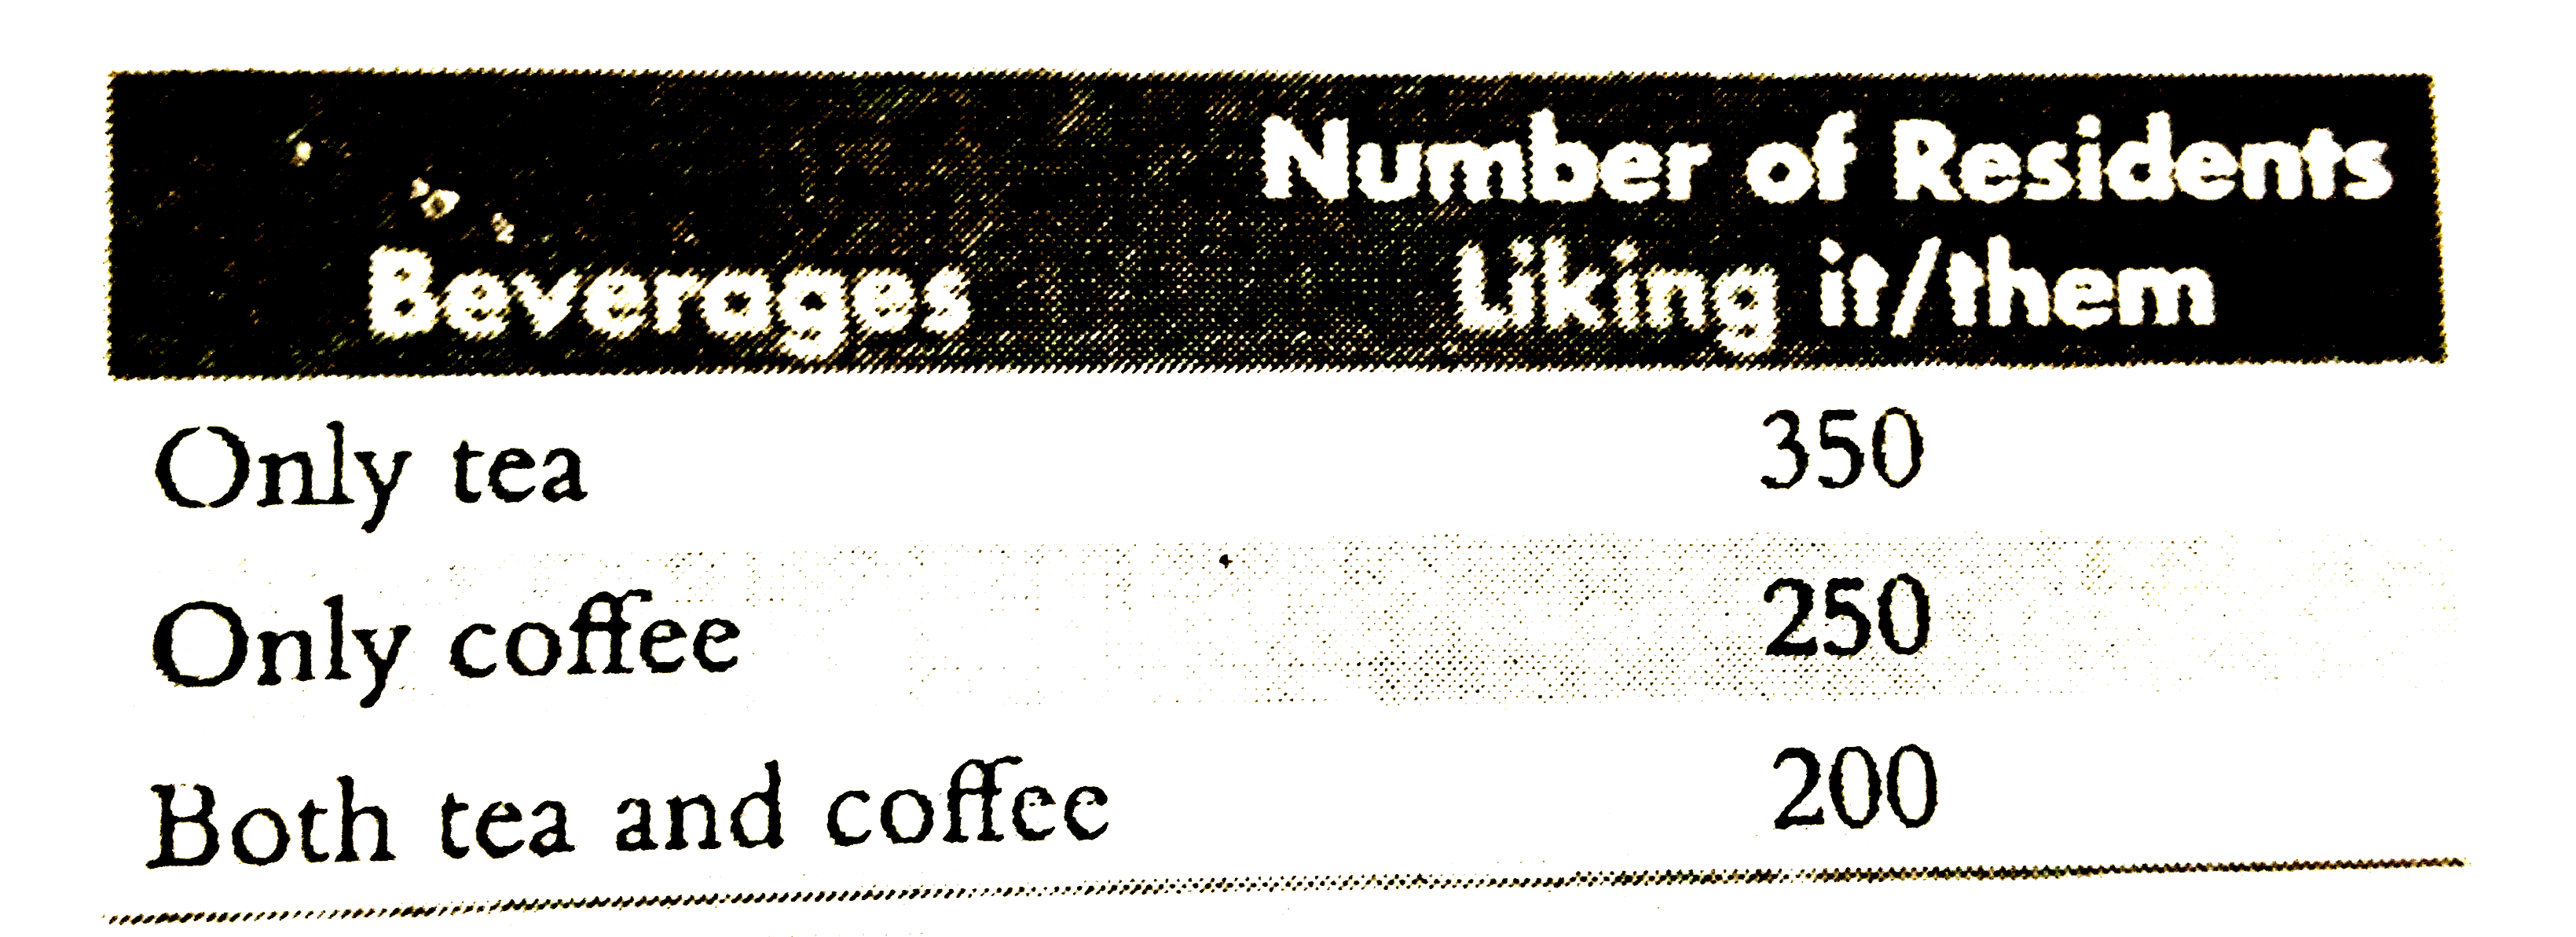
Find the probability that a resident chosen at random likes only tea or only coffee.
View SolutionTwo hundred students of 6th and 7th class were asked to name their favourite colour so as to decide upon what should be the colour of their School Building. The results are shown in the following table. Represent the given data on a bar graph.
View SolutionTwo hundred students of 6th and 7th class were asked to name their favourite colour so as to decide upon what should be the colour of their School Building. The results are shown in the following table. Represent the given data on a bar graph.
View SolutionA recent survey reported that 60 percent of the students at a high school are girls and 65 percent of girls at this school play a sport. If a student at this high school were selected at random, what is the probability that the student is a girl who plays a sport?
View Solution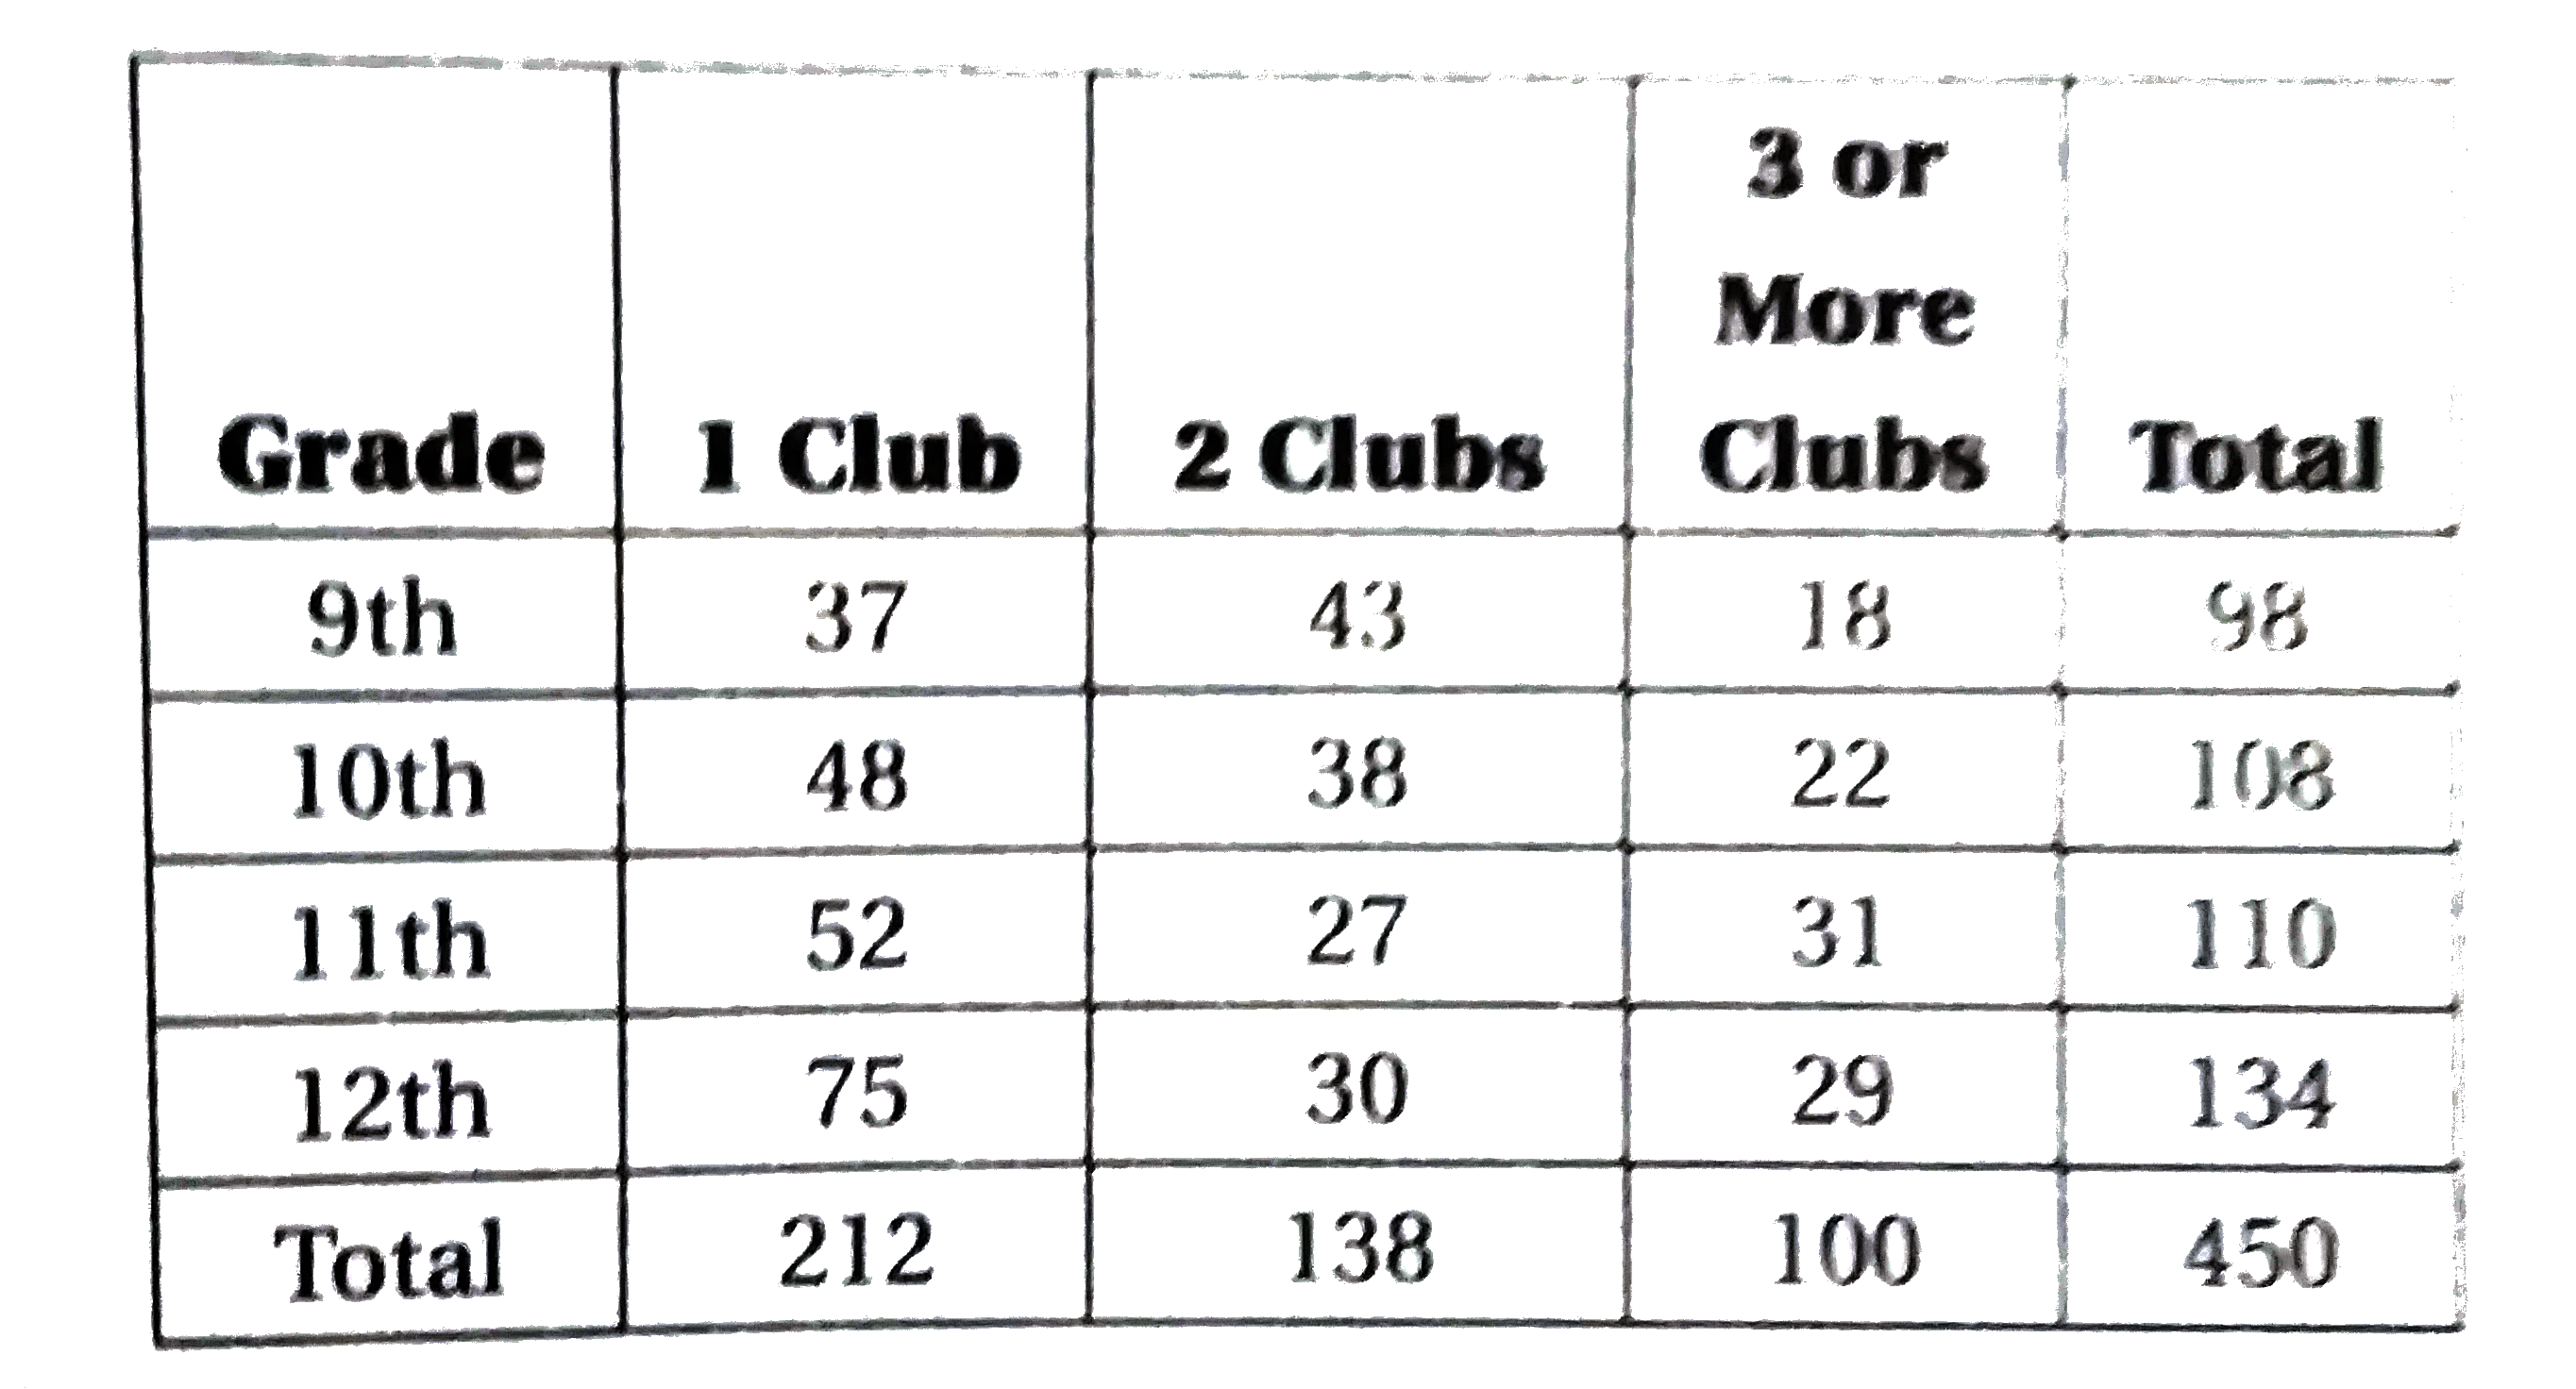
Question 4-6 refer to the above table, which summarizes the result of a survey of the student body of a high school about club membership in which each student enrolled in the high school enumerated the clubs in which they were members.
Q. If a students is selected at random, what is the probability that the student does not belong to 3 or more clubs?
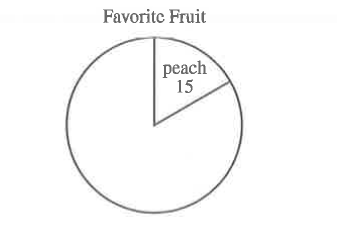
View SolutionJie asked 90 students to choose 1 favourite fruit from 4 options. Jie has begun to represent the results in the circle graph below. Peaches were chosen as the favourite of 15 students. Apples, bananas, and strawberries were each chosen as favourite by an equal number of the remaining students. What must be the measure of the central angle in the circle graph for banana?
View SolutionTwo hundred students of class VI and VII were asked to name their favourite colours so as to decide upon what should be the colour of their school house. The results are shown in the following table. Colour:, Red, Green, Blue, Yellow, Orange Number of student, 43, 19, 55, 49, 34 Represent the given data on a bar graph. Which is the most preferred colour and which is the least? How many colours are there in all?
View SolutionA survey was taken at a high school, and the results were put in a circle graph. The students were asked to list their favourite colours. The measurement of each central angle is shown. If a person is chosen at random from the school, find the probability of each response.
What is the probability of favourite colour being red ?
View SolutionA survey was taken at a high school, and the results were put in a circle graph. The students were asked to list their favourite colours. The measurement of each central angle is shown. If a person is chosen at random from the school, find the probability of each response.
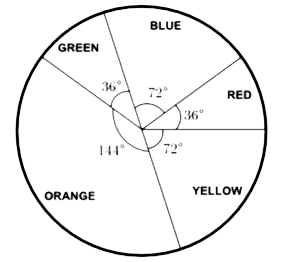
What is the probability of favourite colour being blue or green ?
View SolutionA survey was taken at a high school, and the results were put in a circle graph. The students were asked to list their favourite colours. The measurement of each central angle is shown. If a person is chosen at random from the school, find the probability of each response.
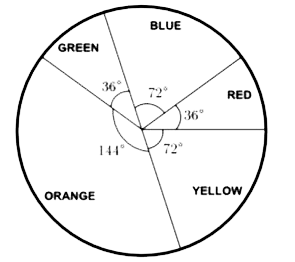
What is the probability of favourite colour not being orange or green ?
View SolutionA survey was taken at a high school, and the results were put in a circle graph. The students were asked to list their favourite colours. The measurement of each central angle is shown. If a person is chosen at random from the school, find the probability of each response.
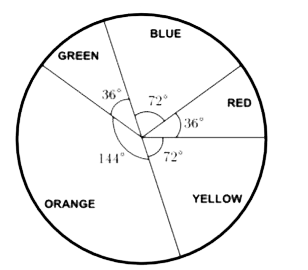
What is the probability of favourite colour being red or blue?
View SolutionTwo hundred students of 6th and 7th classes were asked to name their favourite colour so as to decide upon what should be the colour of their school building. The results are shown in the following table. Represent the given data on a bar graph.

Answer the following questions with the help of the bar graph:
How many colours are there in all? What are they?
View Solution
