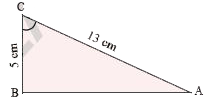
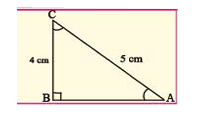
Find (i) sinC(ii)cosCand(iii)tanC in the adjacent triangle.
 Solution in Gujrati
Step by step video & image solution for Find (i) sin C (ii) cos C and (iii) tan C in the adjacent triangle. by Maths experts to help you in doubts & scoring excellent marks in Class 10 exams.
Topper's Solved these Questions
- BOOK - NCERT GUJARATICHAPTER - TRIGONOMETRY EXERCISE - TRY THIS8videos
TRIGONOMETRY
- BOOK - NCERT GUJARATICHAPTER - TRIGONOMETRY EXERCISE - THINK AND DISCUSS12videos
TRIGONOMETRY
- BOOK - NCERT GUJARATICHAPTER - TRIGONOMETRY EXERCISE - OPTIONAL EXERCISE6videos
TRIGONOMETRY
- BOOK - NCERT GUJARATICHAPTER - TANGENTS AND SECANTS TO A CIRCLEEXERCISE - Try this2videos
TANGENTS AND SECANTS TO A CIRCLE
Similar Questions
Write length of "Hypotenuse ","Opposite side "and "Adjacent side "for the given angles in the given triangles.
1. Foa angle C
. For angle A
 06:07View Solution
Discuss among your friends
Does sinx=43 exists for some value of angle?02:11View SolutionProve that cotθ−cosθcotθ+cosθ=cosecθ−1cosecθ+1
02:45View SolutionDraw a pair of radii OA and OB in a circle such that ∠BOA=120∘. Draw the bisector of ∠BOA and draw lines perpendiculars to OA and OB at A and B. These lines meet on the bisector of ∠BOA at a point which is the external point and the perpendicular lines are the required tangents. Construct and Justify.
02:17View SolutionWhich of the following are correct chain isomers of butane ? (i)
05:41View SolutionDetermine the point of symmetry of a regular hexagon.
03:28View SolutionMatch the following Column A to Column B
 02:31View Solution
Match the following Column A to Column B
 02:21View Solution
Match the following Column A to Column B
 02:10View Solution
Find the area of figure given below.
 02:17View Solution
Find the perimeter of the figure given below.
 02:10View Solution
Find the area of the figure given below.
 03:12View Solution
The inequation represented by the graph given below is :
04:00View SolutionThe inequation that best describes the graph given below is _________
05:46View SolutionThe inequation that best describes the following graph is _________
06:52View SolutionMatch the followings (column I with column II)
ltimg src="https://d10lpgp6xz60nq.cloudfront.net/physics_images/NCERT_BIO_XI_C03_E01_011_Q01.png" width="80%"gt03:10View Solution

