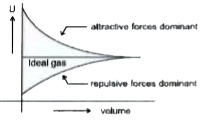
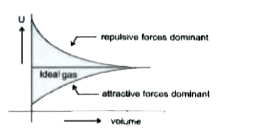
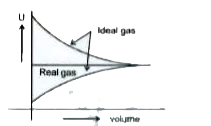
Which of the following diagram correctly represents the variation of internal energy (U) of gas under expansion at constant temperature. Solution in Telugu


None of the above
The correct Answer is:B
Step by step video, text & image solution for Which of the following diagram correctly represents the variation of internal energy (U) of gas under expansion at constant temperature. by Chemistry experts to help you in doubts & scoring excellent marks in Class 12 exams.
Topper's Solved these Questions
- BOOK - AAKASH SERIESCHAPTER - CHEMICAL THERMODYNAMICSEXERCISE - Practice Sheet- Exercise-II30videos
CHEMICAL THERMODYNAMICS
- BOOK - AAKASH SERIESCHAPTER - CHEMICAL THERMODYNAMICSEXERCISE - Practice Sheet- Exercise-III30videos
CHEMICAL THERMODYNAMICS
- BOOK - AAKASH SERIESCHAPTER - CHEMICAL THERMODYNAMICSEXERCISE - Lecture Sheet -Exercise-IV16videos
CHEMICAL THERMODYNAMICS
- BOOK - AAKASH SERIESCHAPTER - CHEMICAL KINETICSEXERCISE - Objective Exercise - 4 (Assertion (A) & Reason (R) Type Questions)44videos
CHEMICAL KINETICS
- BOOK - AAKASH SERIESCHAPTER - CHEMISTRY IN EVERY DAY LIFEEXERCISE - PRACTICE EXERCISE29videos
CHEMISTRY IN EVERY DAY LIFE
Similar Questions
Assertion: Under adiabatic free expansion, (dUdV)T is +ve when attractive forces are dominant between gas molecules [U,V,T respresent internal energy, volume and temperature of gas respectively]
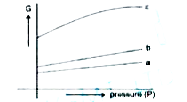
Reason: Internal energy is a state function.02:14View SolutionThe following curve represents the variation of Gibbs function 'G' with pressure at constant temperature. Correct match of given plots with the physical state of a substance is
 02:35View Solution
For a reaction R1,ΔG=xKJmol−1. For a reaction R2,ΔG=yKJmol−1. Reaction R1 is non-spontaneous but along with R2 it is spontaneous. This means that
01:46View Solution(A) Spontaneous reaction may be slow or fast.
(R ) Spontaneous nature deals with feasibility of the reaction but not rate.02:19View SolutionAnti allergy drugs are
05:07View SolutionWhich of the following graphs correctly represents the variation of β=−dV/dPV
with P for an ideal gas at constant temperature?02:47View SolutionWhich of the following graphs correctly represents the variation of β=−(dVdP)/V with P for an ideal gas at constant temperature
02:14View SolutionWhich of following graphs correctly represent variation of alpha = (-(dV//dP)_(T))/(V) with P for fixed amount of an ideal gas at constant temperature ?
View SolutionWhich one of the following represents correctly the variations of surface tension with temperature θ ?
View SolutionWhich of the following graph represents the variation of amount of chemisorption of a gas by a solid with temperature under constant pressure?
View SolutionIf heat energy is given to an ideal gas at constant pressure, then select the graph which best represents the variation of VT with temperature (T).
03:14View SolutionWhich of the following graphs correctly represents the variation of β=−dV/dPV
with P for an ideal gas at constant temperature?01:33View SolutionWhich of the following graphs correctly represents the variation of β=−(dVdP)1V with P for an ideal gas at constant temperature ?
View SolutionWhich of the following graphs correctly represent the variation of beta = -(dV//dP)/(V) with P for an ideal gas at constant temperature?
01:59View SolutionWhich of the following graphs correctly represents the variation of β=−(dV/dP)/V with P for an ideal gas at constant temperature?
01:41View Solution

