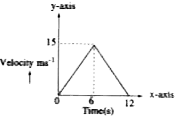
The velocity-time plot for a particle moving on a straight line is shown in the figure

(a) The particle has a constant acceleration.
(b) The particle has never turned around.
(c) The particle has zero displacement.
(d) The average speed in the interval 0 to 10s is the same as the average speed in the in terval 10 s to 20 s
a & b are correct
b & c are correct
c & d are correct
a & d are correct
The correct Answer is:D
Topper's Solved these Questions
- MOTION IN A STRAIGHT LINE BOOK - AAKASH SERIESCHAPTER - MOTION IN A STRAIGHT LINE EXERCISE - EXERCISE -II
80 Videos
- MOTION IN A STRAIGHT LINE BOOK - AAKASH SERIESCHAPTER - MOTION IN A STRAIGHT LINE EXERCISE - PRACTICE EXERCISE
58 Videos
- MOTION IN A STRAIGHT LINE BOOK - AAKASH SERIESCHAPTER - MOTION IN A STRAIGHT LINE EXERCISE - very Short answer type question
15 Videos
- MOTION IN A PLANEBOOK - AAKASH SERIESCHAPTER - MOTION IN A PLANEEXERCISE - QUESTION FOR DESCRIPTIVE ANSWER
7 Videos
- MOVING CHARGES AND MAGNETISMBOOK - AAKASH SERIESCHAPTER - MOVING CHARGES AND MAGNETISMEXERCISE - EXERCISE-III
45 Videos
Similar Questions
Knowledge Check
If average velocity of particle moving on a straight line is zero in a time interval, then
AAcceleration of particle may be zeroBVelocity of particle must be zero at an instantCVelocity of particle may be never zero in the intervalDAverage speed of particle may be zero in the intervalThe velocity-time graph of a particle moving in a straight line is shown in figure. The mass of the particle is 2kg. Work done by all the forces acting on the particle in time interval between t=0 to t=10s is
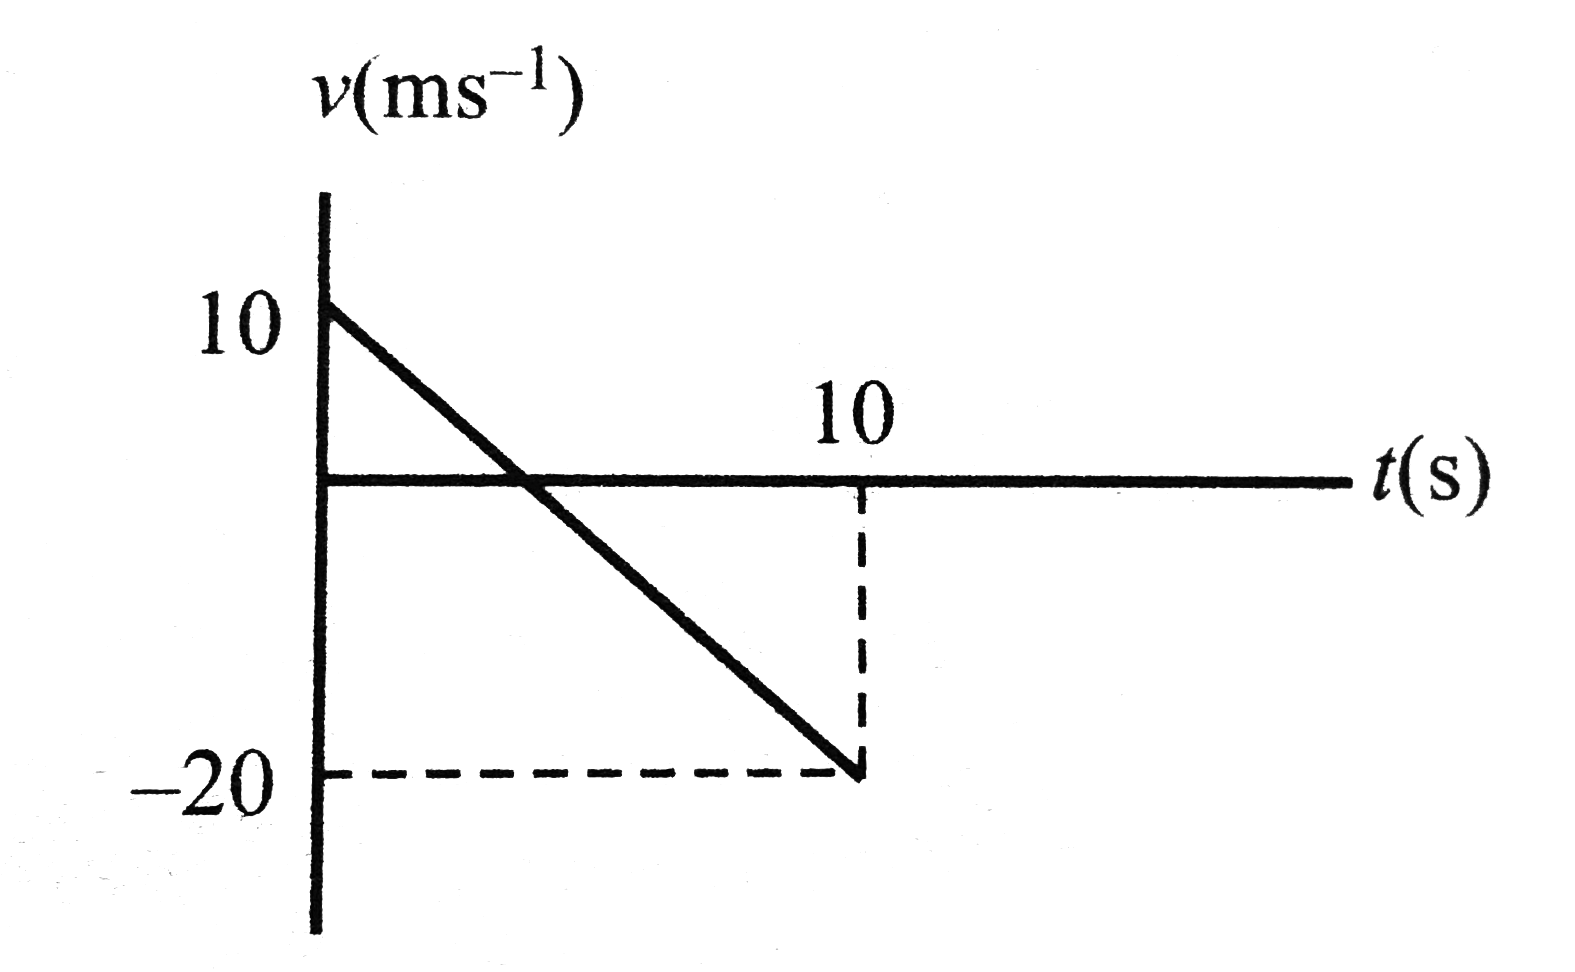 A(a) 300JB(b) −300JC(c) 400JD(d) −400J
Velocity-time graph of a particle moving in a straight line is shown in figure. In the time interval from t = 0 to t = 14 s, find:
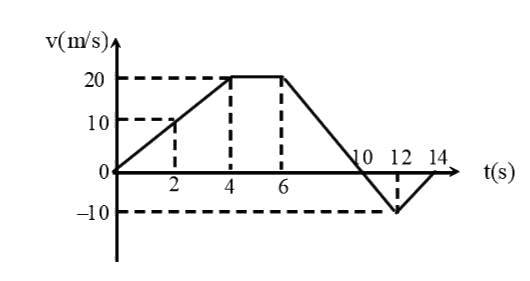
Q. average speed of the particleA20m/sB40m/sC10m/sD30m/s
Velocity-time graph of a particle moving in a straight line is shown in figure. At time t=0.s=20m. Plot a-t and s-t graphs of the particle.
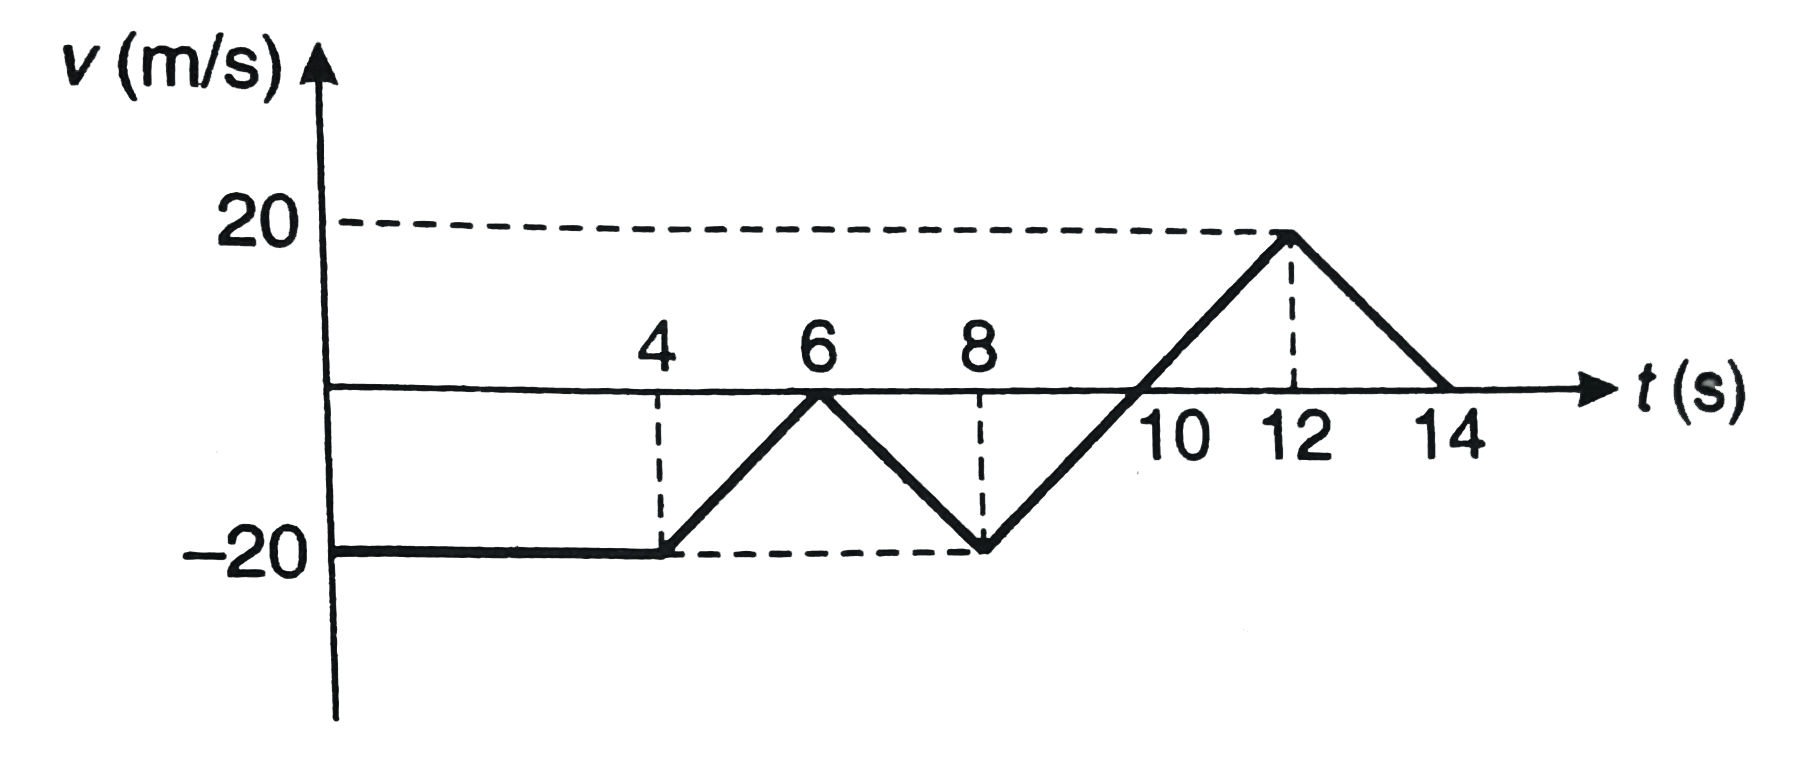
View SolutionThe velocity-time graph of a particle moving in a straight line is shown in figure. The mass of the particle is 2kg. Work done by all the forces acting on the particle in time interval between t=0 to t=10s is

View SolutionThe position (x) - time (t) graph for a particle moving along a straight line is shown in figure. The average speed of particle in time interval t = 0 to t = 8 s is
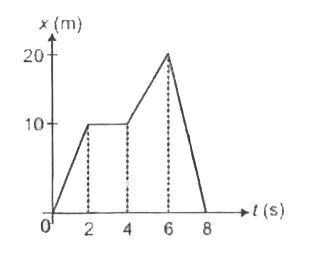
View SolutionThe position (x) - time (t) graph for a particle moving along a straight line is shown in figure. The average speed of particle in time interval t = 0 to t = 8 s is

View SolutionVelocity time graph for the motion of a particle along a straight line is as shown in figure.
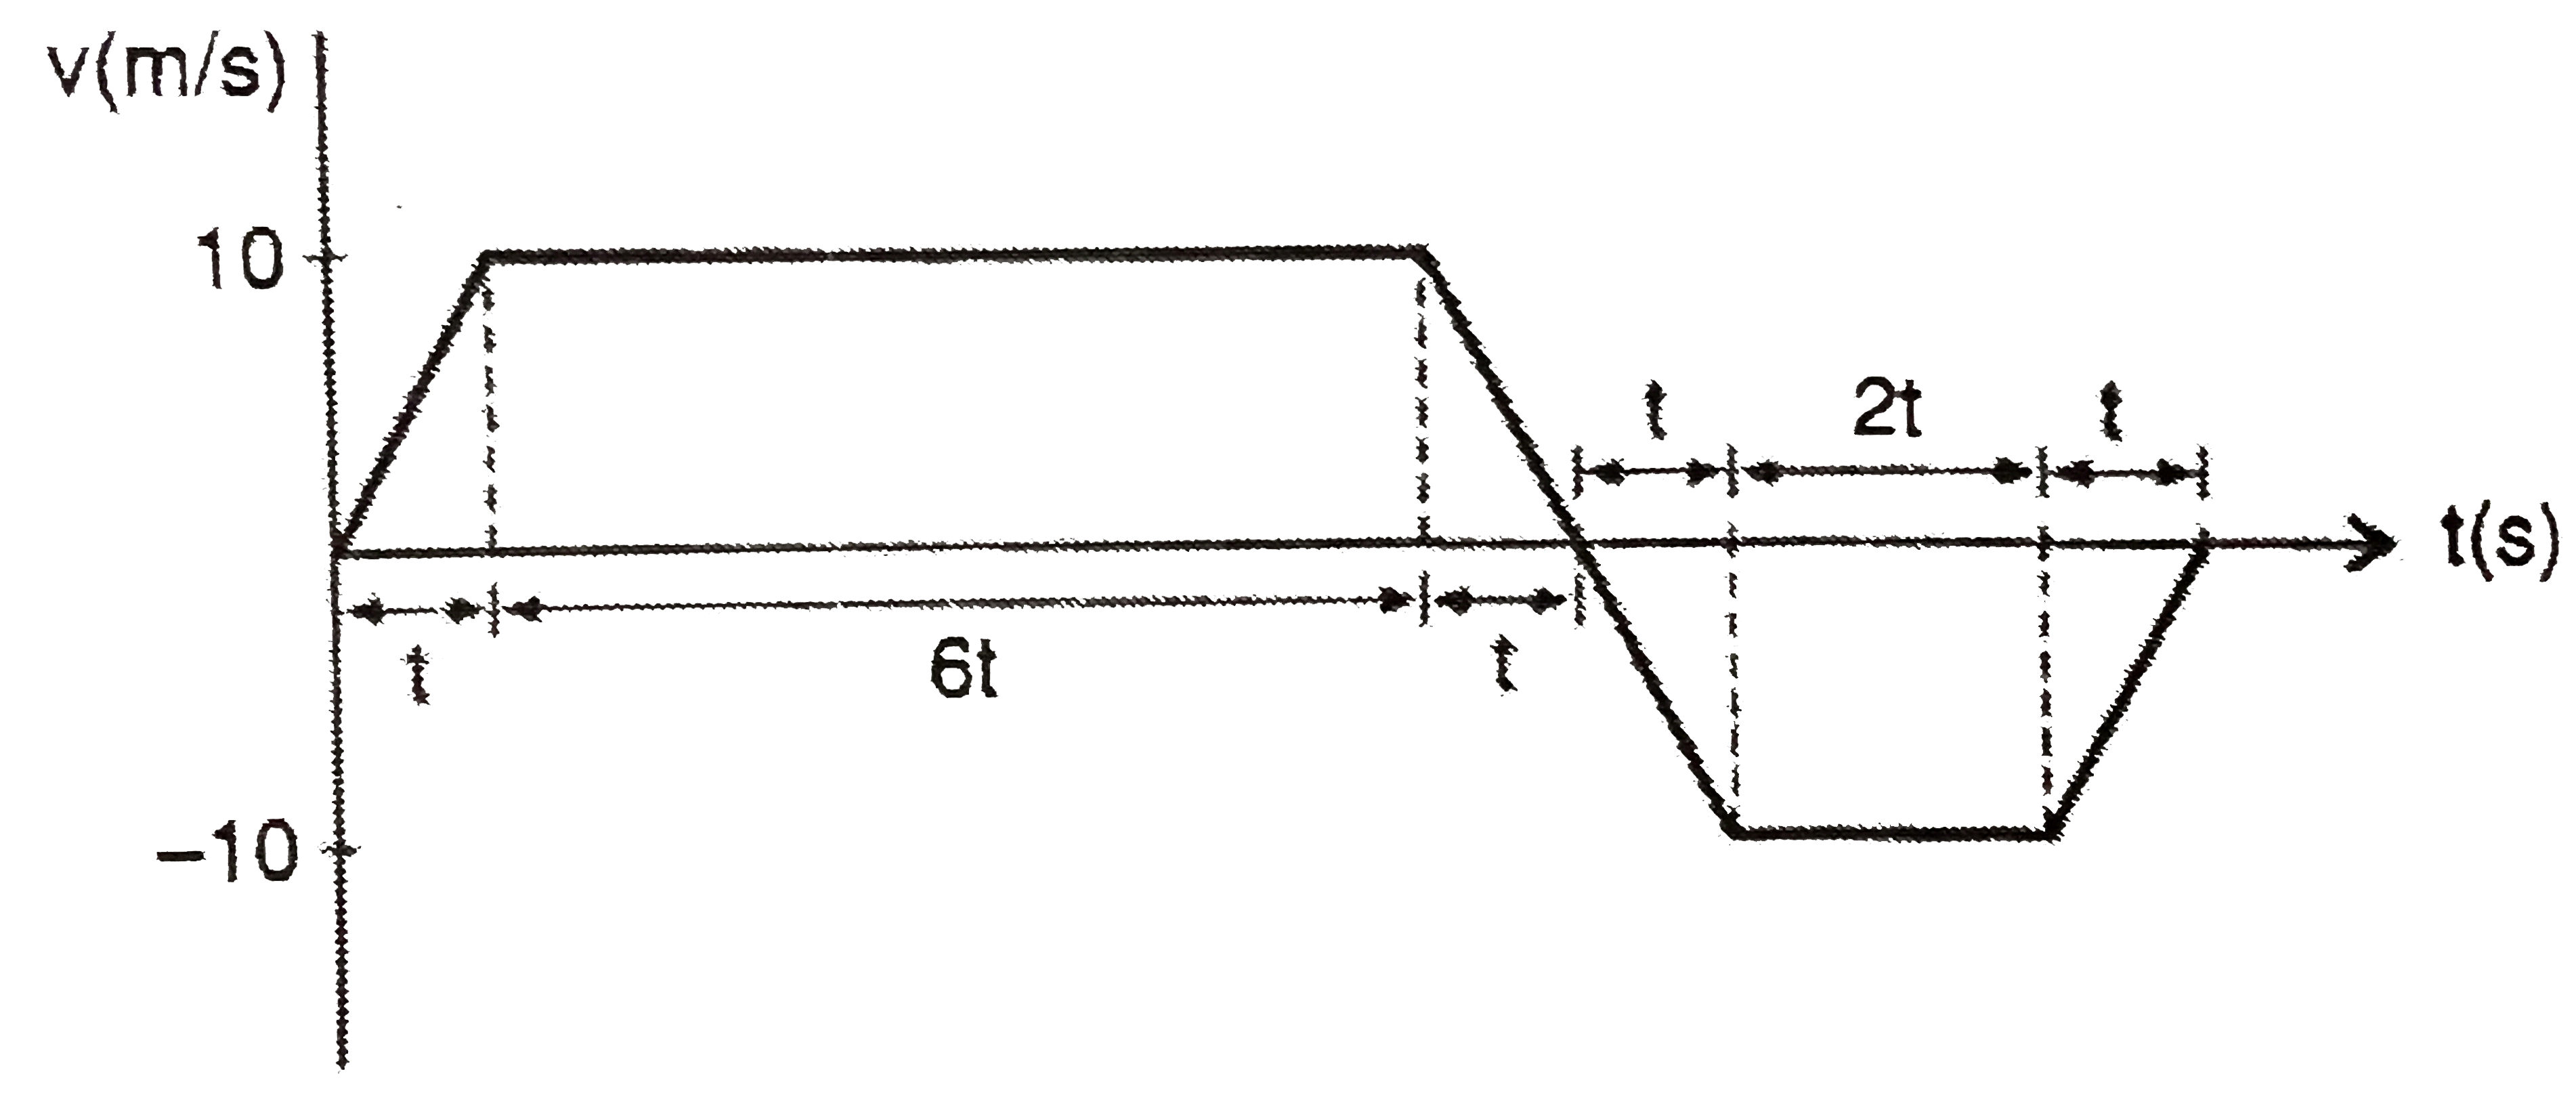
Average speed of the particle for the whole motion is:
View Solution

