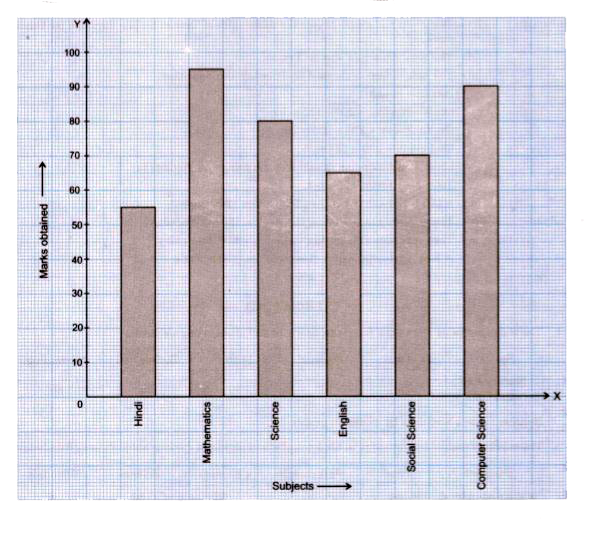
Observe this bar graph which shows the marks obtained by Aziz in half-yearly examination in different subjects.
To solve the question based on the bar graph showing the marks obtained by Aziz in his half-yearly examinations, we will follow these steps:
Step 1: Understand the Bar Graph
First, we need to observe the bar graph carefully. The graph represents different subjects on the x-axis and the marks obtained on the y-axis. Each bar's height indicates the marks scored in each subject.
Hint: Look for the labels on the x-axis (subjects) and y-axis (marks) to understand what the graph is showing.
Step 2: Identify the Subjects
Next, we will identify the subjects represented in the bar graph. The subjects are typically labeled at the bottom of the graph.
Hint: Check the bottom of the graph for the names of the subjects.
Step 3: Determine Maximum Marks
To find the subject in which Aziz scored the maximum marks, we will look for the tallest bar in the graph. The height of this bar indicates the highest score.
Hint: Compare the heights of all the bars to find which one is the tallest.
Step 4: Determine Minimum Marks
Similarly, to find the subject in which Aziz scored the minimum marks, we will look for the shortest bar in the graph. The height of this bar indicates the lowest score.
Hint: Look for the bar that is the shortest compared to the others.
Step 5: List Subjects and Marks
Finally, we will list each subject along with the corresponding marks obtained by Aziz. We will read the height of each bar to determine the marks.
Hint: For each subject, draw a line to the y-axis to see the exact marks represented by the height of the bar.
Final Summary
After following these steps, we can summarize the findings:
- Maximum Marks: Hindi (80 marks)
- Minimum Marks: Social Studies (40 marks)
- Marks in Each Subject:
- Hindi: 80
- English: 60
- Mathematics: 70
- Science: 50
- Social Studies: 40
First, we need to observe the bar graph carefully. The graph represents different subjects on the x-axis and the marks obtained on the y-axis. Each bar's height indicates the marks scored in each subject.
Next, we will identify the subjects represented in the bar graph. The subjects are typically labeled at the bottom of the graph.
To find the subject in which Aziz scored the maximum marks, we will look for the tallest bar in the graph. The height of this bar indicates the highest score.
Similarly, to find the subject in which Aziz scored the minimum marks, we will look for the shortest bar in the graph. The height of this bar indicates the lowest score.
Finally, we will list each subject along with the corresponding marks obtained by Aziz. We will read the height of each bar to determine the marks.
After following these steps, we can summarize the findings:
- Maximum Marks: Hindi (80 marks)
- Minimum Marks: Social Studies (40 marks)
- Marks in Each Subject:
- Hindi: 80
- English: 60
- Mathematics: 70
- Science: 50
- Social Studies: 40
Topper's Solved these Questions
- DATA HANDLINGBOOK - NCERT ENGLISHCHAPTER - DATA HANDLINGEXERCISE - EXERCISE 9.4
4 Videos
- DATA HANDLINGBOOK - NCERT ENGLISHCHAPTER - DATA HANDLINGEXERCISE - EXERCISE 9.1
7 Videos
- DATA HANDLINGBOOK - NCERT ENGLISHCHAPTER - DATA HANDLINGEXERCISE - SOLVED EXAMPLES
9 Videos
- BASIC GEOMETRICAL IDEASBOOK - NCERT ENGLISHCHAPTER - BASIC GEOMETRICAL IDEASEXERCISE - EXERCISE 4.6
4 Videos
- DECIMALSBOOK - NCERT ENGLISHCHAPTER - DECIMALSEXERCISE - EXERCISE 8.3
2 Videos
Similar Questions
In Figure, the pie-chart shows the marks obtained by a student in an examination. If the student secures 440 marks in all, calculate his marks in each of the given subjects.
View SolutionObserve this bar graph which is showing the sale of shirts in a ready made shop from Monday to Saturday
View SolutionWhich graph will show equilibrium condition?
View SolutionRead the given bar graph and answer the question that follow :

What was the total marks obtained in all the subjects together?
View SolutionThe table shows the marks obtained by 25 students in a class test. Find the mean of the marks obtained

View SolutionGiven below (figure) is the bar graph indicating the marks obtained out of 50 in mathematics paper by 100 students. Read the bar graph and answer the following questions: It is decided to distribute work books on mathematics to the students obtaining less then 20 marks, giving one workbook to each of such students. If a work book costs Rs.5, what sum is required to buy the work books? Every student belonging to the highest mark group is entitled to get a prize of Rs. 10. How much amount of money is required for distributing the prize money? Every student belonging to the lowest mark-group has to solve 5 problems per day. How many problems, in all, will be solved by the students of this group per day? State whether true or false. 17% students have obtained marks ranging from 40 to 49. 59 students have obtained marks ranging from 10 to 29. What is the number of students getting less than 20 marks? What is the number of students getting more than 29 marks? What is the number of students getting marks between 9 to 40? What is the number of students belonging to the highest mark group? What is the number of students obtaining more than 19 marks?
View SolutionIn Figure, the pie-chart shows the marks obtained by a student in various subjects. If the student scored 135 marks in mathematics, find the total marks in all the subject. Also, find his score in individual subjects.
View SolutionThe mean of marks obtained in an examination by a group of 100 students was found to be 49.96. The mean of the marks obtained in the same examination by another group of 200 students was 52.32, then the mean of the marks obtained by both the groups of students taken together is
View Solution
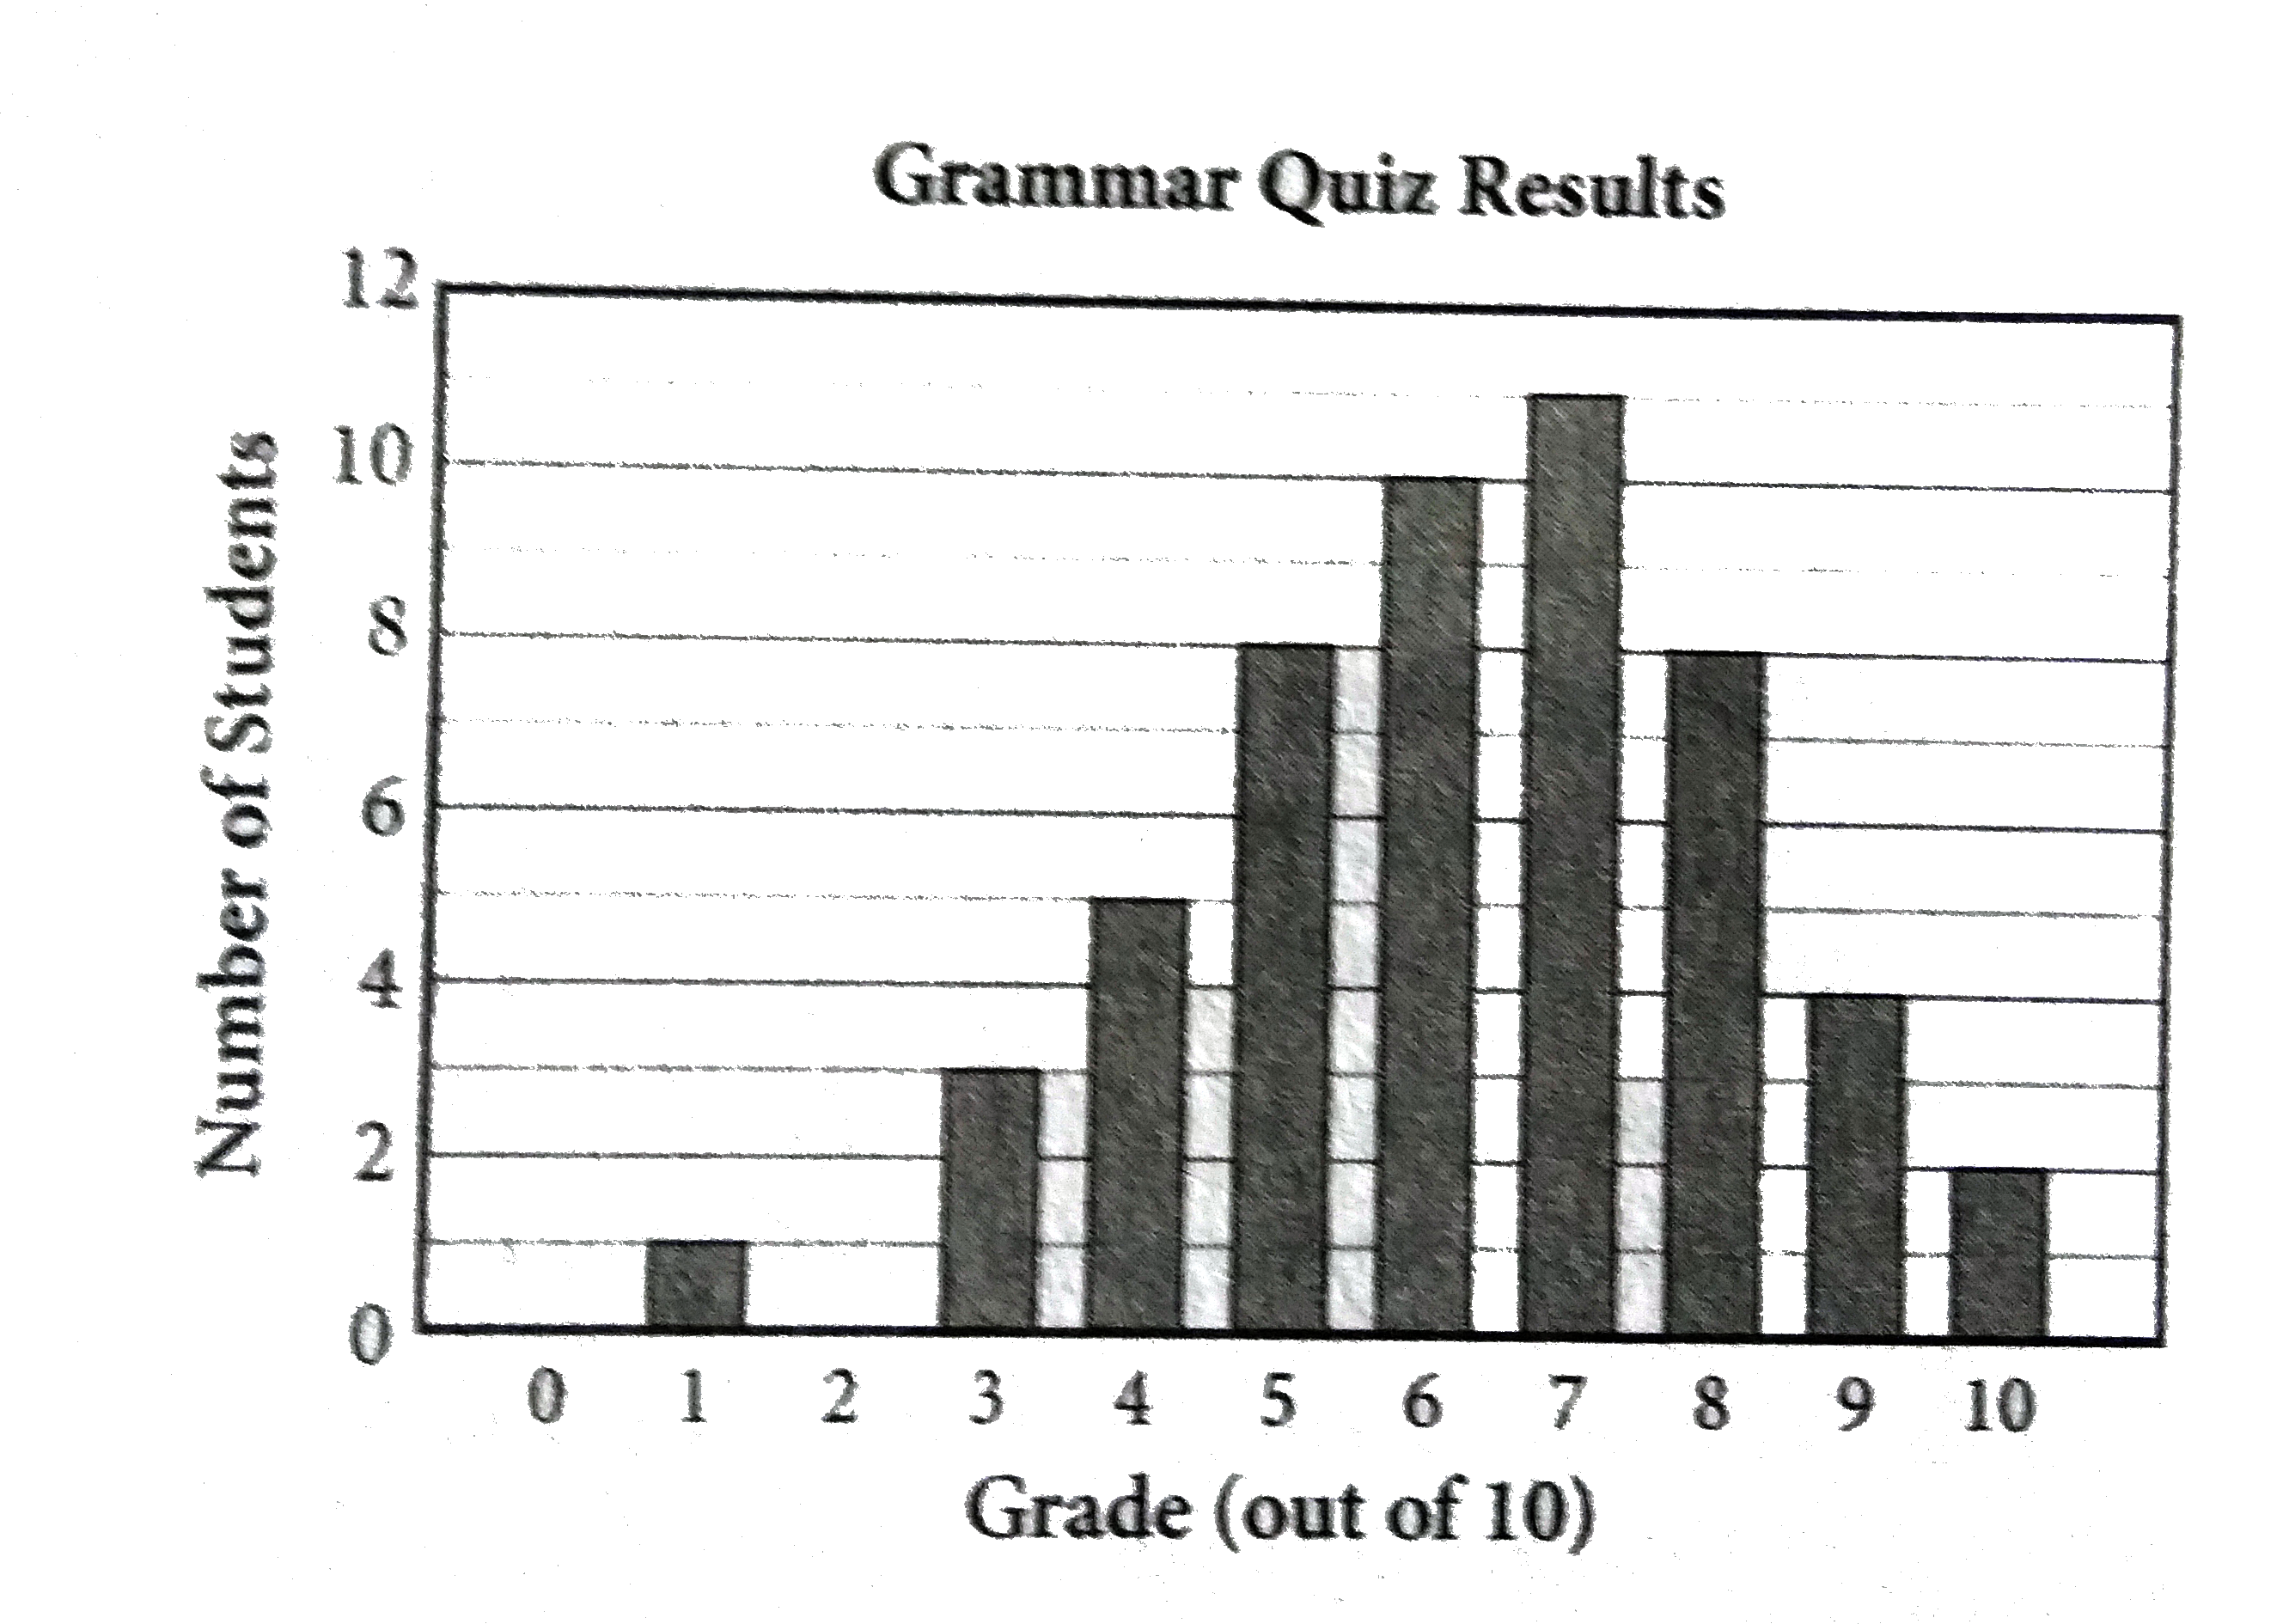
The bar graph shows the result of a grammar quiz in a language arts class. What is the difference between the mean and median of the quiz scores? Round your answer to the nearest hundredth.
View SolutionRead the bar graph given in Figure and answer the following questions: What information is given by the bar graph? What was the crop-production of rice in 1970-71? What is the difference between the maximum and minimum production of rice?
View Solution
