Number of persons in various age groups in a town is given in the following tableDraw a bar graph to represent the above information and answer the following questions. (take 1 unit length = 20 thousands)(a) Which two age groups have same population?(b) All persons in the age group of 60 and above are called senior citizens. How many senior citizens are there in the town?
To solve the problem, we will follow these steps:
Step 1: Prepare the Data
We need to organize the data from the table provided. The age groups and their corresponding populations are as follows:
- Age group 1 to 14 years: 200,000 (2 lakh)
- Age group 15 to 29 years: 160,000 (1 lakh 60 thousand)
- Age group 30 to 44 years: 120,000 (1 lakh 20 thousand)
- Age group 45 to 59 years: 120,000 (1 lakh 20 thousand)
- Age group 60 to 74 years: 80,000 (80 thousand)
- Age group 75 years and above: 40,000 (40 thousand)
Step 2: Draw the Bar Graph
1. Set the Scale: We will take 1 unit length = 20,000 persons.
2. Y-axis: Label the Y-axis with increments of 20,000 up to 200,000.
3. X-axis: Label the X-axis with the age groups.
4. Draw Bars:
- For 1 to 14 years: Draw a bar up to 200,000 (10 units high).
- For 15 to 29 years: Draw a bar up to 160,000 (8 units high).
- For 30 to 44 years: Draw a bar up to 120,000 (6 units high).
- For 45 to 59 years: Draw a bar up to 120,000 (6 units high).
- For 60 to 74 years: Draw a bar up to 80,000 (4 units high).
- For 75 years and above: Draw a bar up to 40,000 (2 units high).
Step 3: Analyze the Graph
Now that we have drawn the bar graph, we can analyze it to answer the questions.
Step 4: Answer the Questions
(a) Which two age groups have the same population?
- From the graph, we can see that the age groups 30 to 44 years and 45 to 59 years both have a population of 120,000.
(b) How many senior citizens are there in the town?
- Senior citizens are defined as those aged 60 and above. This includes:
- Age group 60 to 74 years: 80,000
- Age group 75 years and above: 40,000
- Therefore, the total number of senior citizens is:
- 80,000 + 40,000 = 120,000
Final Answers:
(a) The age groups 30 to 44 years and 45 to 59 years have the same population of 120,000.
(b) There are 120,000 senior citizens in the town.
---
We need to organize the data from the table provided. The age groups and their corresponding populations are as follows:
- Age group 1 to 14 years: 200,000 (2 lakh)
- Age group 15 to 29 years: 160,000 (1 lakh 60 thousand)
- Age group 30 to 44 years: 120,000 (1 lakh 20 thousand)
- Age group 45 to 59 years: 120,000 (1 lakh 20 thousand)
- Age group 60 to 74 years: 80,000 (80 thousand)
- Age group 75 years and above: 40,000 (40 thousand)
1. Set the Scale: We will take 1 unit length = 20,000 persons.
2. Y-axis: Label the Y-axis with increments of 20,000 up to 200,000.
3. X-axis: Label the X-axis with the age groups.
4. Draw Bars:
- For 1 to 14 years: Draw a bar up to 200,000 (10 units high).
- For 15 to 29 years: Draw a bar up to 160,000 (8 units high).
- For 30 to 44 years: Draw a bar up to 120,000 (6 units high).
- For 45 to 59 years: Draw a bar up to 120,000 (6 units high).
- For 60 to 74 years: Draw a bar up to 80,000 (4 units high).
- For 75 years and above: Draw a bar up to 40,000 (2 units high).
Now that we have drawn the bar graph, we can analyze it to answer the questions.
(a) Which two age groups have the same population?
- From the graph, we can see that the age groups 30 to 44 years and 45 to 59 years both have a population of 120,000.
- Senior citizens are defined as those aged 60 and above. This includes:
- Age group 60 to 74 years: 80,000
- Age group 75 years and above: 40,000
- Therefore, the total number of senior citizens is:
- 80,000 + 40,000 = 120,000
(a) The age groups 30 to 44 years and 45 to 59 years have the same population of 120,000.
(b) There are 120,000 senior citizens in the town.
Topper's Solved these Questions
- DATA HANDLINGBOOK - NCERT ENGLISHCHAPTER - DATA HANDLINGEXERCISE - EXERCISE 9.1
7 Videos
- DATA HANDLINGBOOK - NCERT ENGLISHCHAPTER - DATA HANDLINGEXERCISE - EXERCISE 9.3
3 Videos
- BASIC GEOMETRICAL IDEASBOOK - NCERT ENGLISHCHAPTER - BASIC GEOMETRICAL IDEASEXERCISE - EXERCISE 4.6
4 Videos
- DECIMALSBOOK - NCERT ENGLISHCHAPTER - DECIMALSEXERCISE - EXERCISE 8.3
2 Videos
Similar Questions
Study the bar graph representing the number of persons in various age groups in a town shown in Figure. Observe the bar graph and answer the following questions: What is the percentage of the youngest age-group persons over those in the oldest age group? What is the total population of the town? What is the number of persons in the age-group 60-65? How many persons are more in the age-group 10-15 then in the age group 30-35? What is the age-group of exactly 1200 persons living in the town? What is the total number of persons living in the town in the age-group 50-55? What is the total number of persons living in the town in the age-groups 10-15 and 60-65? Whether the population in general increases, decreases or remains constant with the increase in the age-group.
View SolutionStudy the bar graph representing the number of persons in various age groups in a town shown in Figure. Observe the bar graph and answer the following questions:
(i)What is the percentage of the youngest age-group persons over those in the oldest age group?
(ii)What is the total population of the town?
(iii)What is the number of persons in the age group 60-65?
(iv)What is the age-group of exactly 1200 persons living in the town?
(v)What is the total number of persons living in the town in the age group 50-55?
(vi)What is the total number of persons living in the town in the age group 10-15 and 60-65?
View SolutionThe given graph represents the age and number of members of a hiking group who are planning an excursion. Study the graph and answer the following question.
Which age group has the least members in the hiking group?
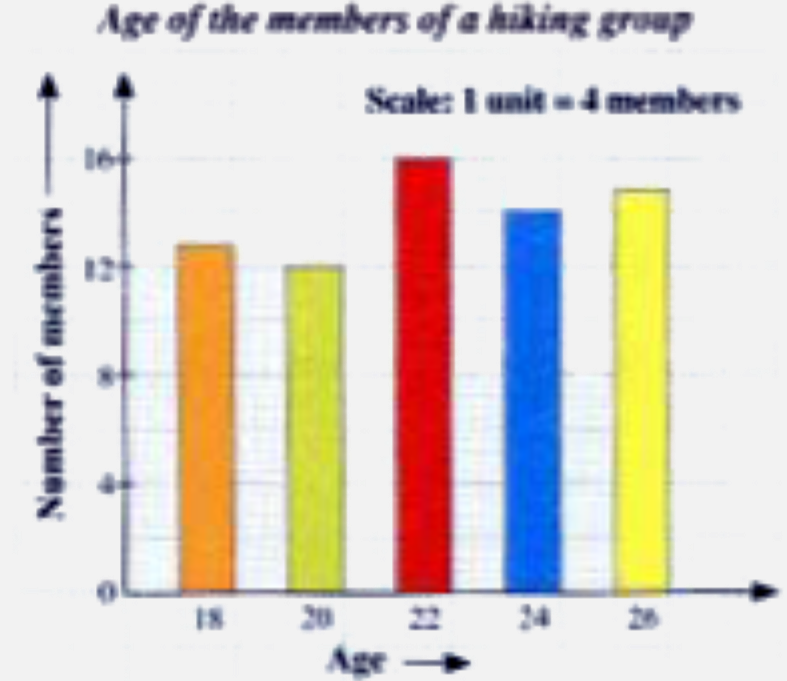
View SolutionThe given graph represents the age and number of members of a hiking group who are planning an excursion. Study the graph and answer the following question.
Which age group has the maximum members in the hiking gruoup?

View SolutionAn unmanned satellite A and a spacecraft B are orbiting around the earth in the same circular orbit as shown.
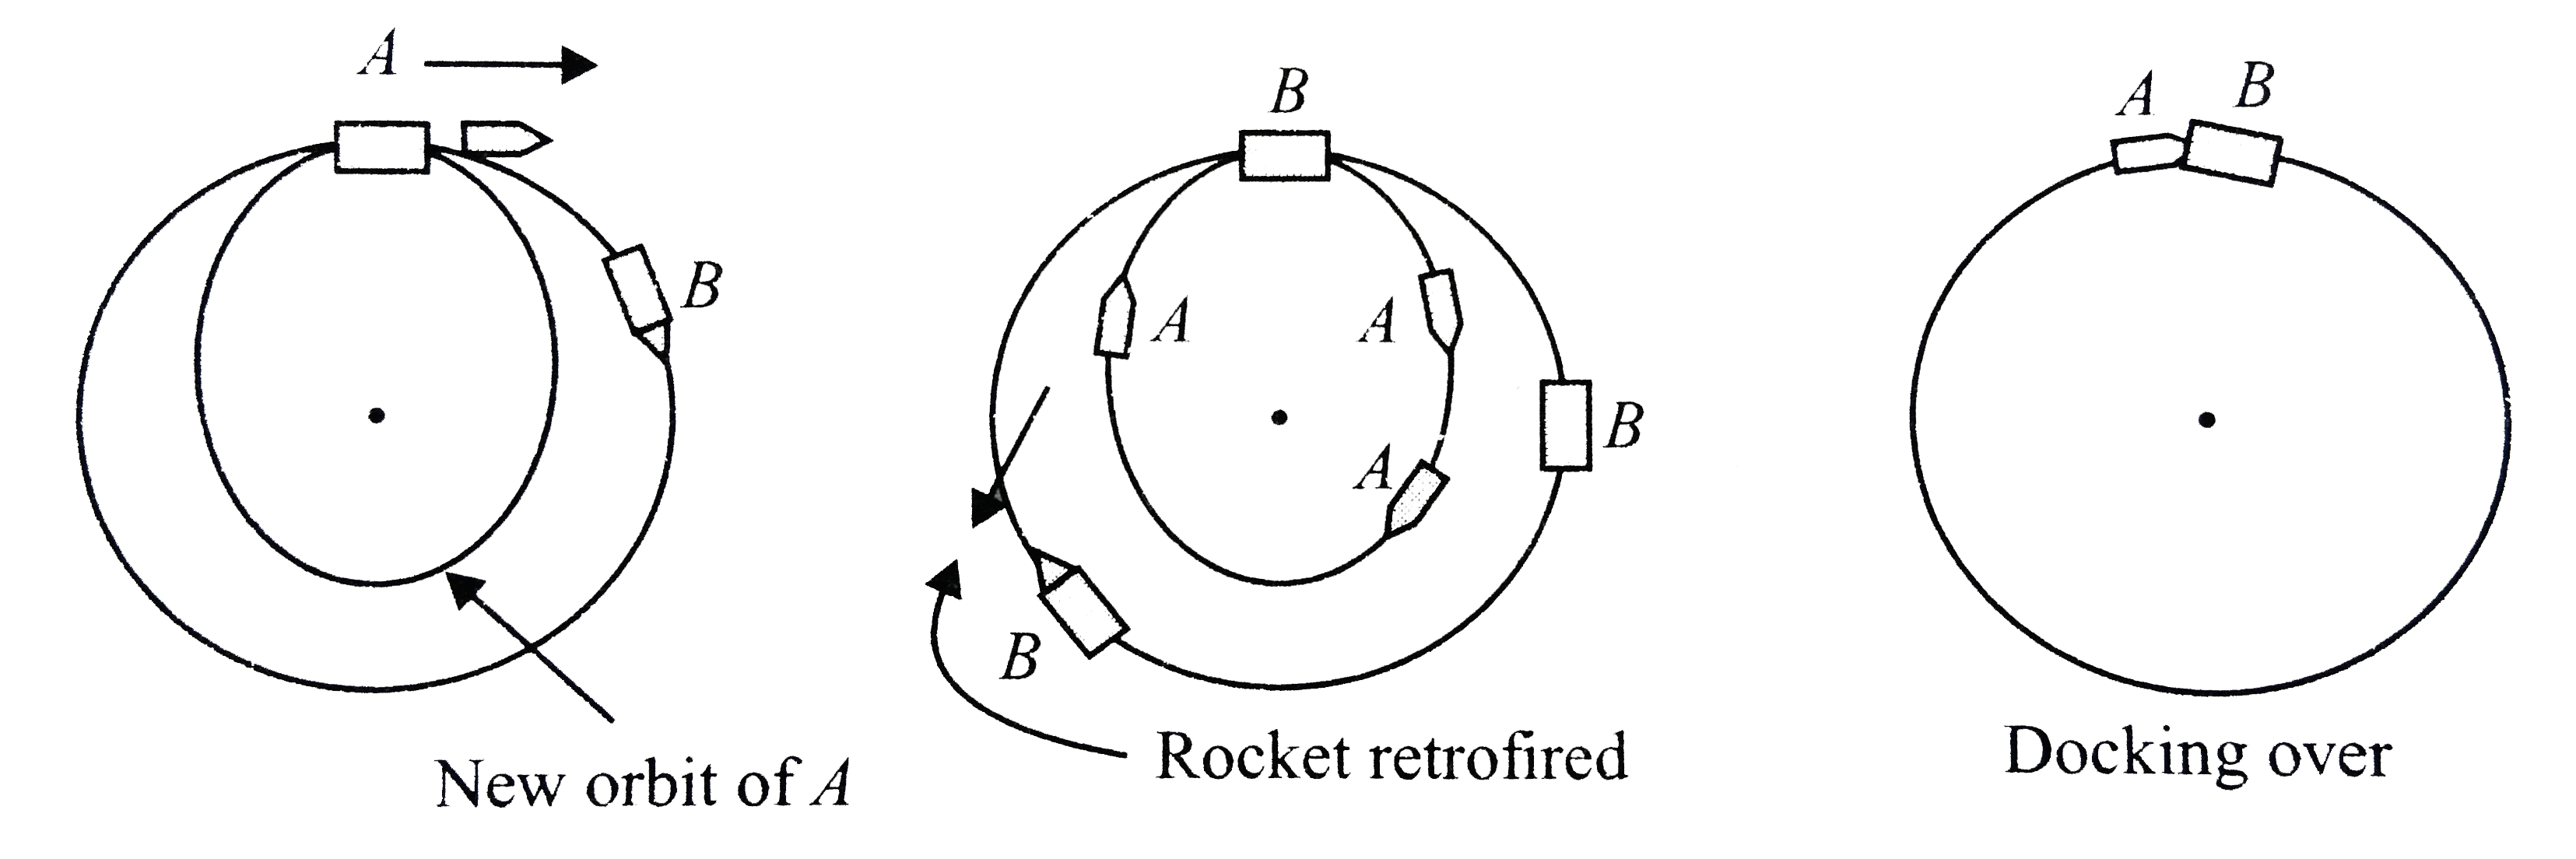
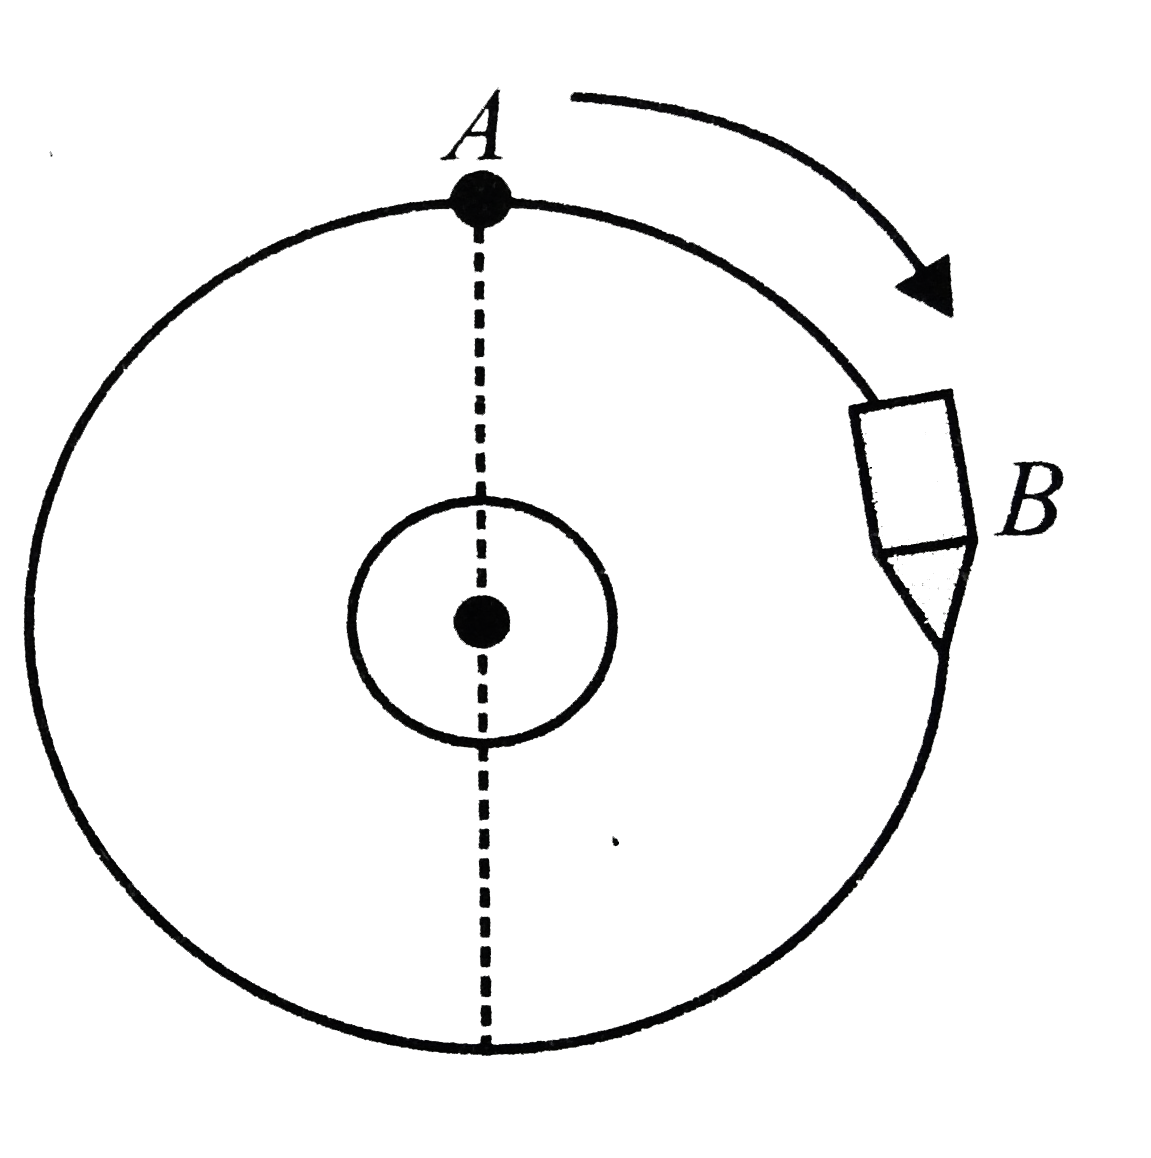 The spacecraft is ahead of the satellite by some time. Let us consider that some technical problem has arisen in the satellite and the astronaut from B has made it correct. For this to be done docking of two (A and B) is required (in layman terms connecting A and B). To achieve this, the rockets of A have been fired in forward direction and docking takes place as shown in the figure below:
Take mass of the earth =5.98×1024kg
Radius of the earth =6400km
Orbital radius =9600km
Mass of satellite A=320kg
Mass of spacecraft =3200kg
Assume that initially spacecraft B leads satellite A by 100s, i.e., A arrives at any particle position after 100s of B’s arrival. Based on the above information answer the following questions. After once returning to the original point, i.e., the place from where the rockets have been fired, in which direction and with what extent the rockets have to be fired from the satellite to again come back in the original orbit?
View SolutionAn unmanned satellite A and a spacecraft B are orbiting around the earth in the same circular orbit as shown.
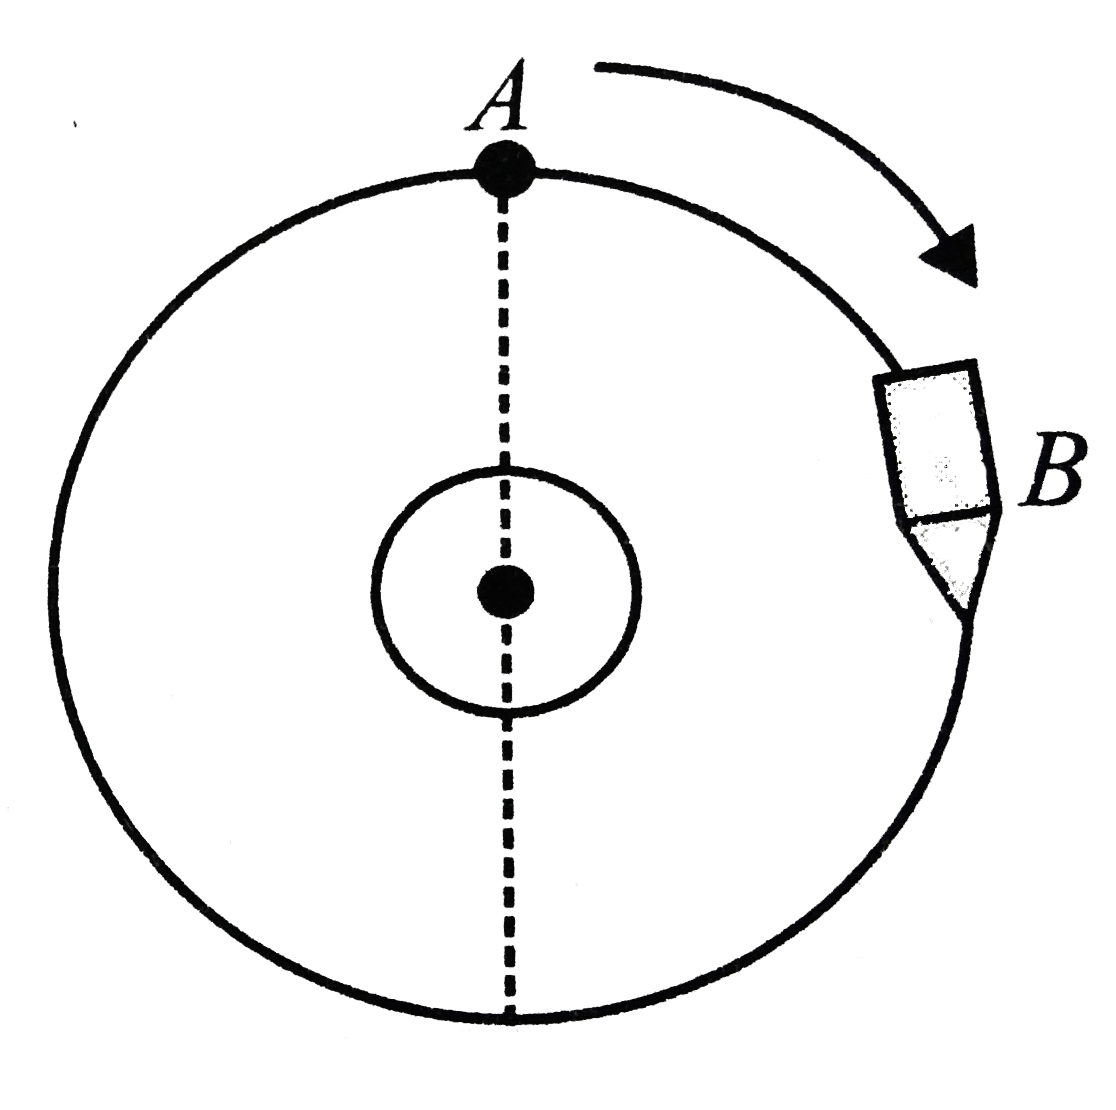 The spacecraft is ahead of the satellite by some time. Let us consider that some technical problem has arisen in the satellite and the astronaut from B has made it correct. For this to be done docking of two (A and B) is required (in layman terms connecting A and B). To achieve this, the rockets of A have been fired in forward direction and docking takes place as shown in the figure below:
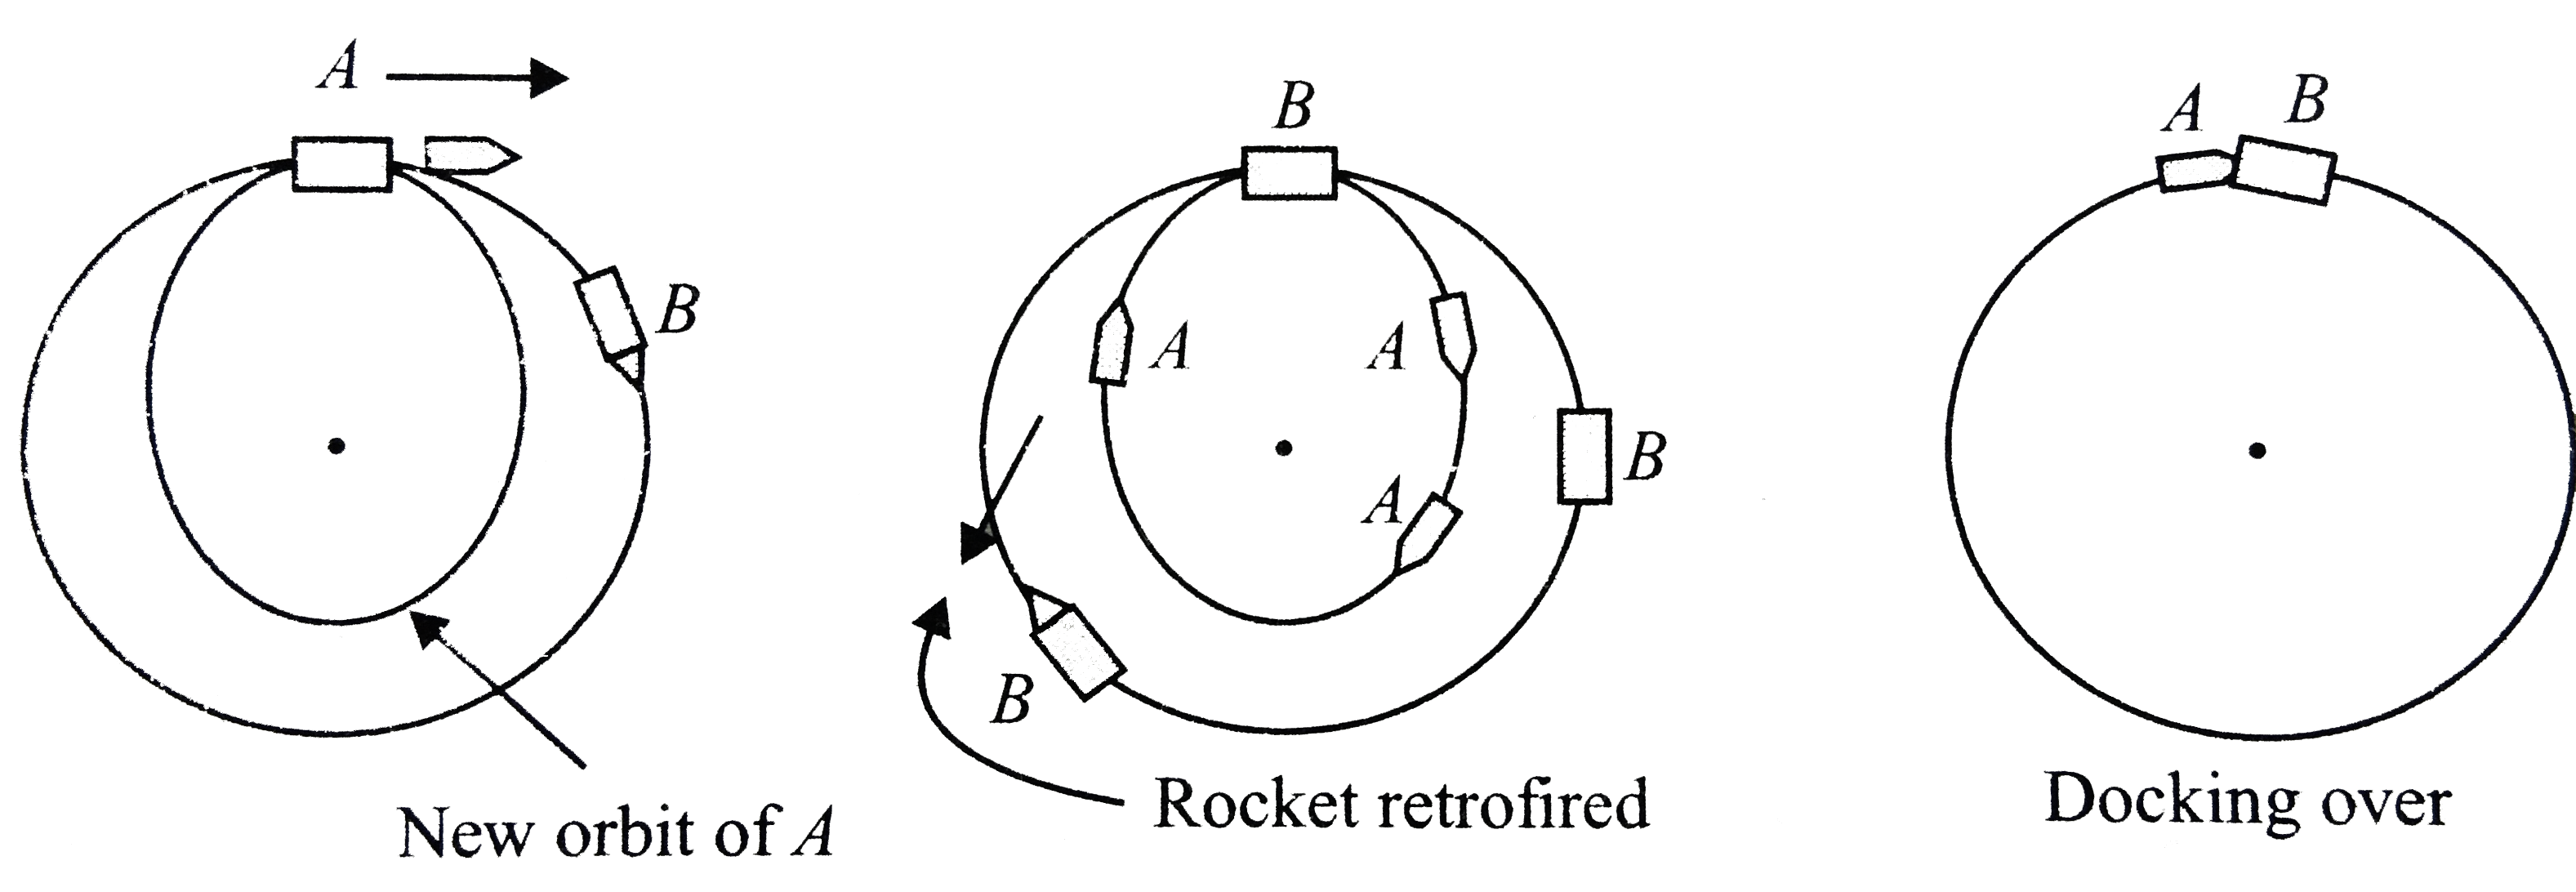
Take mass of the earth =5.98×1024kg
Radius of the earth =6400km
Orbital radius =9600km
Mass of satellite A=320kg
Mass of spacecraft =3200kg
Assume that initially spacecraft B leads satellite A by 100s, i.e., A arrives at any particle position after 100s of B’s arrival. Based on the above information answer the following questions.
To dock A and B in the above-described situation, one can use the rocket system of either one, i.e., either of A or of B. To accomplish docking in the minimum possible time which is the best way?
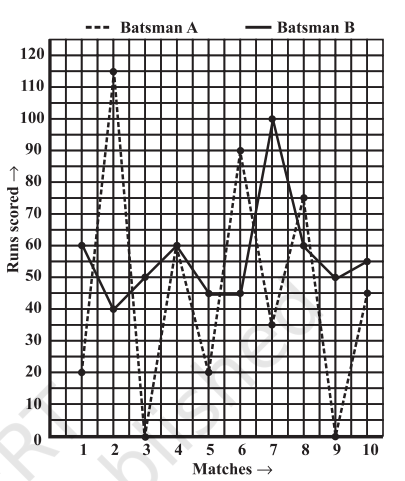
View Solution(A graph on “performance”)The given graph (Fig 15.7) represents the total runs scored by two batsmen A and B, during each of the ten different matches in the year 2007. Study the graph and answer the following questions.(i) What information is given on the two axes?(ii) Which line shows the runs scored by batsman A?(iii) Were the run scored by them same in any match in 2007? If so, in which match?(iv) Among the two batsmen, who is steadier? How do you judge it?
View SolutionOne day Chetan's mother developed a severe stomach ache all of a sudden. She was rushed to the doctor who suggested for an immediate endoscopy test and gave an estimate of expenditure for the same. Chetan immediately contacted his class teacher and shared the information with her. The class teacher arranged for the money and rushed to the hospital. On realising that Chetan belonged to a below average income group family, even the doctor offered concession for the test fee. The test was conducted suessfully.
Answer the following questions based on the above information :
(a) Which principle in optics is made use of in endoscopy ?
(b) Briefly explain the values reflected in the action taken by the teacher.
(c) In what way do you appreciate the response of the doctor on the given situation?
View SolutionGiven below (figure) is the bar graph indicating the marks obtained out of 50 in mathematics paper by 100 students. Read the bar graph and answer the following questions: It is decided to distribute work books on mathematics to the students obtaining less then 20 marks, giving one workbook to each of such students. If a work book costs Rs.5, what sum is required to buy the work books? Every student belonging to the highest mark group is entitled to get a prize of Rs. 10. How much amount of money is required for distributing the prize money? Every student belonging to the lowest mark-group has to solve 5 problems per day. How many problems, in all, will be solved by the students of this group per day? State whether true or false. 17% students have obtained marks ranging from 40 to 49. 59 students have obtained marks ranging from 10 to 29. What is the number of students getting less than 20 marks? What is the number of students getting more than 29 marks? What is the number of students getting marks between 9 to 40? What is the number of students belonging to the highest mark group? What is the number of students obtaining more than 19 marks?
View SolutionIn a particular section of Class IX, 40 students were asked about the months of their birth and the following graph was prepared for the data so obtained:Observe the bar graph given above and answer the following questions:(i) How many students were born in the month of November?(ii) In which month were the maximum number of students born?
View Solution
