The following line graph shows the yearly sales figures for a manufacturing company.(a) What were the sales in (i) 2002 (ii) 2006?(b) What were the sales in (i) 2003 (ii) 2005?(c) Compute the difference between the sales in 2002 and 2006.
To solve the question step by step, we will analyze the line graph and extract the required information.
Step 1: Identify the sales figures for 2002 and 2006.
- From the graph, we observe that the sales in 2002 were 4 crores.
- For 2006, the sales were 8 crores.
Step 2: Identify the sales figures for 2003 and 2005.
- Looking at the graph again, the sales in 2003 were 6 crores.
- In 2005, the sales were 10 crores.
Step 3: Compute the difference between the sales in 2002 and 2006.
- To find the difference, we subtract the sales in 2002 from the sales in 2006:
Difference=Sales in 2006−Sales in 2002=8 crores−4 crores=4 crores
Final Answers:
(a)
- (i) Sales in 2002: 4 crores
- (ii) Sales in 2006: 8 crores
(b)
- (i) Sales in 2003: 6 crores
- (ii) Sales in 2005: 10 crores
(c) The difference between the sales in 2002 and 2006 is 4 crores.
---
- From the graph, we observe that the sales in 2002 were 4 crores.
- For 2006, the sales were 8 crores.
- Looking at the graph again, the sales in 2003 were 6 crores.
- In 2005, the sales were 10 crores.
- To find the difference, we subtract the sales in 2002 from the sales in 2006:
Difference=Sales in 2006−Sales in 2002=8 crores−4 crores=4 crores
(a)
- (i) Sales in 2002: 4 crores
- (ii) Sales in 2006: 8 crores
- (i) Sales in 2003: 6 crores
- (ii) Sales in 2005: 10 crores
Topper's Solved these Questions
- INTRODUCTION TO GRAPHSBOOK - NCERT ENGLISHCHAPTER - INTRODUCTION TO GRAPHSEXERCISE - EXERCISE 15.3
2 Videos
- INTRODUCTION TO GRAPHSBOOK - NCERT ENGLISHCHAPTER - INTRODUCTION TO GRAPHSEXERCISE - SOLVED EXAMPLES
8 Videos
- FACTORISATIONBOOK - NCERT ENGLISHCHAPTER - FACTORISATIONEXERCISE - EXERCISE 14.1
3 Videos
- LINEAR EQUATIONS IN ONE VARIABLEBOOK - NCERT ENGLISHCHAPTER - LINEAR EQUATIONS IN ONE VARIABLEEXERCISE - EXERCISE 2.3
9 Videos
Similar Questions
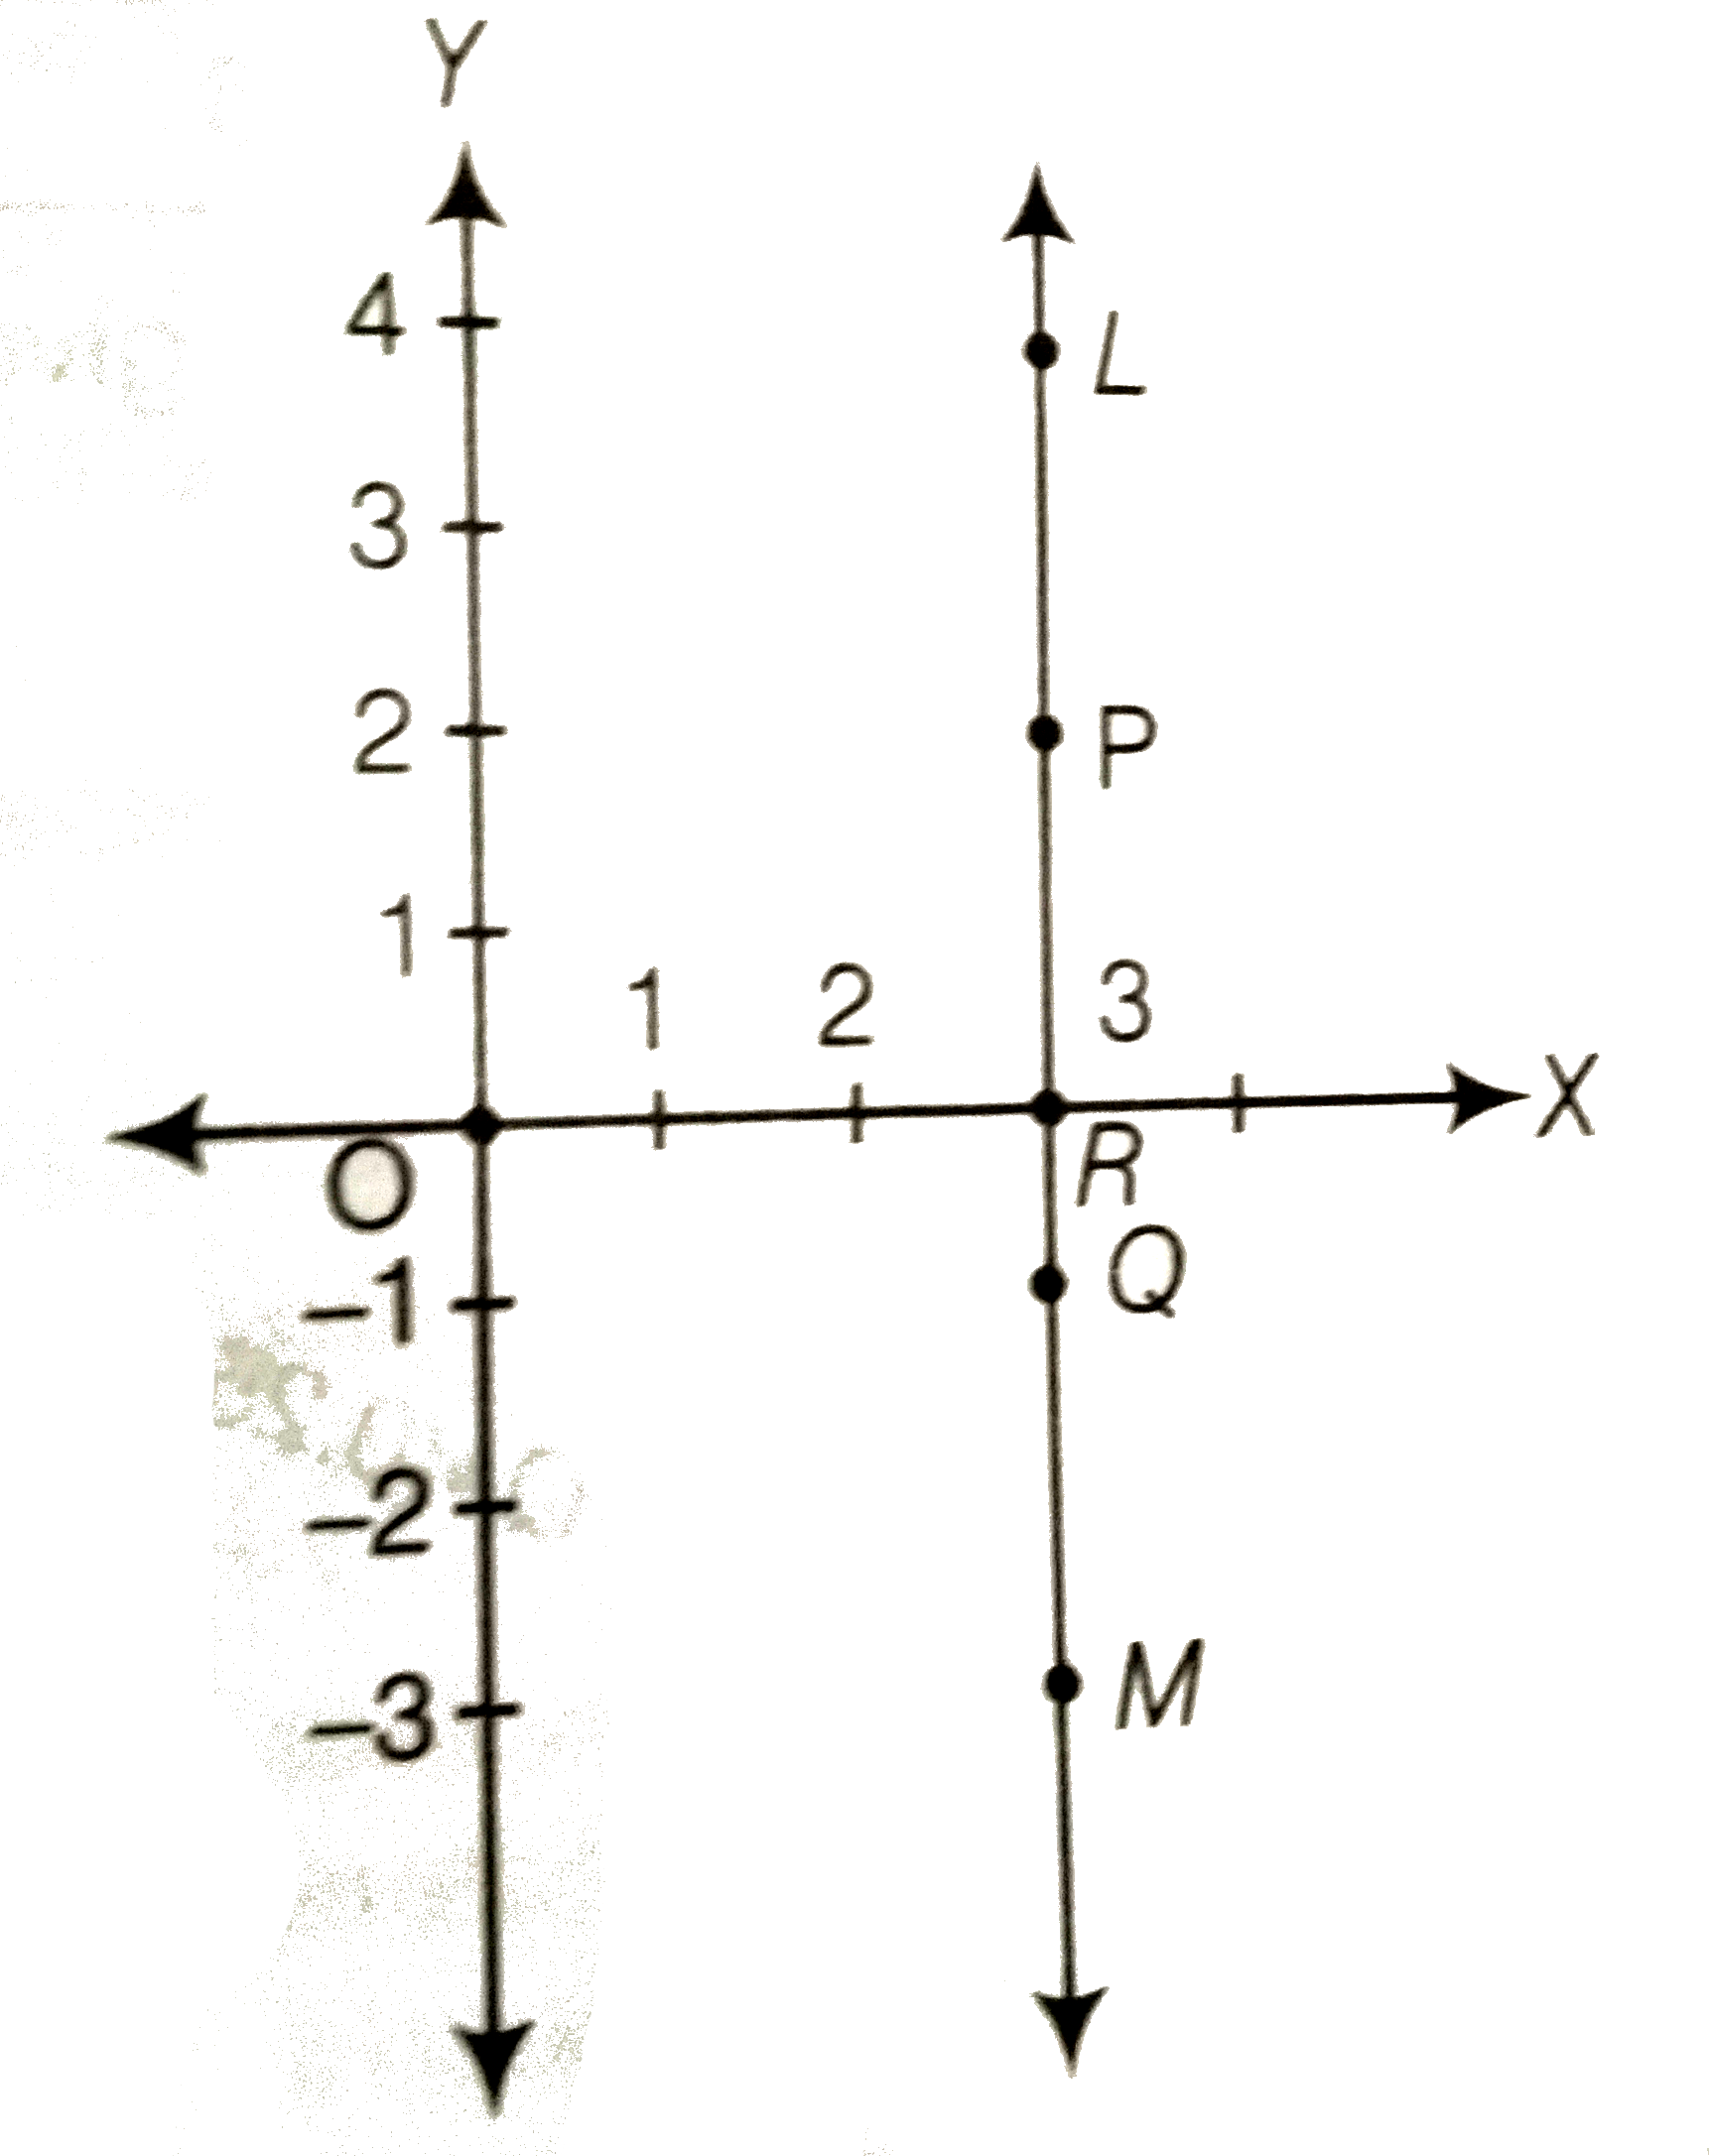
In figure LM is a line parallel to the Y-axis at a distance of 3 units .
(i) What are the coordinates of the points P,R and Q ?
(ii) What is the difference between the abscissa of the points L and M ?

View SolutionAnswer the following questions:
(i) Why are vitamin A and vitamin C essential for us?
(ii) What is the difference between a nucleoside and a nucleotide?
View SolutionThe following graph show the temprature of a patient in a hospital, recorded every hour, (a) What was the patient's temperature at 1 p.m.? *b) When was the patient's temperature 38.5∘C ? (c) The patient’s temperature was the same two times during the period given. What were these two times? (d) What was the temperature at 1.30 p.m.? How did you arrive at your answer? (e) During which periods did the patients’ temperature showed an upward trend?
View SolutionThe following bar graph represents the data for different sizes of shoes worn by the students in a school. Read the graph and answer the following questions.
(i)What are the different numbers of the shoe-worn by the students?
(ii)What is the number of students wearing shoe No. 6?
(iii)Which shoe number is worn by the maximum number of students?
(iv)Which shoe number is worn by the minimum number of students?
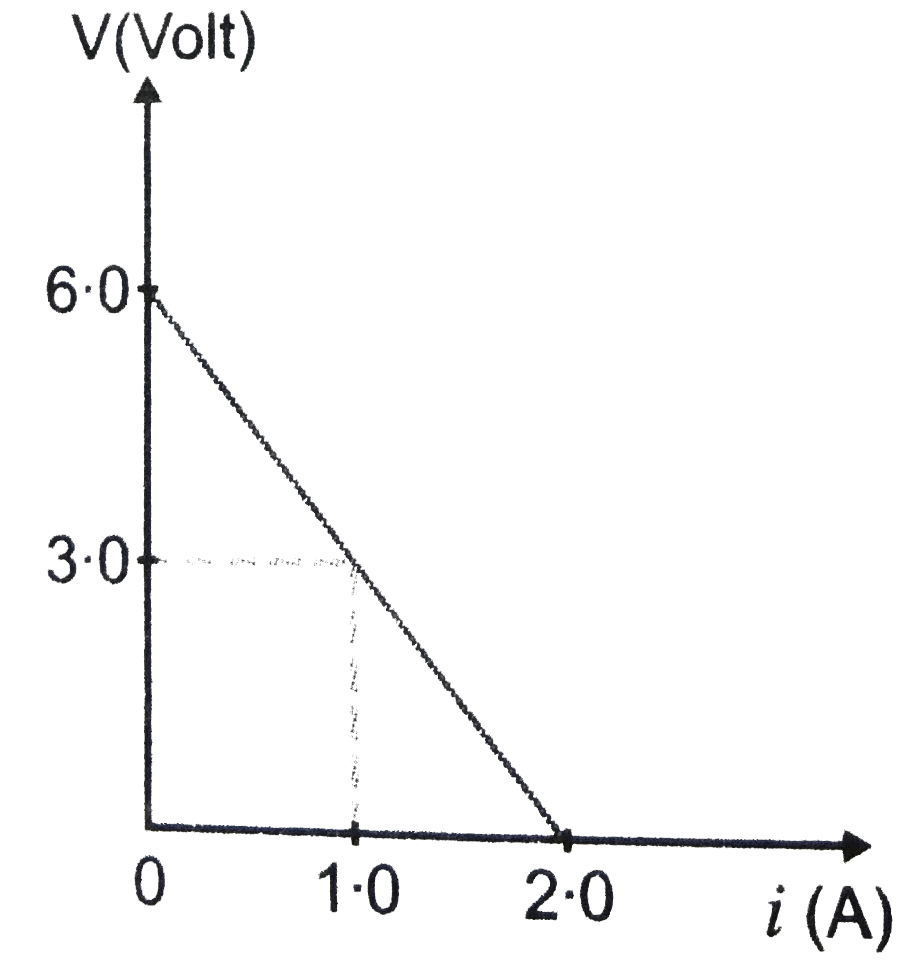
View SolutionThe following graph shows the variation of terminal potential difference V, across a combination of three cells in series to a resistor versus the current I :
(i) Calculate the emf of each cell. (ii) For what current I, will the power dissipation of the circuit be maximum ?

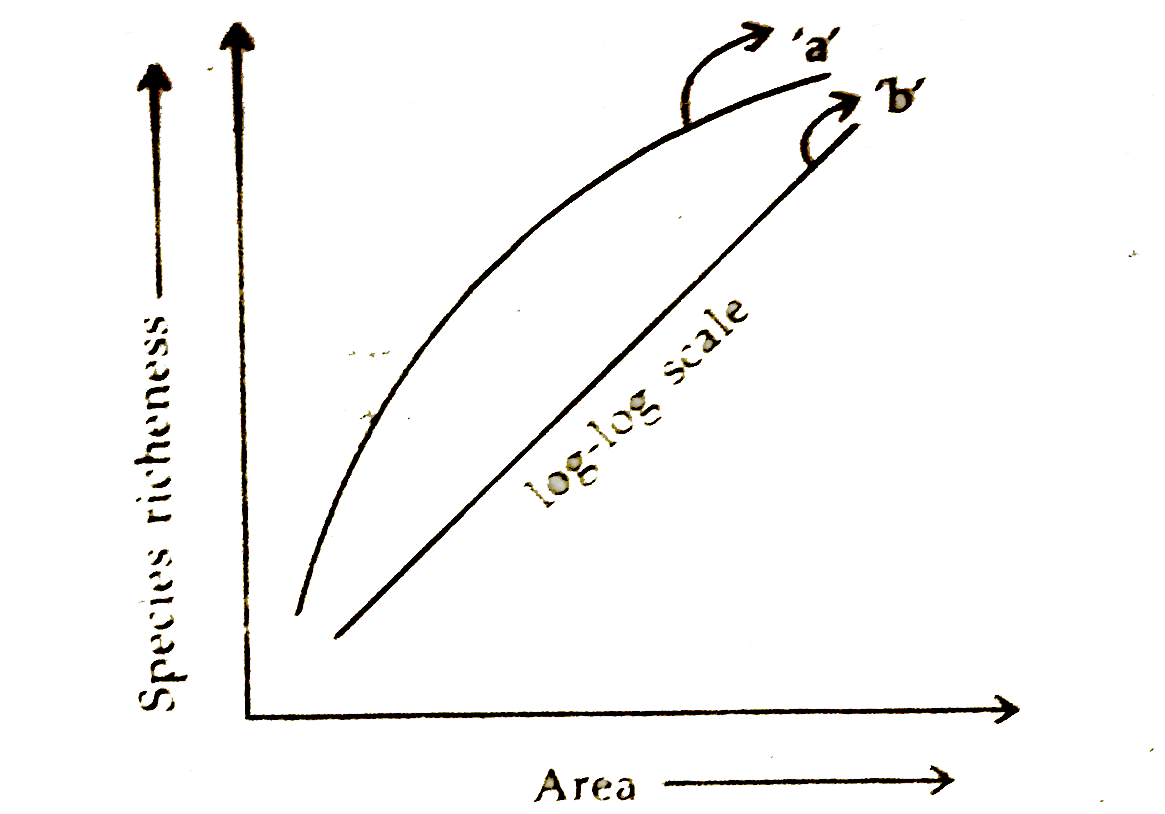
View SolutionThe following graph shows the species area relationship. Answers the Questions as directed.
(a) Name the naturalist who studied the kind of relationship shown in the graph.
Write the observations made by him.
(b) Write the situations as discovered by the ecologists when the value of 'Z' (slope of the line) lies between
(i) 0.1 and 0.2, (ii) 0.6 and 1.2
What does 'Z' stand for ?
(c ) When would the slope of the line 'b' become steeper ?

View SolutionFollowing number line shows the temperature in degree celsius 90∘C right ) at different places on a particular day. (a) Observe this number line and write the temperature of the places marked on it. (b) What is the temperature difference between the hottest and the coldest places among the above? (c) What is the temperature difference between Lahulspiti and Srinagar? (d) Can we say temperature of Srinagar and Shimla taken together is less than the temperature at Shimla? Is it also less than the temperature at Srinagar ?
View Solution
(i) Study the above table and fill in the blanks.
(ii) What is the relationship between C and D elements ?
(iii) Define the term stated in (ii).
(iv) Write the formula of compound formed between D and B.
View SolutionThe following pie-chart shows the number of students admitted in different feculties of a college. If 1000 students are admitted in Science answer the following:
(i) What is the total number of students?
(ii) What is the ratio of students in science and arts?
View Solution
