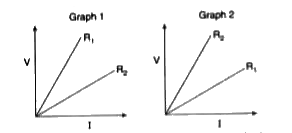
Two students perform experiments on two given ralstors R1 and R2 and plot the following V-I graphs. If R1>R2 which of the two diagrams correctly represent th.e situation on the plotted curves ? Justify your answer.
 Solution in Kannada
R1>R2
Hence graph I is correct as R1 is large so the slope of V-I graph (VI) is greater in graph I and is correctly represented as R1.
Topper's Solved these Questions
- ELECTRICITYBOOK - OSWAAL PUBLICATIONCHAPTER - ELECTRICITYEXERCISE - TOPIC-2 ( Multiple Choice Questions )
2 Videos
- ELECTRICITYBOOK - OSWAAL PUBLICATIONCHAPTER - ELECTRICITYEXERCISE - TOPIC-2 ( Match the Column)
1 Videos
- ELECTRICITYBOOK - OSWAAL PUBLICATIONCHAPTER - ELECTRICITYEXERCISE - TOPIC-1 (Short Answer Type Questions -II)
18 Videos
- LIGHT-REFLECTION AND REFRACTIONBOOK - OSWAAL PUBLICATIONCHAPTER - LIGHT-REFLECTION AND REFRACTIONEXERCISE - NCERT CORNER (TEXTBOOK EXERCISES)
15 Videos
Similar Questions
Three resistances of 4Ω,5Ω and 20Ω are connected in parallel. Their combined resistance is :
View SolutionMatch the Column:

View SolutionWhat is meant by saying that the potential difference between two points is 1 V? .
View SolutionWhich one of the following materials cannot be used ot make a lens?
View SolutionTwo resistors of resistance R1 and R2 having R1>R2 are connected in parallel. For equivalent resistance R, the correct statement is
View SolutionThe capacitance of two concentric spherical shells of radii R_(1) and R_(2) (R_(2) gt R_(1)) is
View SolutionFor students performed experiments on series and parallel combination of two given resistors R_(1) and R_(2) which obey Ohm's law and plotted the following V-I graphs : Which of the graphs is correctly labelled in terms of 'series' and 'parallel' ?
View SolutionTwo Cu wires of radii R1 and R2 are such that (R1>R2) . Then which of the following is true ?
View SolutionIn a ΔABC,with usual notations, observe the two statements given below:
(I) rr1r2r3=Δ2 (II) r1r2+r2r3+r3r1=s2
Which one of the following is correct?
View Solutionयदि दो बहुभुज प्रदेश R1 और R2 इस प्रकार संबद्ध हो कि R1,R2 का एक खंड हो, तो निम्नलिखित में कौन सत्य है?
View SolutionTwo copper wires of radii r_(1) and r_(2) ( r_(1) gt r_(2)) are subjected to same tension and are plucked. Transverse wave will
View SolutionThe capacitance of two concentric spherical shells of radii R1 and R2(R2>R1) is
View SolutionTwo resistors of resistance R_(1) and R_(2) having R_(1) gt R_(2) are connected in parallel. For equivalent resistance R, the correct statement is
View SolutionTwo resistors of resistance R_(1) and R_(2) having R_(1) gt R_(2) are connected in parallel. For equivalent resistance R, the correct statement is
View SolutionThe conbined resistance R of two resistors R,& R2(R1,R2>0) is given by . 1R=1R1+1R2. If R1+R2= constant Prove that the maximum resistance R is obtained by choosing R1=R2
View Solution
