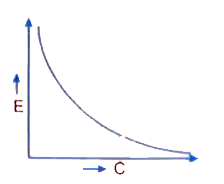
The graph shown here figure, shows the variation of the total energy (E) stored in a capacitor against the value of the capacitance (C) itself. Which of the two - the charge on the capacitor or the potential used to 4 charge it is kept constant for this graph ?

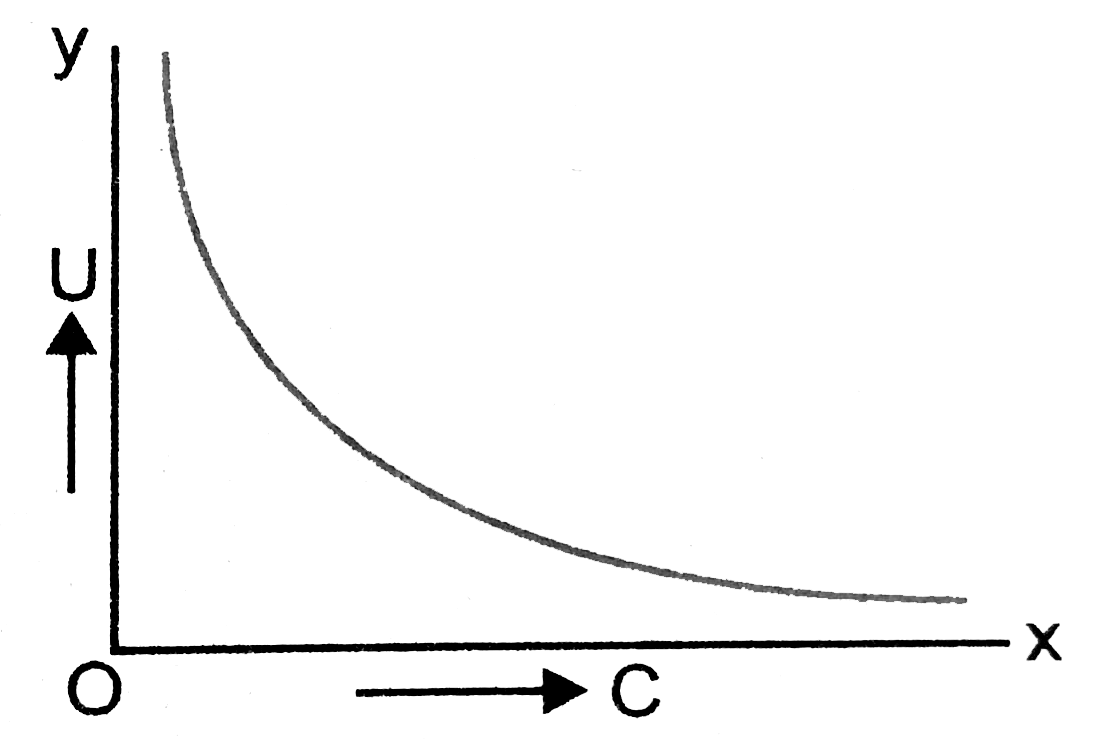
From the graph, it is clear that charge remains constant because then
graph is a hyperbola.
Topper's Solved these Questions
- ELECTROSTATIC POTENTIAL AND CAPACITANCE BOOK - U-LIKE SERIESCHAPTER - ELECTROSTATIC POTENTIAL AND CAPACITANCE EXERCISE - SHORT ANSWER QUESTIONS
48 Videos
- ELECTROSTATIC POTENTIAL AND CAPACITANCE BOOK - U-LIKE SERIESCHAPTER - ELECTROSTATIC POTENTIAL AND CAPACITANCE EXERCISE - LONG ANSWER QUESTIONS-I
64 Videos
- ELECTROSTATIC POTENTIAL AND CAPACITANCE BOOK - U-LIKE SERIESCHAPTER - ELECTROSTATIC POTENTIAL AND CAPACITANCE EXERCISE - ASSERTION-REASON TYPE QUESTIONS
5 Videos
- ELECTROMAGNETICE INDUCTIONBOOK - U-LIKE SERIESCHAPTER - ELECTROMAGNETICE INDUCTIONEXERCISE - Self Assessment Test Section -D
1 Videos
- EXAMINATION PAPER 2020 (SOLVED)BOOK - U-LIKE SERIESCHAPTER - EXAMINATION PAPER 2020 (SOLVED)EXERCISE - SECTION D
6 Videos
Similar Questions
The graph in Fig, shows variation of total energy U stored in the capacitor against the value of the capacitance C itself. Which of the two - the charge on capacitor or potential used to charge is kept constant for this graph ?

View SolutionThe capacitance of a charged capacitor is C and the energy stored in it is U. What is the value of charge on the capacitor?
View Solution
Knowledge Check
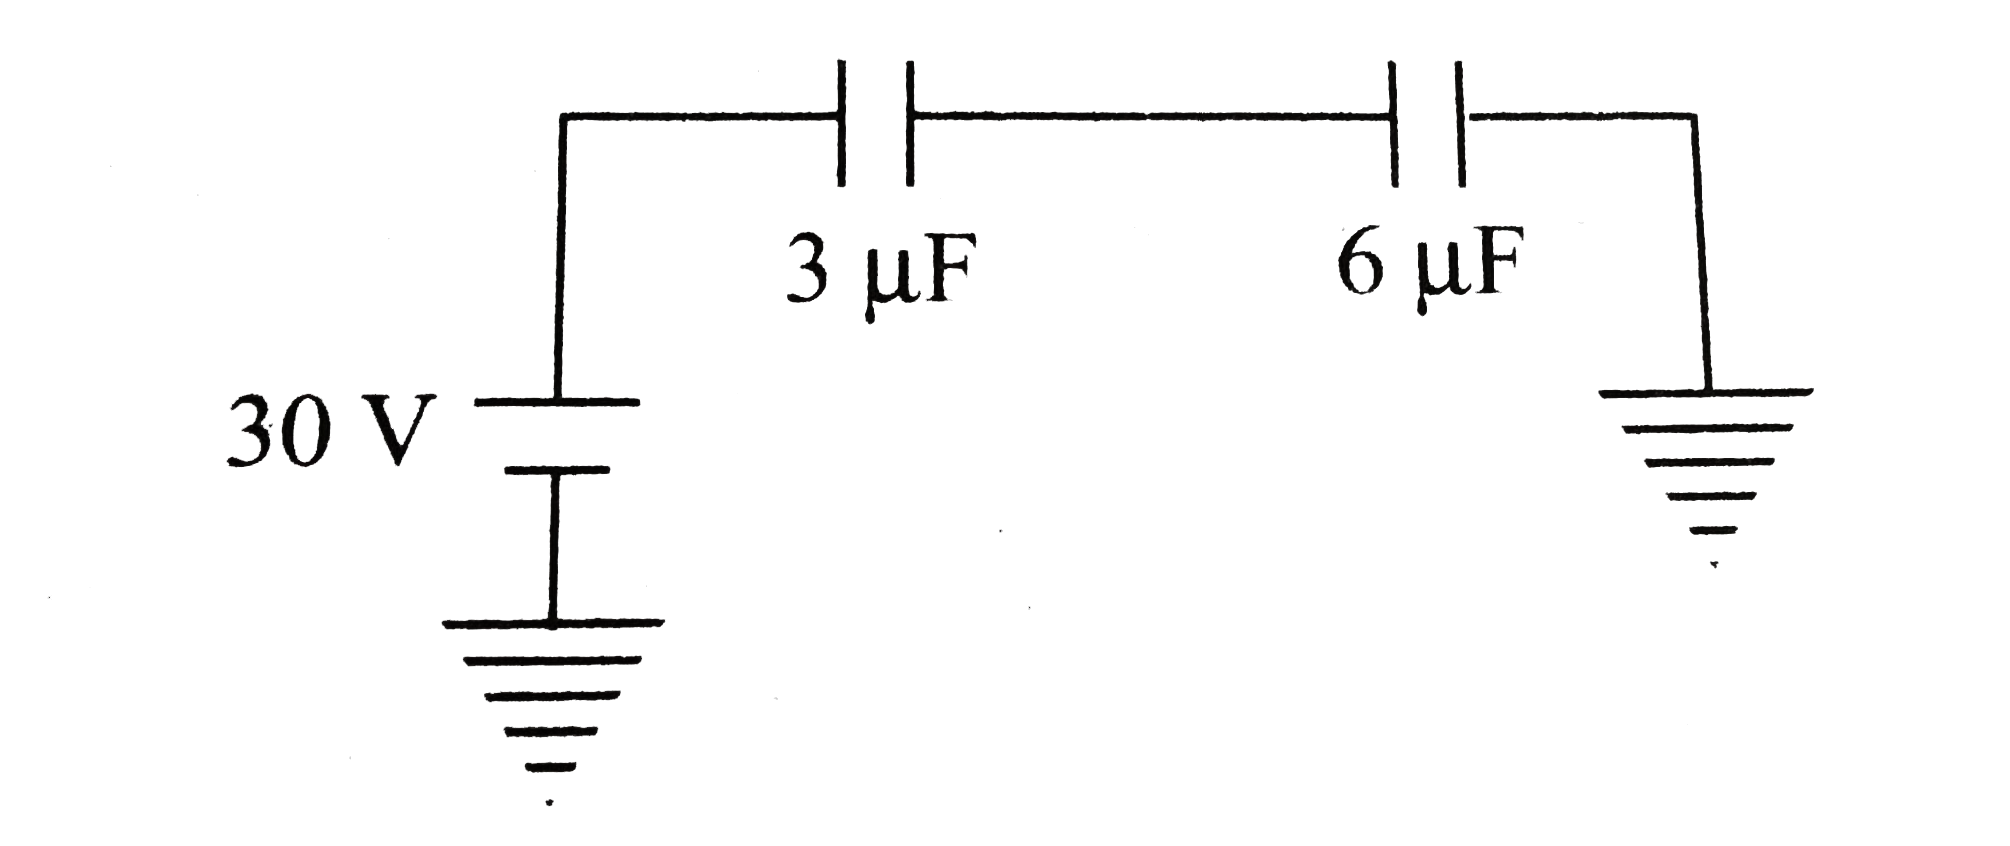
In the circuit shown in figure, the charge stored on a capacitor of capacitance 3μF is
 AzeroB40μCC60μCD90μC
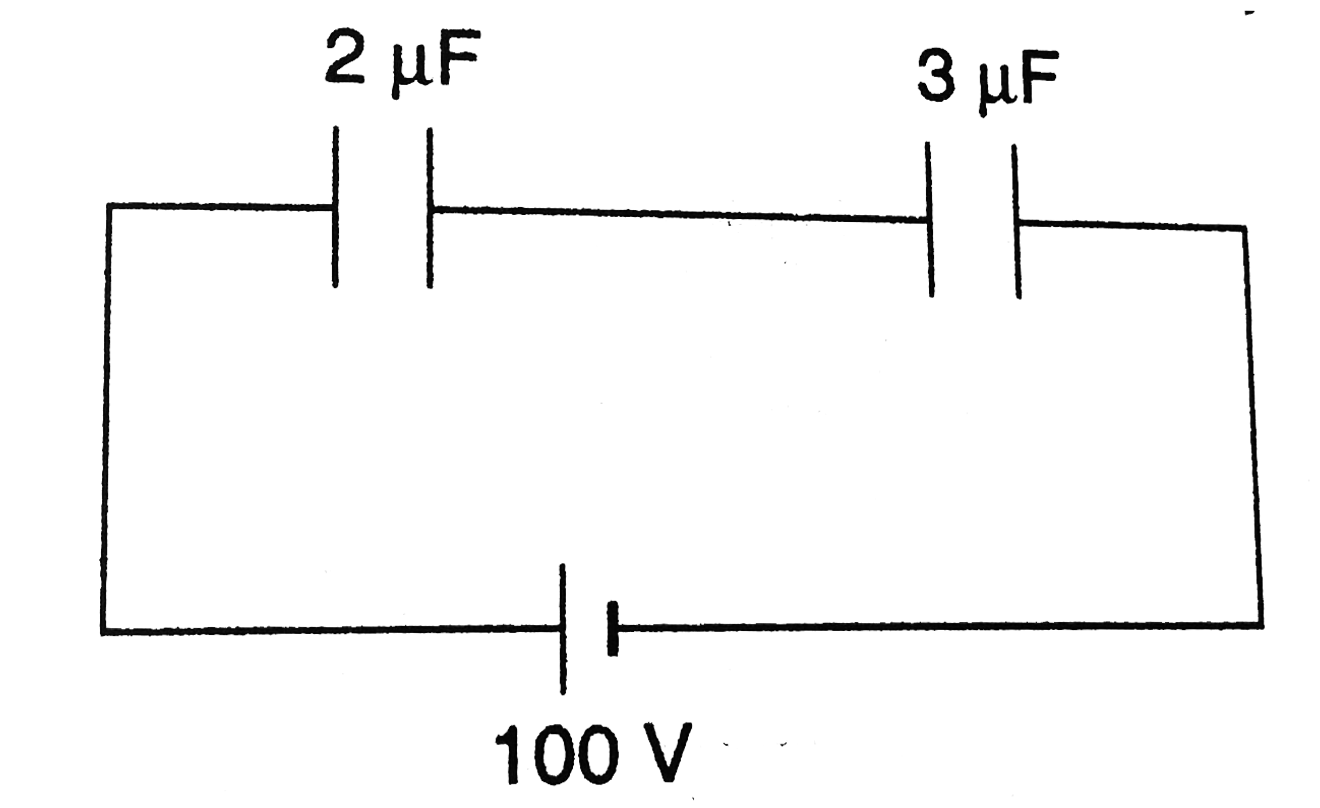
In the circuit shown in figure find

a. the equivalent capacitance
b. the charge stored in each capacitor and
c. the potential difference across each capacitor.A1.2μF 120μC 60Vand40VB1.2μF 120μC 60Vand20VC1.2μF 12μC 60Vand40VD12μF 120μC 60Vand40VPlot A&B represent variation of charge with potential difference across the combination (series and parallel) of two capacitors. Then Find the values of capacitance of capacitors.
_2019_CBT5_E01_040_Q01.png) A20μF,30μFB10μF,40μFC10μF,15μFD25μF,25μF
A20μF,30μFB10μF,40μFC10μF,15μFD25μF,25μF
The capacitance of a charged capacitor is C and the energy stored in it is U. What is the value of charge on the capacitor?
View SolutionIn the circuit shown in figure, the charge stored on a capacitor of capacitance 3μF is

View SolutionObtain the expression for the energy stored in a parallel plate capacitor of capacitance C charged to a potential V.
View SolutionIn the circuit shown in figure find

a. the equivalent capacitance
b. the charge stored in each capacitor and
c. the potential difference across each capacitor.
View SolutionPlot A&B represent variation of charge with potential difference across the combination (series and parallel) of two capacitors. Then Find the values of capacitance of capacitors.
_2019_CBT5_E01_040_Q01.png)
View Solution
